Stay Informed
Follow us on social media accounts to stay up to date with REHVA actualities


Keywords: Indoor environment, criteria, measurements, thermal comfort, air quality.
The environmental factors that define the indoor environmental quality (IEQ) are: thermal comfort, indoor air quality, acoustic comfort and visual comfort. This makes it almost impossible to describe the indoor environment in a building on a yearly basis with only one indicator. This is much easier with energy, where the different energy carriers (electricity, fuel, etc.) can be converted to primary energy or CO2 emission. For the individual indoor environmental factors, there is even not any standardized method for the estimation of a yearly performance descriptor.
Criteria for acceptable thermal conditions are specified as requirements for global thermal comfort (PMV- Predicted Mean Vote, PPD- Predicted Percentage of Dissatisfied, or operative temperature, air velocity and relative humidity) and local thermal discomfort (draught, vertical air temperature differences, radiant temperature asymmetry, surface temperature of the floor). Such requirements can be found in existing standards and guidelines like EN ISO 7730 (2007) [1], CR 1752 (1998) [2], EN15251 (2007) [3] and ASHRAE 55 (2007) [4]. Moreover for free running or natural ventilated office buildings, the criteria for an acceptable operative temperature are given as a function of the mean outdoor temperature [3] [4].
Different categories of criteria, according to [1] and [3], may be used for IEQ assessment depending on type of building, type of occupants, type of climate and national differences (Table 1). Some of the standards specify different categories of indoor environment which could be selected as a reference for the space to be conditioned. These different categories may also be used to give an overall, yearly evaluation of the indoor environment by estimating (through measurements or dynamic building simulations) the percentage of time in each category of the analyzed room or building [5].EN 15251, for example, specifies how criteria about IEQ can be established and used at the design stage; moreover it defines the main parameters to be used as input for building energy calculation and long-term evaluation of the indoor environment [6].
But, if thermal comfort criteria have to be met 100% of the time of occupancy, including extreme weather conditions, the heating and/or cooling capacity of any HVAC installation would be prohibitive. Economic and/or environmental considerations lead to a more pragmatic position of allowing the thermal conditions to exceed the recommended ranges for a limited period time. There is a need to quantify through some suitable index long term comfort conditions to compare alternative design solutions and long term measurements during the post-occupancy phase in existing buildings.
Table 1. Example criteria for PMV-PPD, operative temperature, relative humidity and ventilation (CO2 concentration) for typical spaces with sedentary activity. [3]
Category | Thermal
Comfort indexes | Operative
Temperature range | Relative
Humidity | Ventilation | ||
PPD | PMV | Winter 1.0clo/1.2met | Summer 0.5clo/1.2
met | CO2 Above
outdoor | ||
[%] | [/] | [°C] | [°C] | [%] | [ppm] | |
I | < 6 | -0.2< PMV <+0.2 | 21.0 ‑ 23.0 | 23.5 ‑ 25.5 | 30 ‑ 50 | > 350 |
II | < 10 | -0.5< PMV <+0.5 | 20.0 ‑ 24.0 | 23.0 ‑ 26.0 | 25 ‑ 60 | 350 ‑ 500 |
III | < 15 | -0.7< PMV <+0.7 | 19.0 ‑ 25.0 | 22.0 ‑ 27.0 | 20 ‑ 70 | 500 ‑ 800 |
IV | > 15 | PMV > +0.7 | < 19.0 ‑ 25.0< | < 22.0 ‑ 27.0< | < 20 ‑ 70< | > 800 |
Note:
In standards like EN ISO 7730, EN15251 and EN 13779 (2007) [7] categories or
classes are also used; but they may be named differently (A, B, C or 1, 2, 3
etc.).
The use of categories during the design stage to evaluate different design options can be done by yearly building energy simulations. In these calculations, the categories may be clearly adopted and performance indicators can be expressed as percentage of time where the indoor environment falls into the different categories. The use of categories to express the quality of the indoor environment during building operation can be based on measurements of the physical parameters. The present paper deals with thermal environment and indoor air quality assessment. Based on data from measurements in an existing office building, different methods for long and short term indoor climate investigations are presented and discussed.
The case study is an office building located in Denmark (Lat: 55.5°, Lon: 9.75°). The building has a complex shape (see Figure 1). The total volume is mainly occupied by bank offices, but also a bookshop, a café and a real estate agent office is located at the ground floor level, around a central plaza. The working areas (basically open space offices) are mainly located on three open terraces, called “plateaus”, internally connected by broad staircases. On each floor also single offices, meeting rooms and other rooms for dedicated services are placed. The building envelope is made mainly by structural glass (U = 1.1 W/m2K), with the transmission coefficient (visible light/solar energy) equal to [0.64/0.35]. The office is normally occupied from 8:00 to 18:00, from Monday to Friday.
The indoor environmental control of the building is divided into two main strategies:
· Type 1: Convectors and balanced mechanical ventilation for heating and ventilation control during the winter period, TABS (Thermo active building system) and HVAC system for cooling and ventilation control during summer. This kind of system is mainly applied in single offices and meeting rooms.
· Type 2: Embedded water based radiant system, and convectors for thermal control. Natural ventilation by controlled window openings to provide acceptable indoor air quality. This kind of strategy is applied in all the large spaces, like in the offices situated on the terraces (plateaus), in the canteen and in the central square at the ground floor.
The monitoring campaign started in July 2010. In this paper, the data collected during winter 2010/2011 and summer 2011 are presented. During that period, measurements of air temperature, operative temperature, relative humidity and CO2 concentration were collected every 10 minutes in 12 different rooms. Meanwhile, an external weather station collected data of the outdoor air temperature, relative humidity, wind velocity/directions and solar irradiance.
In this paper the investigation of IEQ focuses on two spaces. The first (ROOM A) is an open space office located at the first floor and characterized by control strategy Type 1. The second space (ROOM B) is another open space also located on the first floor, but characterized by control strategy Type 2 (Figure1).
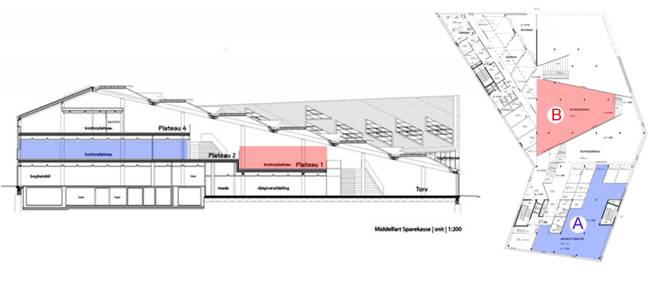
Figure 1.
Case study building (vertical and horizontal sections). In evidence the two
analyzed rooms located at the first floor (ROOM A and ROOM B).
The aim of this investigation is to show and compare different method for describing thermal comfort and indoor air quality. In this paper long and short term evaluation applied to the two analyzed office rooms are addressed and discussed.
Standard EN 15251 [3], in annex F (“Long term evaluation of the general thermal comfort conditions”), suggests three different methods (A,B,C) to evaluate and represent the comfort conditions over time (season, year), based on data from measurements in real buildings or obtained by dynamic computer simulations.
One methodis based on the calculated number (or %) of hours in occupied period when the PMV or the Operative Temperature are outside a specified range.
Application of this method is shown in Figure 2. Here the thermal performance of the two analyzed rooms, in terms of percentage of
time according to the four categories of operative temperature and PMV suggested
by the standard (Table 1), was evaluated both for winter (a) and summer (b) periods.
Other
physical parameters, monitored or deriving by dynamical simulations, can be
represented with the same approach. Figure
2 also shows the
percentage of time when the CO2 concentration and the Relative
Humidity exceed the respective ranges indicated in Table 1.
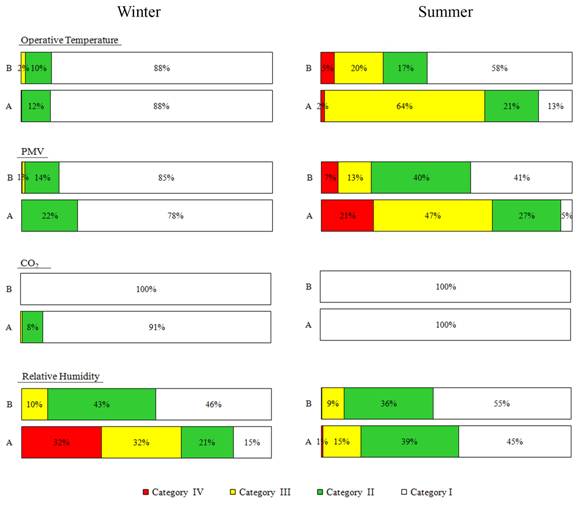
Figure 2. Indoor
Operative temperature, PMV, Air quality (CO2 concentration) and Relative
humidity measurements, expressed as percentage of time in four categories, for
winter and summer periods.
Operative
temperature and PMV evaluations, show some differences in the results: the operative
temperature evaluation gives slightly better results compare to the PMV
evaluation. While the first considers just the operative temperature, the PMV
calculation depends by physical parameters (air temperature, relative humidity,
air velocity, mean radiant temperature) and subjective parameters (thermal
resistance of the clothes and metabolic rate). In this case study the physical
parameters, except to air velocity, were monitored in continuous. Trough spot
measurements performed in different periods of the year, it was however possible
to establish that the air velocity was averagely around 0.10 [m/s]. For
the PMV calculation the air velocity value was then kept constant as 0.10 [m/s].
Regarding the subjective parameters, the metabolic rate used in the analysis was
the one indicated by standard ASHRAE 55/2004 for “Office activity-Filing,
seated”, 1.2 [met]. Also the clothing insulation value was kept constant: 0.5
[clo] in summer period and 1 [clo] in winter period. Due to these assumptions,
the PMV calculation does not represent the real PMV of a specific occupant in
the room during the monitored time, but it represents the average evaluation of
the thermal environment according to the comfort standards for office
buildings.
From Figure 2it is possible to note that, during
the heating period, both the two control strategies, Type 1 and 2 (Room A and
B) were able to provide a very good thermal quality in the analyzed rooms. Only
a little percentage of time (less than 2%) was in Category III, while for the 88%
of time operative temperature felled in Category I. The situation was different
in summer period. As shown in the figure during the warm season the thermal
quality in both the rooms presents a large percentage of time when the
temperature felled in Category III and also a little in Category IV.
This method
is a fine way to present the yearly results, but it is not possible to see if
the problem is a too warm or too cold environment.. If we analyze Category IV,
splitting it in two parts, Category IV(-) when T<22°C and Category
VI(+) when T>27°C in summer, it is possible to see that the
percentage of time when the temperatures in room B exceed the upper range is
negligible. This fact is better shown in the operative temperature profiles of Figure 3. According to this analysis the performance in
summer is not acceptable because temperatures are too low for a big percentage
of time for both cases, A and B. With an optimized control setting under
cooling can be avoided and energy saved
Figure 3.
Operative temperature profiles during the occupied hours for Rooms A and B in
summer period.
Figure 3also show the bigger fluctuation of operative temperature of Room B
respect to Room A during the working day. The mechanical ventilation in room A contributes
to reach the temperature of 23°C with very small fluctuations (< 2-3 K).
.While in the natural ventilated Room B, the variations of the operative temperature
is larger (> 9 K). The control of the natural ventilation was
based on controlled window openings according to indoor temperature and CO2 concentration.. Looking at this
graph, and at the values of Table 1, it can
be observed that most of the time the outside temperature was lower than the
indoor temperature, so natural ventilation could be a useful and economic way
to remove and control the heating loads during summer; but to avoid under cooling
and the large variations in operative temperature the control of the window
openings must be improved.
From Figure 2 it is also possible to see that for both the rooms, and for both seasons, the CO2 concentration was very good: the percentage of time when the air quality was in Category I was always greater than 91% in winter period and equal to 100% in summer.
The same figure also shows the relative humidity evaluation: in that case emerges that for both seasons, the best results are in Room B but, as already highlighted before, from this representation is not possible to see that the values falling from Category II to Category IV are lower/higher (winter/summer) than the lower/upper limit of Category I.
The main idea behind the categories for IEQ assessment is to use them from the design up to the post-occupancy phase for buildings and HVAC systems analysis, in order to provide evaluations about the indoor environment over a longer period like a year. The intention is not to force the operation of a building within one class the whole year, but to critically analyse the possible change of classes over the year. In fact, even if a building is designed for a lower category, it will still be possible to operate the building the majority of the year in a higher category. For building with HVAC systems the categories are based on different levels of the PMV-PPD index and/or operative temperature. If the long term evaluation also will be used to analyse a problem and find solutions it is important to evaluate the deviations outside the categories on the warm and cold side separately. In practice, very often, operative temperature is the reference parameter used in field investigations. It is, however, questionable if fixed temperature ranges should be used for a long term evaluation. In fact, people often adapt their clothing according to the outside climate: this is true for both mechanical and naturally ventilated buildings. This aspect needs to be deeper studied in future researches, in order to take this into account for category range definition.
In this paper the use of categories for the thermal environment and indoor air quality assessment in an office building is performed. Two different environment (naturally ventilated and mechanically ventilated), part of the same office building, are compared. Results and elaboration about long term monitoring in the selected rooms are shown.
Different methods of classification for the
long term evaluation suggested by the standards are analysed, and critical
aspects are highlighted. A variation of application of one of the method
suggested by the standard EN ISO 15251 is presented.
1. CEN. 2005. Standard ISO EN 7730. Analytical determination and interpretation of thermal comfort using calculation of the PMV and PPD indices and local thermal comfort. Brussels.
2. CEN. 1998. Standard CR 1752. Ventilation for Buildings: Design Criteria for the Indoor Environment. Brussels.
3. CEN. 2007. Standard EN 15251. Indoor environmental input parameters for design and assessment of energy performance of buildings- addressing indoor air quality, thermal environment, lighting and acoustics. Brussels.
4. ASHRAE. 2007. ASHRAE Standard 55-2007. Thermal environment conditions for human occupancy. Atlanta.
5. Nicol F and Wilson M, “An overview of the European Standard EN 15251”. Proceedings of Conference: Adapting to Change: New Thinking on Comfort. Cumberland Lodge, Windsor, UK, 9-11 April 2010.
6. Ansaldi R, Corgnati SP, Filippi M, “Assessment of the indoor thermal quality: methodology and application”, Chapter in “Handbook on Environmental Quality”, Nova Science Publishers Inc - New York 2010, ISBN 1607414201
7. CEN. 2004. Standard EN 13779. Ventilation for non-residential buildings - performance requirements for ventilation and room-conditioning systems. Brussels.
Follow us on social media accounts to stay up to date with REHVA actualities
0