Stay Informed
Follow us on social media accounts to stay up to date with REHVA actualities
At the end of 2009, CDC initiated the GRECO project with its asset manager AEW Europe, to anticipate the French environmental law "Grenelle 2". In accordance with the EPBD directive, the Grenelle 2 stipulates a regulatory obligation to reduce by 38% the energy consumption of existing commercial property stock by 2020. Although this law had not been formally enacted by an implementing decree, CDC was willing to promptly address the issue so as to limit the depreciation risk for its existing portfolio since refurbishment works would likely need to be undertaken, and to spread the refurbishment cost over time. In order to benefit from a broader view, this project was applied to both residential and commercial properties. A dynamic tool was built to store financial, environmental and technical data, help investment decision-making and monitor the implementation of the action plans.
The project
was first applied to assets in direct management and ownership. This portfolio
represents one fourth of the total CDC’s exposure to real estate. It consists
in approximately 250 000 m², two thirds of which correspond to
residential properties.
The impacts of future regulatory requirements on this existing portfolio were assessed through the analysis of the refurbishment work required to comply with the 38% objective either globally or asset by asset. First, energy audits were carried out on the whole portfolio. Actual consumption invoices (tenants and owner) were compared to thermal calculations so as to determine a breakdown of energy consumption per use (heating, cooling, lighting, ventilation, DHW, lighting, others). Recommendations were then issued to improve energy efficiency for each energy use. The resulting actions were stored in the platform, so that they could be combined into different scenario by the asset manager. The resulting refurbishment scenarios were assessed both according to energy efficiency and to cost effectiveness, as presented in Figure 1.
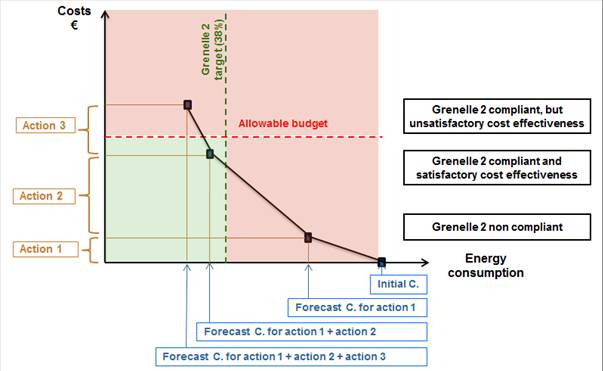
Figure 1. Underlying principles of the GRECO Project (Greco project).
A dynamic
internet platform was thus developed to:
·
Store the collected data: The platform provides a space to store
simultaneously financial, technical and environmental data.
·
Help investment decision-making: The platform allows the asset manager to
analyse the financial and environmental impacts of different refurbishment
scenarios. The possible energy efficiency measures recommended by the thermal
engineers on each asset are stored in a database. The asset manager can combine
these actions to build refurbishment scenarios and assess their impact on the
overall portfolio performance. He can also monitor the impact of buy and sale
decisions.
·
Monitor the implementation of the action plan: the tool is designed to
monitor both the estimated consumption from the energy audits and the actual
consumption.
The platform is designed to gather information on the different assets along the buildings ‘hold period. This includes building plans, maintenance and operation expenses, energy and water consumptions from tenants’ invoices… For new acquisitions, the platform should be able to store information from due diligence. Ultimately, this should provide the asset manager with an extensive “building passport” for all assets, with technical, financial and environmental indicators.
The energy audits aimed to assess intrinsic building consumption. They included all energy consumption for heating, air conditioning and ventilation. Only plug loads for common areas were accounted for. Common hypothesis were used for occupancy, air change rate and temperature set-points. The results pointed out a relative homogeneity between buildings from the same period of construction (Figure 2). As shown in previous studies [[1]], the assets built during the seventies have the highest energy consumption. Yet, this structure differs when analysing the cost of the energy saved thanks to the refurbishment work (cost efficiency of the refurbishment) (Figure 3)and the energy consumption reduction target that can be achieved at a reasonable cost (Figure 4).
Figure 2. Average primary energy consumption per construction period.
Although they present the highest energy consumption, the properties from the seventies are among the easiest to refurbish. For this building group, it appears possible to reduce energy consumption by 48% for a cost efficiency of approximately 1.8€ per kWhf saved [[2]]. Conversely, the more recent buildings require important investment to reach only low energy consumption abatement.
Figure 3. Average final energy consumption abatement cost per construction period.
Figure 4. Final energy consumption reduction target per construction period.
These results are consistent with life cycle considerations and building obsolescence[[3]]. On average, heavy refurbishment works and equipment replacements occur after a timeframe of twenty to thirty years. Buildings from the last construction period will not be due for those refurbishment works until after 2020. It would not be cost efficient to refurbish them sooner, other than through regulation and lighting optimisation, which would not concern the building structure or the HVAC system.
Since residential properties do not yet present a legal obligation to refurbish, it was chosen to set a reduction target by 2030 for recent residential buildings rather than by 2020. Nearly all the refurbishment works recommended are feasible in occupied sites.
The first stage of this project has highlighted several indicators that were examined simultaneously for refurbishment decision-making. Main figures are presented in Table 1.
Table 1. Greco Project - Main indicators.
Portfolio | Time
frame | Refurbishment
costs (€/m²) | Cost
efficiency (€/kWhf) | Refurbishment
cost to asset value (%) | Primary
energy reduction target (%) |
Commercial | 2020 | 173 | 1.34 | 4.0% | 39% |
Residential 1 | 2020 | 100 | 1.07 | 2.1% | 36% |
Residential 2 | 2030 | 288 | 3.06 | 4.1% | 32% |
The total
refurbishment cost linked to energy efficiency upgrades appeared as mostly
covered by the traditional budgets for major repairs and maintenance. This
corresponds to the fact that major upgrades were timed to coincide with the
replacement of components at the end of their life. The additional cost is
difficult to assess and results mainly from the choice for more efficient
installations. At a building level, the refurbishment cost and resulting
payback periods were not the only criterion used for decision-making since they
do not inform on cost efficiency or impacts on assets value.
Comparing
the refurbishment cost and the energy consumption abatement target informs on
the cost efficiency of the refurbishment scenario. It appears as the most
suitable indicator to decide between different actions to meet the reduction
target. The energy audits (Figure 4) highlighted discrepancies between
assets with cost efficiency ranging from less than 1 to more than 8 euros per
kWhf for reduction targets between 30 to 40%.
When
accounting only for energy expenses, the investment payback period exceeds 8
years. Yet savings in energy expenses are not the only benefit from energy
upgrades. The impact on the asset value should also be considered. The
comparison between refurbishment cost and asset value was used to indirectly
assess the risks linked to the regulatory obsolescence generated by "Grenelle
2". This ratio will depend on the functional quality of the asset and its
location. Even with long payback periods, it may be more beneficial to
refurbish if the asset market is likely to be concerned with a demand for greener
buildings.
The impact of environmental upgrades on value was illustrated through a heavy refurbishment project which was undertaken at the beginning of 2010. This project was used as a case study to explore the links between energy upgrades and their impacts on asset value. Since the building is now completely commercialised, it was possible to compare predictions with effective data.
Savings on energy expenses only cover a small part of the investment required by the refurbishment. Does this mean that energy upgrades are not worth it for the investors? Different studies have shown that the benefits offered by sustainable buildings amount to more than energy and water savings. In office buildings, sustainable features improve occupants ‘comfort therefore boosting the employees’ productivity. Academic studies have proven that these benefits are already reflected in the market with approximately a 10% premium in market values, a 6% premium in rental values and an increased liquidity in transactions (Table 2). Although one can wonder whether this premium will last or whether it will evolve into a discount for buildings with poor environmental performance, environmental features can no longer be ignored in refurbishment decision-making.
Table 2. Main results from academic studies on “green value” for office buildings.
References | Certifications | Market value | Rental value | Occupation rate |
Fuerst and McAllister (2008) | LEED, Energy Star (USA) | 31-35% | 6% | |
Wiley et al. (2008) | LEED (USA) | | 15-17% | 16%-18% |
Energy Star (USA) | | 7%-9% | 10%-11% | |
Miller et al. (2008) | LEED (USA) | 10% | | |
Energy Star (USA) | 6% | | | |
Kok (2008) | LEED, Energy Star (USA) | 16% | 6% | |
Pivo and Fisher (2009) | Energy Star (USA) zones under redevelopment | 6.7%-10.6% | 4.8%-5.2% | 0.2-1.3% |
Fuerst and McAllister (2010) | LEED (USA) | | | 8% |
Energy Star (USA) | | | 3% | |
Eichholtz al. (2010) | LEED (USA) | 11% | 6% | |
Energy Star (USA) | 13% | 7% | | |
Chegut et al.(2011) | BREEAM (Londres, GB) | 26% | 21% | |
Kok, Newell and MacFarlane (2011) | NABERS 5 stars (Australia) | 9% | 3% | |
Green Star (Australia) | 12% | 5% | | |
Fuerst and McAllister (2011) | Energy Star, LEED (USA) | 25%-26% | 4%-5% | |
Franklin building is an office building of 7500 m², built in the 1930´s and located in Paris Central Business District. In the beginning of 2010, as two of the main leases came to an end resulting in a two-thirds vacant building, a heavy refurbishment was decided. The project aims the HQE certification and the BBC[[4]] refurbishment energy label. It should be delivered by the end of 2012. The building is already completely commercialised with above average rental prices.
In order to assess the added value from the environmental retrofit, different scenarios were considered:
· Business As Usual (BAU): No refurbishment is implemented. Only standards maintenance operations are performed. The rental prices used correspond to rental prices for second hand buildings. The asset liquidity is deemed as poor thus leading to higher exit yield and higher vacancy.
· Conventional Refurbishment (RT): As regards energy efficiency, the refurbishment does not go beyond the current regulatory requirements. The asset is valued as first-hand building but does not benefit from a green premium (average rental price in the first-hand market). The asset liquidity is deemed to decrease over time.
· Green Refurbishment (HQE): This is the actual situation. The energy upgrade enables the owner to benefit from a green premium in rental prices and very good liquidity in the market.
The valuation was performed using a discounted cash flow method. To assess for the difference in values due to the absence of environmental features, longer vacancy periods in between leases were used in addition to the differences in rental and exit values mentioned previously.
The main results are presented in Table 3.
Table 3. Main results from the Franklin case study.
BAU | RT | HQE | |
Investment (€) | 0 | 13 000 000 | 18 300 000 |
Annual rental revenue (full
occupancy) (€) | 4 288 611 | 5 685 730 | 6 054 200 |
Annual Rental growth rate (%) | 1.50% | 1.60% | 1.70% |
Discount rate (%) | 7.75% | 6.80% | 6.70% |
Vacancy period between leases
(months) | 12 | 10 | 9 |
Maintenance and operation costs
(including vacancy) (€) | 124 257 | 91 855 | 76 310 |
DCF t=0 calculation (accounting
for investment costs) (€) | 52 748 917 | 82 191 774 | 88 243 576 |
Asset value t=1(€) | 52 748 917 | 89 926 650 | 100 377 224 |
Figure 5. Evolution of the cumulated discounted cash flows over time.
For Franklin building, the discounted cash flow calculation (Figure 5) shows that the two refurbishment scenarios (RT and HQE) lead to lower cash flows respectively until years 7 and 9. Yet, over the long run, they present the highest NPV.
However, as regards value, a refurbishment appears financially beneficial from the start since it enables the owner to increase its rental revenue and decrease future depreciation risks. The initial investment costs are offsets by the future benefits, in particular due to the higher exit rate that can be expected. HQE refurbishment which investment costs represent approximately a third of the initial building value enabled the investor to nearly double the initial value of its asset. In addition, it leads to a 10% value premium compared to RT refurbishment. These results highlight that traditional payback calculations accounting only for energy savings are misleading. They do not account for the main benefit of green refurbishment which appears in the long run.
As energy retrofits become a regulatory requirement, investors will require energy efficiency strategy at a portfolio scale. Decisions will not only concern choosing refurbishment scenarios within buildings according to technical criteria, but will also require prioritising between assets to maximise the value of the portfolio over time according to financial and environmental criteria.
Greco project was designed to meet these stakes. The first phase of this project has already been implemented with the design of a platform to store assets characteristics and possible refurbishment works. The data collection was a crucial step for this phase since data were scattered among the different actors. The main conclusion from the refurbishment recommendations highlighted that energy upgrades will not require an additional budget but will mainly be supported through a reallocation of the existing major repairs and maintenance budget.
The main benefit from green refurbishment lies in its impact on long term value. Whether on a pessimistic (depreciation of poor performing building) or on an optimistic scenario (premiums for the environmental-friendly building), green retrofit should not be only analysed through conventional paybacks period but considerations on their impact on the possible evolutions of assets value should be accounted for. Value distributions instead of a single expected value can also be used to inform on risks and uncertainties.
Chegut , A., Eichholtz,P.,
Kok, N. (2011) The Value of Green Buildings: New Evidence from the United
Kingdom. European Centre for Corporate Engagement. Available on ECCE
website.
ORIE (2012) Obsolescence et Grenelle 2.Report from the “Obsolescence and Grenelle 2” Working group.
Sayce, S. Sundberg, A, Clements, B. (2010) Is sustainability reflected in commercial property prices: an analysis of the evidence base. RICS Research Report.
Reed, R. Warren-Myers, G. (2010) Is sustainability the 4th form of obsolescence? PRRES conference 01/2010.
[1] In particular, results obtained are consistent with Sinteo Barometer on energy consumption (an annual French Barometer on energy consumption and refurbishment costs).
[2]Electricity price in France ranges
between 8c€/kWh and 12.6c€/kWh.
[3] In its 2012 report on the impact of “Grenelle 2” on building obsolescence, the research center on commercial real estate in Paris region, ORIE, assessed the investment required to achieve Grenelle 2 targets by considering building refurbishment cycles. It showed that the target was reasonably achievable if refurbishment work were implemented according to the building maintenance cycle and if energy consumption was optimised through regulation.
[4]BBC label
corresponds to an intrinsic primary consumption of 80kWh/m².year.
Follow us on social media accounts to stay up to date with REHVA actualities
0