Stay Informed
Follow us on social media accounts to stay up to date with REHVA actualities


Key words: Renewable Energy Ratio, RER, share
of renewable energies, renewable energy supply, Net Zero Energy Building, conversion
factors, weighting factors. |
European and national laws ask for an increased ratio of renewable energy sources and carriers of the total energy consumption of buildings. While the Renewable Energy Directive (RED) gives only a framework for national implementations in the EU and the Erneuerbare-Energien-Wärmegesetz in Germany focuses on the partial coverage of the thermal energy demand of buildings or according compensatory measures [EEWärmeG 2012], REHVA introduces a performance indicator to calculate the actual fraction of used renewable energy sources [Kurnitski 2013]. It is named ”Renewable Energy Ratio (RER)” and suggested in a similar manner in the proposal of the recast of DIN EN 15603-2013 where it is named ”Share of renewable energy”.
Both indicators determine the respective shares of renewable and non-renewable sources of the (local) energy generation, the used end energy including the environmental energy and all energy carriers. The total amount of the primary energy from renewable sources results from the difference between the total primary energy and non-renewable primary energy of all observed energy flows which cross the balance boundaries. Thus, all conversion and system losses within the balance boundary are included. Energy losses outside of the balance boundary are represented by primary energy conversion factors of the various energy carriers. Exported energy which is credited to the amount of the respective displaced primary energy carrier in the grid infrastructure equalizes energy supply. According to the EPBD the consideration of use-specific consumers like appliances or IT is optional. In the calculation of ”RER” they have influence on the level of end energy demand as well as on the self-consumption respectively the amount of export of generated electricity as these shares result from a (monthly) balance of energy generation and its fictitious self-consumption (see Table 3). Therefore all consumers are included in this study. According to the draft from REHVA, the formula below applies for calculating the ”Renewable Energy Ratio (RER)” [Kurnitski 2013b].

where
RERp is the Renewable Energy Ratio based on total primary energy
Eren,i is the renewable energy produced on site or nearby for energy carrier i
Edel,i is the delivered energy for energy carrier i
Eexp,i is the exported energy for energy carrier i
fdel,tot,i is the total primary energy factor for the delivered energy carrier i
fdel,nren,iis the non-renewable primary energy factor for the delivered energy carrier i
fexp,tot,i is the total primary energy factor of the delivered energy compensated by the exported energy for energy carrier i
The ”RER” procedure follows the EPBD as a significant extent of the energy demand has to be covered by energy from renewable sources produced on-site or nearby and includes also aero-, geo-, and hydrothermal energy beside wind, solar, hydro, biomass and non-fossil gases as renewable energies. Passive heat gains (e.g. solar radiation, waste heat of internal loads) are neither included in the calculation as a distinction is made between ”on-site” and ”off-site” generation.
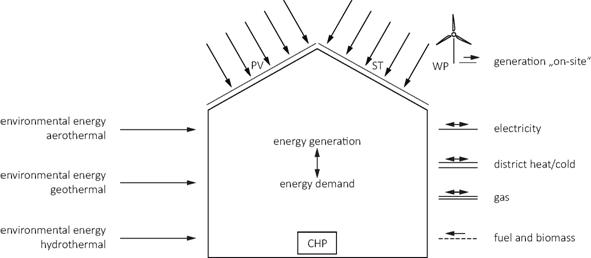
Figure 1. Representation of the calculation procedure of the Renewable Energy Ratio (RER) proposed by REHVA. The building is set as balance boundary expanded by generation and supply of renewable energy close to the building (”on-site”). The environmental energy is included. PV: photovoltaic; WP: wind power; ST: solar thermal; CHP: combined heat and power.
In buildings with an equalized yearly energy balance on the basis of primary energy the addition of normally not balanced environmental energy should lead to high rates of renewable energy supply. Using cumulative annual values of a fully equalized primary energy balance based on monthly simulation data of energy demand and generation this is checked by a Net ZEB (Nursery ”Die Sprösslinge”; detailed information in [Voss Musall 2013]) and the following six respectively twelve technology options:
1. ground source heat pump (abbreviation ”HP”)
2. gas-powered mini-CHP coupled with a peak load calorific boiler (”CHP”)
3. biomass boiler (”Bio”)
4. gas condensing boiler (”Gas”)
5. district heating (”DH”)
6. pellet-CHP coupled with a biomass boiler (”CHPren”)
The six technology options are calculated in each case with and without solar thermal hot water heating (coverage of 60% of the DHW demand by vacuum tube collectors) and provided with the additive abbreviation ”+ST”. The annual balances are calculated on basis of four sets of conversion factors for primary energy which are part of current or future energy saving directives (P1 – P3, see Table 1) or referenced in the literature (P4, see Table 2):
P1:symmetrical conversion based on German DIN V 18599 – 2009
P2:asymmetrical conversion based on German DIN V 18599 – 2011
P3:symmetrical conversion based on European EN 15603 – 2008
P4:(future) quasi-dynamic weighting based on [Großklos 2013]
The two currently valid options P1 and P3 are based on static (yearly average values) and symmetric weighting factors. The two other options are included to make use of asymmetric (P2) and quasi-dynamic factors (P4) for electricity, while current national factors are used for all other energy carriers. These ”strategic weighting factors” may be implemented in the future in order to favour or discourage the use of specific technologies and/or energy carriers in a scenario of higher penetration of renewables in the electricity generation mix. The set of asymmetric electricity factors shown in Table 1 includes a factor of 2.8 kWhp/kWhS for electricity generation/export and 2.4 kWhp/kWhS for demand/import. The quasi-dynamic electricity conversion factors for 2020 in Table 2 are based on [Großklos 2013]. Because of the used scenario of high decarbonisation in Germany the values show a great seasonal variation between summer (more renewable electricity available) and winter months (more coal power used). As for P4 only factors for the non-renewable share of the cumulative energy consumption are available the required factors of the renewable and non-renewable shares (ftot) are defined especially. For this purpose, it is assumed that the difference between the two values is similar in size and constant like the known annual mean values for the conversion of the German electricity in recent years, according to [DIN 18599 2009; DIN 18599 2011] und [GEMIS 2013]. A difference in the amount of 0.4 kWhP/kWhS can be identified and is set constantly, as fossil fuels offset fluctuating monthly renewable energy yields in the electricity grid infrastructure.
The shown factors P1 – P4 are used in the primary energy balances and the according ”RER”-calculations.
To illustrate the impact of not exactly equalized yearly primary energy balances each set of factors is additionally calculated with on the one hand a not completely equalized yearly balance following the meaning of the Swiss certificate ”Minergie-A” (the user specific electricity demand is included in the overall energy demand but not balanced by energy generation, see [Minergie 2010]) and on the other hand a positive balance. For the additional calculations only the technology options ”HP” and ”Bio+ST” are selected.
Table 1. Currently used or proposed conversion factors for primary energy in Europe and Germany.
Energy carrier | Norm | EN 15603 | DIN V
18599 | |
Year | 2008 | 2009 | 2011* | |
set
of factors | P1
[kWhP/kWhS] | P2
[kWhP/kWhS] | P3
[kWhP/kWhS] | |
Electricity (power grid) | fnren | 3.14 | 2.60 | 2.40** |
ftot | 3.31 | 3.00 | 2.80 | |
Natural gas | fnren | 1.36 | 1.10 | 1.10 |
ftot | 1.36 | 1.10 | 1.10 | |
Oil | fnren | 1.35 | 1.10 | 1.10 |
ftot | 1.35 | 1.10 | 1.10 | |
Wood pieces / wood pellets | fnren | 0.09 | 0.20 | 0.20 |
ftot | 1.09 | 1.20 | 1.20 | |
District heat | fnren | 0.80*** | 0.70 | 0.70 |
ftot | 0.80*** | 0.70 | 0.70 | |
Environmental energy (solar energy,
geothermal energy, ambient heat, etc.) | fnren | 0.00 | 0.00 | |
ftot | 1.00 | 1.00 | ||
* Will be used since May 2014 ** In case of electricity export also the renewable share is included (factor 2.8 kWhP/kWhS) *** As no factor for heating networks is specified, an average factor of known European factors is calculated fnren: Primary energy conversion factor for non-renewable energy; ftot: primary energy conversion factor for non-renewable and renewable (total) energy | ||||
Table 2. Factors of the non-renewable share of the cumulative energy for P4 following [Großklos 2013] (fnren) and factors of renewable and non-renewable shares (ftot) according to an own adaptation.
Factor | Annual
average value | Jan | Feb | Mar | Apr | Mai | Jun | Jul | Aug | Sep | Oct | Nov | Dec |
ftot | 1.63 | 1.63 | 1.63 | 1.63 | 1.63 | 1.63 | 16.3 | 1.63 | 1.63 | 1.63 | 16.3 | 1.63 | 1.63 |
fnren | 1.23 | 1.30 | 1.29 | 1.25 | 1.22 | 1.15 | 1.17 | 1.20 | 1.19 | 1.22 | 1.27 | 1.30 | 1.21 |
The results of the ”RER” calculations correlate mainly with the respective balance result. The equalized primary energy balances on the basis of symmetrical and static weighting always have a Renewable Energy Ratio in excess of 100% (see Figure 2). If the balance result drifts to positive or negative, this also applies to the deviation of the Renewable Energy Ratio from the mark of 100%.
In the case that more than one energy carrier is compensated within the primary energy balance, the difference between the two related factors influences the ”RER” result quite much. This is due to the fact that the electricity import and export in the ”RER” calculation is weighted with both renewable and total shares of primary energy conversion. For the gas-based technologies ”Gas” and ”CHP” a large deviation from the mark of 100% is visible. This growth if electricity from CHP is exported to compensate the gas supply. Here, the electricity of the gas-CHP is not considered as local and renewable energy and is therefore only used to reduce the electricity supply (by directly covered energy demands) and to increase the electricity export. Thus, the CHP-electricity is weighted with the higher weighting factors for exported electricity and reduces the overall energy consumption of the building in a significantly greater extent than it would be the case if it would be considered as not weighted but renewable electricity. The effect is smaller for P3, because the difference between the non-renewable and total share of primary energy is smaller than for P1. Also the effect is highlighted by the biomass-fired CHPren whose renewable generated electricity also reduces the electricity demand but is not weighted with any factors (see Table 4).
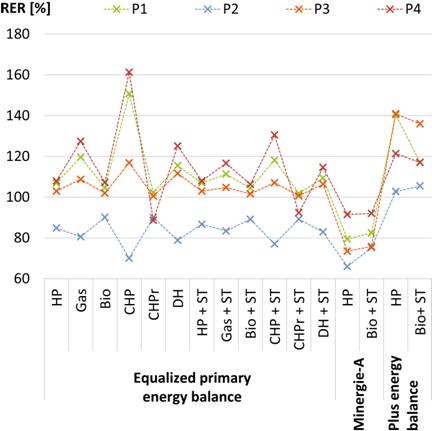
Figure 2. Representation of the Renewable Energy Ratio depending on different technology and weighting options as well as balance aims (data for P1 are given in Table 4).
If asymmetric weighting factors are used, the ”RER” is below 100%. Reason for this is that the annual primary energy balance is achieved only theoretically. Due to the asymmetric weighting and the higher conversion factor for electricity generation less (primary) energy has to be generated than actually necessary. The final energy balance is negative (even in the all-electric options less electricity is generated than consumed). The CHP options have the lowest ”RER” values, as the gas supply can be met by less high electricity generation respectively weighted exports (see above). Compared with other technology options the effect is pushed by the imputation of the CHP-electricity in the primary energy balance and the lower solar power generation.
Quasi-dynamic factors usually have larger Renewable Energy Ratios. The phenomena for the fossil-heated buildings are strengthened (see Table 3). However, the options with biomass CHP reach ratios below 100%. This is due to the very low requirement for solar electricity generation and the minimized electricity exports.
Solar thermal collectors reduce the overall end energy demand of a building and thus the weighted supply of all energy carriers respectively the necessary electricity exports. The greatest impacts are visible for those technology/energy carrier options with high primary energy conversion factors. The RER is closer to the mark of 100% when solar thermal systems are used.
It is shown that for Net Zero Energy Buildings no further measures are necessary to reach high fractions of renewable energy. Solely for the primary energy balances based on (future) asymmetric weighting factors additional generation is required for a full renewable coverage of the energy demand. The two calculated plus energy balances for this asymmetric weighting option indicate that for the example building a low plus of primary energy respectively an increase of PV-capacity by approximately 15% is required to achieve a ”RER” of more than 100%.
The work leading to this paper was funded by the German Federal Ministry for Economics and Technology as part of the scientific research supporting the ”Energy-Optimised Building Programme EnOB”. This includes the participation of the authors in joint IEA program SHC Task 40/ECBCS Annex 52 ”Towards Net Zero Energy Solar Buildings”.
Table 3. Breakdown of monthly and accumulated annual end energy and primary
energy data for calculating ”RER” for technology option ”CHP+ST” and weighting
factors P4 (only used energy flows are shown). The according RER is 131%.
Jan | Feb | Mar | Apr | May | Jun | Jul | Aug | Sep | Oct | Nov | Dec | annual sum | ||||
Electricity
demand | auxiliary energy | 0.2 | 0.1 | 0.1 | 0.1 | 0.1 | 0.1 | 0.1 | 0.1 | 0.1 | 0.0 | 0.1 | 0.2 | 1.3 | ||
ventilation | 1.0 | 0.9 | 1.0 | 1.0 | 1.0 | 1.0 | 1.0 | 1.0 | 1.0 | 1.0 | 1.0 | 1.0 | 11.9 | |||
lighting | 0.8 | 0.7 | 0.7 | 0.6 | 0.6 | 0.6 | 0.6 | 0.7 | 0.7 | 0.7 | 0.8 | 0.9 | 8.4 | |||
appliances | 0.6 | 0.6 | 0.6 | 0.6 | 0.6 | 0.6 | 0.6 | 0.6 | 0.6 | 0.6 | 0.6 | 0.6 | 7.0 | |||
complete
electricity | 2.6 | 2.3 | 2.4 | 2.3 | 2.3 | 2.2 | 2.3 | 2.3 | 2.3 | 2.4 | 2.4 | 2.6 | 28.6 | |||
Fuel demand | natural gas | 9.3 | 5.8 | 3.0 | 1.3 | 0.5 | 0.5 | 0.3 | 0.3 | 1.1 | 2.0 | 5.7 | 9.5 | 39.5 | ||
Produced ren.
energy | PV electricity | Eren,el | 1.6 | 3.0 | 3.9 | 5.6 | 6.4 | 6.2 | 6.4 | 5.8 | 4.7 | 3.5 | 1.9 | 1.2 | 50.1 | |
Solar thermal | Eren,heat | 0.3 | 0.5 | 1.1 | 1.6 | 1.6 | 1.4 | 1.6 | 1.6 | 1.3 | 1.0 | 0.4 | 0.1 | 12.5 | ||
Produced non
ren. energy | CHP electricity | Enren,el | 3.3 | 2.1 | 1.1 | 0.5 | 0.2 | 0.2 | 0.1 | 0.1 | 0.4 | 0.7 | 2.1 | 3.4 | 14.1 | |
Exported
electricity | End energy | Eexp,el | 2.3 | 2.8 | 2.5 | 3.8 | 4.3 | 4.1 | 4.2 | 3.6 | 2.8 | 1.9 | 1.5 | 1.9 | 35.6 | |
Weighting
factors | fexp,tot,el | 1.63 | 1.63 | 1.63 | 1.63 | 1.63 | 1.63 | 1.63 | 1.63 | 1.63 | 1.63 | 1.63 | 1.63 | | ||
fexp,nren,el | 1.30 | 1.29 | 1.25 | 1.22 | 1.15 | 1.17 | 1.20 | 1.19 | 1.22 | 1.27 | 1.30 | 1.21 | | |||
fexp,ren,el | 0.33 | 0.34 | 0.38 | 0.41 | 0.48 | 0.46 | 0.43 | 0.44 | 0.41 | 0.36 | 0.33 | 0.42 | | |||
Primary energy | Pexp,tot,el | 3.8 | 4.5 | 4.1 | 6.2 | 6.9 | 6.7 | 6.8 | 5.8 | 4.5 | 3.1 | 2.4 | 3.1 | 58.1 | ||
Pexp,ren,el | 0.8 | 0.9 | 1.0 | 1.6 | 2.0 | 1.9 | 1.8 | 1.6 | 1.1 | 0.7 | 0.5 | 0.8 | 14.7 | |||
Delivered
electricity | End energy | Edel,el | 0.0 | 0.0 | 0.0 | 0.0 | 0.0 | 0.0 | 0.0 | 0.0 | 0.0 | 0.0 | 0.0 | 0.0 | 0.0 | |
Weighting
factors | fdel,tot,el | 1.63 | 1.63 | 1.63 | 1.63 | 1.63 | 1.63 | 1.63 | 1.63 | 1.63 | 1.63 | 1.63 | 1.63 | | ||
fdel,nren,el | 1.30 | 1.29 | 1.25 | 1.22 | 1.15 | 1.17 | 1.20 | 1.19 | 1.22 | 1.27 | 1.30 | 1.21 | | |||
fdel,ren,el | 0.33 | 0.34 | 0.38 | 0.41 | 0.48 | 0.46 | 0.43 | 0.44 | 0.41 | 0.36 | 0.33 | 0.42 | | |||
Primary energy | Pdel,tot,el | 0.0 | 0.0 | 0.0 | 0.0 | 0.0 | 0.0 | 0.0 | 0.0 | 0.0 | 0.0 | 0.0 | 0.0 | 0.0 | ||
Pdel,ren,el | 0.0 | 0.0 | 0.0 | 0.0 | 0.0 | 0.0 | 0.0 | 0.0 | 0.0 | 0.0 | 0.0 | 0.0 | 0.0 | |||
Delivered fossil
fuels | End energy | Edel,ff | 9.3 | 5.8 | 3.0 | 1.3 | 0.5 | 0.5 | 0.3 | 0.3 | 1.1 | 2.0 | 5.7 | 9.5 | 39.5 | |
Weighting
factors | fdel,tot,ff | 1.10 | 1.10 | 1.10 | 1.10 | 1.10 | 1.10 | 1.10 | 1.10 | 1.10 | 1.10 | 1.10 | 1.10 | | ||
fdel,nren,ff | 1.10 | 1.10 | 1.10 | 1.10 | 1.10 | 1.10 | 1.10 | 1.10 | 1.10 | 1.10 | 1.10 | 1.10 | | |||
fdel,ren,ff | 0.00 | 0.00 | 0.00 | 0.00 | 0.00 | 0.00 | 0.00 | 0.00 | 0.00 | 0.00 | 0.00 | 0.00 | | |||
Primary energy | Pdel,tot,ff | 10.2 | 6.4 | 3.3 | 1.5 | 0.5 | 0.6 | 0.4 | 0.4 | 1.2 | 2.2 | 6.3 | 10.4 | 43.4 | ||
Pdel,ren,ff | 0.0 | 0.0 | 0.0 | 0.0 | 0.0 | 0.0 | 0.0 | 0.0 | 0.0 | 0.0 | 0.0 | 0.0 | 0.0 | |||
Table 4. Overview of accumulated annual values for different technology options and factor set P1 (all data except RER in kWh/m²y).
Technology option | HP | Gas | Bio | CHP | CHP ren | DH | HP + ST | Gas + ST | Bio + ST | CHP + ST | CHP ren + ST | DH + ST | HP | Bio + ST | HP | Bio + ST | |
Primary energy
balance | 0.0 | 0.0 | 0.0 | 0.0 | 0.0 | 0.0 | 0.0 | 0.0 | 0.0 | 0.0 | 0.0 | 0.0 | −18.7 | −18.0 | 14.7 | 12.0 | |
End energy
demand | Complete
electricity | 40.0 | 28.4 | 28.4 | 27.9 | 27.9 | 28.3 | 36.3 | 28.9 | 28.9 | 28.6 | 28.6 | 28.7 | 40.0 | 28.4 | 40.0 | 28.4 |
District heat | 32.6 | 20.1 | |||||||||||||||
Biomass | 48.9 | 64.0 | 30.2 | 39.5 | 48.9 | 48.9 | |||||||||||
Natural gas | 33.7 | 64.0 | 20.8 | 39.5 | |||||||||||||
Produced ren.
energy | PV electricity (Eren,el) | 40.0 | 42.6 | 32.1 | 32.1 | 10.0 | 37.1 | 36.3 | 37.7 | 31.3 | 31.2 | 17.5 | 34.2 | 33.0 | 24.3 | 45.6 | 35.9 |
CHP electricity
(Eren,el) | 22.8 | 14.1 | |||||||||||||||
Geothermal heat
(Eren,heat) | 22.7 | 13.7 | 22.7 | 22.7 | |||||||||||||
Solar thermal (Eren,heat) | 12.5 | 12.5 | 12.5 | 12.5 | 12.5 | 12.5 | 12.5 | 12.5 | |||||||||
Produced non
ren. energy | CHP electricity
(Enren,el) | 22.8 | 14.1 | ||||||||||||||
Exported
electricity | Eexp,el | 10.7 | 18.2 | 9.2 | 27.1 | 5.2 | 13.2 | 10.8 | 13.3 | 8.0 | 16.7 | 3.9 | 10.3 | 5.9 | 3.6 | 15.1 | 12.3 |
Pexp,tot,el | 32.2 | 54.5 | 27.5 | 81.2 | 15.5 | 39.5 | 32.4 | 39.9 | 24.1 | 50.1 | 11.7 | 30.8 | 17.6 | 10.8 | 45.3 | 36.8 | |
Pexp,ren,el | 4.3 | 7.3 | 3.7 | 10.8 | 2.1 | 5.3 | 4.3 | 5.3 | 3.2 | 6.7 | 1.6 | 4.1 | 2.3 | 1.4 | 6.0 | 4.9 | |
Delivered
electricity | Edel,el | 10.7 | 3.9 | 5.4 | 0.0 | 0.2 | 4.4 | 10.8 | 4.5 | 5.7 | 0.0 | 0.9 | 4.8 | 12.8 | 7.6 | 9.5 | 4.8 |
Pdel,tot,el | 32.1 | 11.8 | 16.2 | 0.0 | 0.7 | 13.2 | 32.4 | 13.6 | 17.1 | 0.0 | 2.6 | 14.5 | 38.4 | 22.9 | 28.4 | 14.3 | |
Pdel,ren,el | 4.3 | 1.6 | 2.2 | 0.0 | 0.1 | 1.8 | 4.3 | 1.8 | 2.3 | 0.0 | 0.4 | 1.9 | 5.1 | 3.1 | 3.8 | 1.9 | |
Delivered
district heat | Edel,heat | 32.6 | 20.1 | ||||||||||||||
Pdel,tot,heat | 22.8 | 14.1 | |||||||||||||||
Pdel,ren,heat | 0.0 | 0.0 | |||||||||||||||
Delivered
biomass / bio fuels | Edel,bio | 48.9 | 64.0 | 30.2 | 39.5 | 48.9 | 48.9 | ||||||||||
Pdel,tot,bio | 58.7 | 76.8 | 36.3 | 47.4 | 58.7 | 58.7 | |||||||||||
Pdel,ren,bio | 48.9 | 64.0 | 30.2 | 39.5 | 48.9 | 48.9 | |||||||||||
Delivered fossil
fuels | Edel,ff | 33.7 | 64.0 | 20.8 | 39.5 | ||||||||||||
Pdel,tot,ff | 37.0 | 70.4 | 22.9 | 43.4 | |||||||||||||
Pdel,ren,ff | 0.0 | 0.0 | 0.0 | 0.0 | |||||||||||||
RER [%] | 107 | 120 | 105 | 151 | 102 | 116 | 107 | 111 | 104 | 118 | 102 | 109 | 79 | 82 | 140 | 117 | |
[DIN EN 15603
2008] Energieeffizienz von Gebäuden – Gesamtenergieverbrauch und Festlegung der
Energiebedarfskennwerte; German version EN 15603:2008, date of issue
09.05.2008.
[DIN 18599
2009] Energetische Bewertung von Gebäuden – Berechnung des Nutz-, End- und
Primärenergiebedarfs für Heizung, Kühlung, Lüftung, Trinkwarmwasser und
Beleuchtung – Teil 100: changes of DIN V 18599-1 bis DIN V 18599-10, date
of issue 10.2009.
[DIN 18599
2011] Energetische Bewertung von Gebäuden – Berechnung des Nutz-, End- und
Primärenergiebedarfs für Heizung, Kühlung, Lüftung, Trinkwarmwasser und
Beleuchtung – DIN V 18599:2011-12, date of issue 05.10.2011.
[EEWärmeG 2012]
Bundesministerium für Umwelt, Naturschutz und Reaktorsicherheit (BMU): Gesetz
zur Förderung Erneuerbarer Energien im Wärmebereich
(Erneuerbare-Energien-Wärmegesetz), 2012.
[Großklos 2013] Großklos, Marc; Frank, Milena (2013): Monatlicher Verlauf des kumulierten Energieverbrauchs und der Treibhausgas-Emissionen im deutschen Strommix. In: Energiewirtschaftliche Tagesfragen 63 (9), page 32–35.
[GEMIS 2013] Internationales Institut für
Nachhaltigkeitsanalysen und -strategien GmbH (IINAS) (2013): Globales
Emissions-Modell Integrierter Systeme. GEMIS. Darmstadt. Online available under http://www.iinas.org/gemis-download-de.html,
last reviewed 04.11.2013.
[Kurnitski 2013] Kurnitski, Jarek (2013): Technical definition for nearly zero energy buildings. In: REHVA Journal (May), page 22–28.
[Minergie 2010] MINERGIE® (Editor) (2010):
MINERGIE-A®. Definition des
neuen Gebäude-Standards – Vernehmlassung. Bern.
[RED 2009] European Parliament and the
Council of the EU (04.06.2009): Directive 2009/28/EC of the European Parliament
and of the Council of 23 April 2009 on the promotion of the use of energy from
renewable sources (RED).
[Voss Musall 2013] Voss, Karsten; Musall, Eike (Editors) (2013): Net Zero Energy Buildings. International Projects of Carbon Neutrality in Buildings. 2nd edition. Berlin: Walter De Gruyter Inc (Detail green books).
[Voss 2011] Voss, Karsten; Musall, Eike; Lichtmeß, Markus (2011): From Low Energy to Net Zero-Energy Buildings: Status and Perspectives. In: Journal of Green Building 6 (1), page 46–57.
Follow us on social media accounts to stay up to date with REHVA actualities
0