


Stay Informed
Follow us on social media accounts to stay up to date with REHVA actualities
|
|
|
Björn BerggrenLic.Tech, Skanska Sweden AB. bjorn.berggren@skanska.se | Per KempePhD,
Projektengagemang AB and Skanska Installation AB, Sweden | Åse
TogeröPhD,
Skanska Sweden AB |
Keywords: Net Zero Energy Building, Low Energy Buildings, Deep Green Buildings, Load Matching, Photo Voltaic, PV, Office Building. |
Net Zero Energy Buildings, Net ZEBs, is one of many necessary measures for climate change mitigation as they may reduce the energy consumption in the building sector. The number of low-energy buildings has increased significantly over the past years in Sweden (Wahlström, Jagemar, Filipsson, & Heincke, 2011) and Europe. However, renewable energy such as PV-panels has until recently constituted a substantial initial cost for building projects, a fact that can explain that up to this date only one Net ZEB office has been constructed in Sweden, i.e. Väla Gård. Hence there is a need for sharing the experiences gained so far.
As a part of Skanska’s commitment to reduce the environmental impact of the built environment, Skanska has defined and embarked on its Journey to Deep Green™. Skanska has developed an internal tool for environmental performance, the Color Palette. It is the strategic framework and communication tool for Skanska’s green business development, that has been developed to measure and guide the company’s performance on this journey towards Deep Green. Deep Green is defined by 6 zeros that relate to the priority opportunities for reduction of the environmental impact of our projects. These zeros are:
· Net Zero Primary Energy
· Near Zero Carbon in construction
· Zero waste to landfill
· Zero hazardous materials
· Zero unsustainable materials
· Net zero water for buildings
A Deep Green project must achieve three of the following six objectives: net zero primary energy, zero waste, zero unsustainable materials, zero hazardous materials, near zero embodied carbon and net zero water. Väla Gård achieved zero energy, zero waste and zero hazardous materials. The project also achieved LEED Platinum, the highest LEED score in Europe and the third highest in the world to date. LEED is a U.S. Green Building Council (USGBC) certification system for sustainable and energy efficient buildings. Väla Gård is the Skanska Group’s greenest office project to date and is the first to achieve the Deep Green level according to Skanska’s Color Palette™.
To create and construct a well functioning Net ZEB that is connected with an existing grid, it is important to consider the interaction with the grid. Hence, Net ZEBs have the dual role of being producers and consumers of energy, at all times.
The design may be evaluated by using
quantitative indicators to describe load matching (LM) and grid interaction
(GI). Load match refers to how the local energy supply compares with the
building load and grid interaction refers to the energy exchange between the
building and the grid. Further
description and discussion may bee found in (Voss et al., 2010), (Salom et al.,
2011), (Sartori et al., 2012), (Berggren et al., 2012) and (Salom et al., 2014).
Within this article electricity use is divided into two categories, according to definitions in the Swedish building regulations:
· Property energy
Energy for heating, cooling, hot water and electricity for building services
necessary for the use of the building (permanently installed lighting of common
spaces, pumps, fans, etc.)
· Operational energy
Energy for computers, copiers, TVs, refrigerators/freezers, lighting, etc.
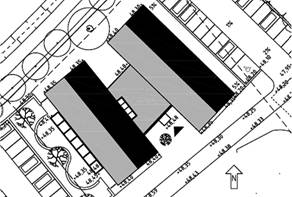
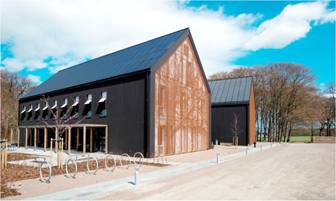
Väla Gård is a two-story office building in the outskirts of Helsingborg, Sweden. The project started in 2011, when Skanska Sweden started to plan and design an office building. The development consists of two three-level main buildings with double pitched roofs, connected by a smaller building with a flat roof, see Figure 1.
|
|
Figure 1. Left: Orientation of building. Right: Photo taken from the south. The overall design concept for energy efficiency follows the passive house design principle with a highly insulated and airtight building envelope and a balanced ventilation system with high heat recovery. Heat is produced by a geothermal heat pump and free-cooling is extracted from the bore holes during summer. Roof sides facing south west are equipped with PV panels. A summary of the building constructions is presented in Table 1. | |
Table 1. Summary of building elements for Väla Gård.
Building
element | Summary
of construction | U-value
(W/m²K) |
Slab on ground | Concrete slab; 350 mm EPS | 0.08 |
Exterior walls | Concrete walls; 200 mm Graphite EPS + 95 mm mineral wool | 0.11 |
Double pitched roof | Glulam beam constructions; 520 mm mineral wool | 0.08 |
Flat roof | Corrugated steel plate; 350 mm EPS + 20 mm mineral wool | 0.10 |
Windows | Triple glazed lowE windows with argon filling | 0.90 |
Glazed entrance | Triple glazed lowE windows with argon filling | 1.00 |
Skanska had a good opportunity to construct something really green as we had control of the whole building process being the developer, contractor, HVAC contractor and end-user, and having the specialists needed in-house. The architect was not from Skanska but won the job in competition, where the green ideas were important measures. The project could easily set, understand, share and agree upon the tough environmental and energy related goals, and this was used as a guiding light from the early phases until the user phase. The energy specialists had for instance the possibility to take part of the process early, make early calculations and give advice on the architectural design and other early choices. This has had a substantial effect on the energy performance. For example, the architect chose to design solar shading made of perforated Corten steel as a result of a dialogue about reducing the need for cooling. Concrete frame was chosen for increased air tightness and moisture control during construction.
Except for the net zero energy performance, Väla Gård is LEED-certified in Platinum with one of the world’s highest score of 105 points. The extra investment for the technology, specialist support and work during production is about 3.4 million SEK or 2 050 SEK/m² (230 Euro/m²) compared to a house that is designed and built to just fulfil the national code. The estimated annual energy cost savings is 150 000 SEK or 17 000 Euro.
A detailed description and discussions about the building and its HVAC systems can be found in (Kempe 2013).
Heating and domestic hot water is produced by a ground source heat pump system with four variable speed heat pumps. The heat pumps are sized to produce more than the estimated peak load for the fully developed area with a total of four buildings, whereof Väla Gård office building is the first one.
The ventilation systems consist of air handling unit with a DCV (Demand Controlled Ventilation) system per building body, which is controlled by the presence, temperature and CO2 in the conference rooms. The ventilation operation times are Mon- Fri 6–18. An example on the DCV air flow variations: 10 l/s with no one present, 25–50 l/s at presence, controlled by temperature and CO2. The DCV system is controlled by the "Super Wise" and communicates with the air handling unit control, to optimize the duct pressure in the supply and extract air ducts and thus become more energy efficient. SFP for the AHU’s has been very low during the winter, around 0.7 kW/(m³/s).
By separating the set points for heating and cooling with 2°C, the risk of simultaneous heating and cooling in the office is reduced.
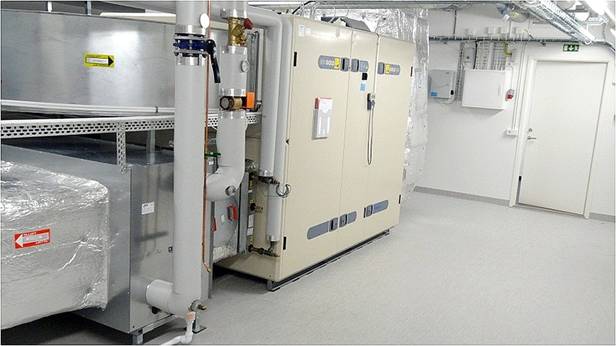
Figure 2.The AHU in southern building body, LA1, with supply air duct in the bottom left of the picture with heating coil closest to the ventilation unit and then cooling coil. LA2 in the northern building body is similar.
Heating systems
Each of the two main building bodies has its own radiator system with a radiator shunt group in the AHU room. The radiator valves in the rooms are electrically controlled from the master air supply devices, which is part of the Super Wise system that controls the DCV-system.
If there is a cooling demand in a room the air flow increases with cooled air in the room. If the supply air temperature is too high the cooling coil lowers the supply air temperature using free cooling from the bore holes in the ground source heat systems.
The lighting system consists of energy efficient light fixtures, which can be dimmed and controlled by presence and daylight. To minimize tenant electricity (reducing standby losses), the main part of the electrical outlets, plug loads, are turned off when the alarm is switched on. Furthermore, all appliances are at least A-rated. Refrigerator and Freezer is A++.
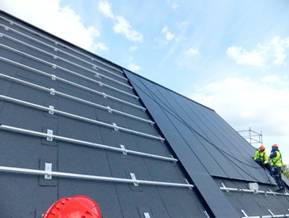
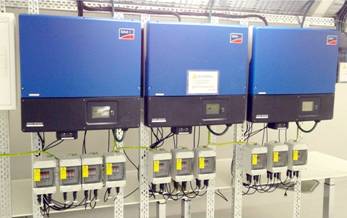
Väla Gård photovoltaic plant has received The Swedish Solar Prize 2013 and Skåne Solar Award 2013. Figure 3 shows two images: photovoltaic panel assembly in May 2012 and inverters in the AHU room.
|
|
Figure 3. Installation of photovoltaic modules on Building B (North Building) and inverters in the AHU room. | |
Overall, it is mounted 288 solar modules of type Naps Saana 245 W with 5 inverters from SMA. Peak power for PV systems is 70 kWp and the calculated yearly power generation of 64,000 kWh.
As mentioned in (Sartori et al., 2012) it is important to define and describe a Net ZEB in a transparent way, making it comparable with others. In Table 2, a summary of the Swedish definition of Net ZEB is presented (SCNH, 2012), following the framework presented in (Sartori et al., 2012).
Table 2. Summary of Swedish Net ZEB definition
Criteria | Swedish
definition |
Physical boundary | In accordance to the Swedish building regulations. Hence, in general, the physical boundary is the building itself. |
Balance boundary | Energy used for heating, cooling and dehumidification, ventilation and humidification, hot water and permanently installed lighting of common spaces and utility rooms are included in the balance. Other services are not included in the balance (e.g. computers, copiers, TVs etc.). |
Boundary conditions | Set point for heating (+21°C) and internal heat gains is defined. |
Weighting system | Weighted energy is used, with static and symmetric weighting factors. |
Balancing period | 1 year. |
Type of balance | Balance is calculated based on import/export. |
Energy efficiency | Fulfilment of Swedish Passive house criterion. |
Measurement and verification | To enable verification of the energy performance, energy metering must be separated into heat and electricity. |
The definition of Net ZEB in Skanskas Color
Palette in general follows the Swedish definition. The main differences are the
requirement for energy efficiency and LMGI. The requirement for energy
efficiency is that the energy demand must be 25% lower compared to Swedish
building regulations.
The LMGI-requirement is that LM should be calculated and presented. No specific level for LM is defined. Relevant terms, used in LMGI analysis are presented in Figure 4.
In all analyzes in this article, no weighting factors are applied. Hence, the building is an all electric building.
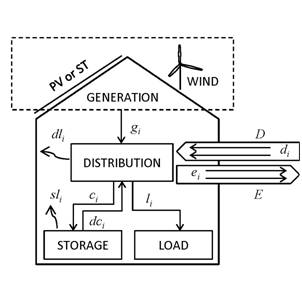
Figure 4. Schematic presentation of energy flows addressed in this article.
The temporal match between load and generation, LM, is investigated using the load match index, which describes the ratio of on-site power generation and load. The definition is described in Equation 1. When energy is fed into the grid, the load match index is 100%. Regarding the load match index, a high index is preferable if a high on-site coverage of the energy demand is desired.
To assess the interaction between the building and the electricity grid, the grid interaction, GI, is investigated. The grid interaction is based on the ratio between the net metering (e.g. exported - delivered energy) compared to the maximum exported - delivered energy over a given time period, as shown in Equation 2. The load match index and grid interaction may be calculated for different time intervals, e.g. hourly, daily, weekly, monthly and by year.
The average stress on the grid is investigated by calculating the grid interaction index. This is defined as the standard deviation of the grid interaction over the year, as shown in Equation 3. In this article the grid interaction index is not used as data does not cover a full year.
![]() Equation 1
Equation 1
![]() Equation 2
Equation 2
![]() Equation
3
Equation
3
The Väla
Gård control computer collects data to its OPC-server each minute from the
installations systems and their meters, sensors etc. The data is sent to an
external database in case the values have changed. This has several advantages;
it saves memory, transmission capacity, but also creates a freedom in the
evaluation, i.e. data time steps for analysis (1 minute, 5 minutes or
hourly values).
Currently,
the detailed logging consists of 300 signals. There are increased indoor
climate measurements in 17 rooms, 4 rooms per floor and the building body and
the foyer, whereof 5 conference rooms. These increased measurements are room
temperature, supply air temperature, CO2,
RH, supply air flow, presence, lighting control as well as control signal to
radiators. There are also 19 signals per air handling unit, air flow, duct
pressure, temperatures, and control signals to the fans, valves and heat
exchangers, and 18 energy meters (electricity and heat), 18 air flows in the
DCV systems, etc. and a lot of signals from the ground source heat pump system.
The measuring system was taken into use in spring 2013. From mid-February the building energies, was measured. The electricity meters for the PV-panels were taken into use April 26th and the tenant electricity meter was taken into use May 1st.
To get a prognosis of the annual energy profile, calculations were carried out for the six weeks between March 17th and the end of April, see Figure 5. PV-calculations have been carried out with PV Sol Expert and corrected hourly for actual solar radiation. An average operational energy profile measured in May was also used to fill the gap March 17th – April 30th.
In Figure 5, the measured energy profile is displayed The PV-panels give almost no
energy in the end of January 2014, due to the almost complete lack of sunshine.
Figure 5. PV, operational and building energy [kWh/h]. Measured data for building energy: 17 March 2013 – 16 March 2014. Measured data for PV and operational energy: 1 May 2013 – 16 March 2014. Simulated data for PV and operational energy to fill-in the gap: 17 March to 1 May 2013.
Table 3. Prognosis of annual power generation and energy use. Measured data for building energy: 17 March 2013 – 16 March 2014. Measured data for PV and operational energy: 1 May 2013 – 16 March 2014. Fill-in simulated data for PV and operational energy: 17 March to 1 May 2013.
PV | Building | Tenant | |
kWh | 66678 | 29222 | 44447 |
kWh/Atemp | 38,10 | 16,70 | 25,40 |
In Figure 6, results from simulations are presented together with results from measurements. The wider columns represent the measured data and the narrow bars the results from simulation. The results from the measurements have not been normalized for disparities between outdoor climate and user profile, set in the simulation.
As can be seen, the total energy use (solar energy used directly + imported energy) are in general lower than simulated. Less solar energy is used on site compared to simulated and more energy is exported than expected. The performance of the PV panels is close to expected. The simulated electricity generation during the period is 35 323 kWh, which may be compared to measured electricity generation: 35 546 kWh. Hence, the main reason for the lower solar energy used on site and higher exported solar energy is most likely due to that the energy use is lower than expected.
Figure 6. Results from simulation and measurement.
In Figure 7, the load match is analyzed, both on hourly basis and on weekly basis. Load match is presented both including and excluding operational energy.
The analysis clearly shows the complexity of the interaction between the load and generation. There are, except for a short period in January, periods every day where the load match is 100% and 0%. Analyzing the load match on a weekly basis, shows that the generation from the PV panels may cover the load from the building throughout the summer until somewhere in October/November, depending on whether operational energy is included or not. The differences between the load match, whether operational energy is included or not, are rather small.
Figure 7. The load match i.e. the percentage of on-site power generation compared to energy load [%] for measured data (1 May 2013 – 16 March 2014).
In Figure 8, representative/characteristic weeks for summer and winter are shown. The generated electricity from PV panels and energy use during the same period is presented in Table 4. The load match for the corresponding period is presented in Figure 9.
As can be seen, during summer the building would easily be able to cover its own load by electricity from PV panels if a one-day energy storage would be used/implemented. During winter there is a need to import electricity. However, even during winter electricity is exported.

Figure 8. Representative weeks for winter profile (20140210-20140217) and summer profile (20130819-20130826) for PV, operational and building energy [kWh/h]
Table 4. Representative weeks for winter (20140210-20140217) and summer (20130819-20130826) showing energy generation, energy loads and energy balance [kWh].
Period | Generated electricity,
PV panels (kWh) | All energy excluding
operational energy (kWh) | Operational energy (kWh) | Balance (kWh) |
Feb 10 – Feb 17 | 644 | 752 | 895 | −1 003 |
Aug 19 – Aug 26 | 2 277 | 318 | 907 | 1 052 |
Analysing the load match, the load match is during noon 100% both during a representative winter day and summer day. However, the period of 100% load match is shorter during winter.
Figure 9. The load match of two representative weeks, in winter (20140210-20140217) and summer (20130819-20130826) i.e. the ratio of on-site power generation and energy load, where full ratio means full coverage of energy load with generated energy.
Analysing the grid interaction, as shown in Figure 10, the complexity of the interaction between import and export is shown. Electricity is imported and exported several times a day. Analysing the grid interaction on a weekly basis shows that the stress to the grid could be lower and more predictable if a one-week energy storage could be used/implemented.
Figure 10. Grid interaction on an hourly and weekly basis.
The prognosed energy performance indicate a very good match between simulated and measured data and that Väla Gård performs well, resulting in a net ZEB performance including operational energy.
From an economic point of view, the investment is paid back within the guaranteed life span of the PV-panels, even with a rate of return for the investment of 7% (net rate). With very varying prices on electricity and changing conditions for exporting and selling electricity it is not possible to give a precise prediction of the net value-based break-even of the investment. However, it can be noted that with a net-metering system in Sweden, Väla Gård would have been an even better investment.
The Väla Gård project received financial support from LÅGAN – Sweden’s program for buildings with very low energy use, for evaluating the energy system and indoor environment for the first few years of operation.
Salom J., Marszal A., Candanedo J., Widén J., Byskov Lindberg K., Sartori I,2014. Analysis Of Load Match and Grid Interaction Indicators in NZEB with High-Resolution Data. Technical report of IEA Task 40/Annex 52 Towards Net Zero Energy Solar Buildings.
Salom J., Widen J., Candanedo J.A., Sartori I., Voss K., Marszal A. 2011. Understanding Net Zero Energy Buildings: evaluation of load matching and grid interaction indicators. Proceedings of Building Simulation 2011, Sydney, Australia.
Sartori I., Napolitano A., Voss K. 2012. Net zero energy buildings: A consistent definition framework. Energy and Buildings 48: 220-232.
SCNH, Sveriges Centrum för Nollenergihus. (2012). Kravspecifikation för nollenergihus, passivhus och minienergihus (In Swedish). Retrieved March 19th, 2014, from www.nollhus.se.
Voss K., Sartori I., Musall E., Napolitano A., Geier S., Hall M., Karlsson B., Heiselberg P., Widen J., Candanedo J.A., Torcellini P. 2010. Load matching and grid interaction of net zero energy buildings. Proceedings of Eurosun 2010, Graz, Austria.
Wahlström Å., Jagemar L., Filipsson P., & Heincke C. (2011) “Marknadsöversikt av uppförda lågenergibyggnader” Technical report from LÅGAN, Göteborg, Sweden.
Kempe P. (2013),
Passivhus Norden 2013, Uppföljning Väla Gård – plusenergikontor,
http://www.laganbygg.se/UserFiles/Presentations/61._Session_16_P.Kempe.pdf.
Follow us on social media accounts to stay up to date with REHVA actualities
0