


Stay Informed
Follow us on social media accounts to stay up to date with REHVA actualities
|
|
|
Francisco Javier Aguilar ValeroDpto. de Ingeniería Mecánica
y EnergíaUniversidad Miguel HernándezAvda. de la Universidad,
Edificio Innova03202 Elche, Spainfaguilar@umh.es | Aledo SimónAtecyr. ProinterS.L., C/ Nicolás de Bussí30, 03320, Elche, Spainsimon@prointer.es | Quiles Pedro VicenteDpto. de Ingeniería Mecánica
y EnergíaUniversidad Miguel HernándezAvda. de la Universidad,
Edificio Innova03202 Elche, Spainpedro.vicente@umh.es |
The present paper describes a project
carried out to retrofit the HVAC facilities and to install renewable energy
facilities in a university building located in Orihuela (Alicante) Spain.
The building in question is fourty-five years
old and experiences grave malfunction within its equipment. Thus, the
university proposes replacing the building’s facilities, with the additional
aim of improving efficiency. The concept is:
·
To replace the HVAC facilities
as the current ones are defective or do not work properly.
·
The university is ready to
assume additional costs in order to make the building energy efficient.
·
The building envelope is not
considered for reformation: windows and insulation will remain unchanged.
Spanish legislation does not yet define
"Nearly Zero Energy Buildings". However, regulations involving Energy
Performance Certificates are well established and used regularly. It is
required that new public buildings attain, at the very least, an Energy Rating
Letter ‘B’, but nothing is said concerning refurbishment of existing buildings.
This being said, there are very promising
financial support schemes in place that encourage rehabilitation projects that
entail an enhanced energy performance level.
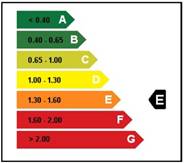
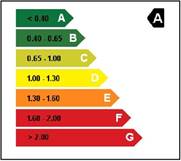
If the energy performance ratings reach
levels ‘A’ or ‘B’, the financial incentives are even greater. Therefore, an
approach to obtain an energy performance rating ‘A’ is proposed, considering
that this will be similar to having a Nearly Zero Energy Building.
The building is located on the outskirts of
agricultural fields, 4 km away from the nearest town (Orihuela with 90 000
inhabitants). It is very close to the river Segura and is thus a very humid
area. It is located about 20 km from the sea and at only 20 m above
sea level.
Climatic data of the capital (Alicante),
situated 40 km away are available. However, experience corroborated by
measurements, confirms that in summer the temperature on campus is 3–4°C higher
than in the capital yet in winter it is 3–4°C lower.
The Orihuela campus (Figure 1) is home to the School of Agricultural Engineers with
its own cultivation land that generates a significant amount of biomass.
Furthermore, it has a pelletizer, thus making biomass an attractive solution.
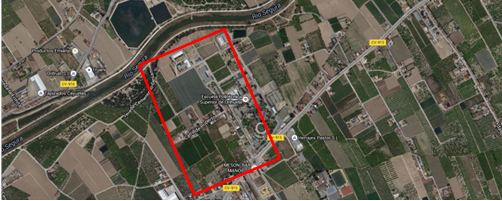
Figure 1. Site Location.
The building in question (Figure 2) is completely detached,
but the south facing façade receives shade from a nearby building. Also, the
windows have overhangs that perform as awnings very effectively in summer.
The constructed surface area is 5 800 m²,
4 640 m² being air-conditioned. The building is used 8:00–22:00,
Monday through Friday and 8:00–15:00 on Saturdays. It closes in August, making
up a total of 3 696 hours per year ‘of use’.
The windows are old and single glazed with
6mm glass and an aluminium frame without thermal breaks.
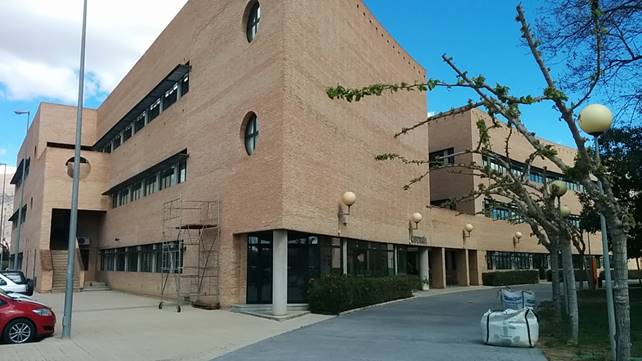
Figure 2. Photo of Building.
The facilities are found mostly on the roof
of the building: there are two reversible heat pump units and a cooling unit.
All of them are included in Figure 3.
Table I shows the energy performance simulation of the building before
retrofit, where Final Energy Consumption, Non-Renewable Primary Energy
Consumption and CO2 Emissions are included. The non-Renewable Primary
Energy conversion factor for delivered electricity in Spain is 1.954 kWhnRPE/ kWhE.

Figure 3. View from Top. HVAC
Installations.
Table I. Energy Performance
Certificate before retrofit.
| Concept | Studied
Building | Reference
Building |
Final Energy ( kWh/year) | 1 511 983.0 | 1 547 290.0 | |
Final Energy ( kWh/ m²year) | 275.8 | 282.3 | |
Primary Energy ( kWh/year) | 3 935 691.8 | 2 634 266.3 | |
Primary Energy ( kWh/ m²year) | 718.0 | 480.6 | |
Emissions (kg CO2/year) | 981 276.9 | 672 794.8 | |
Emissions (kg CO2/ m²year) | 179.0 | 122.7 |
Figure 4 shows the results from the simulation about the monthly final
energy consumption before retrofit.
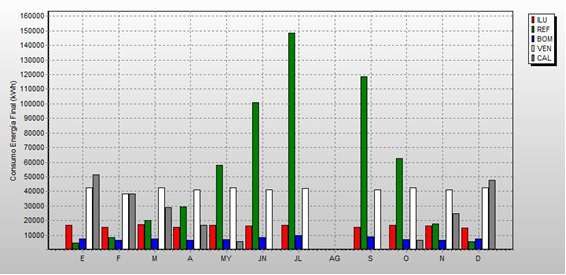
Figure 4. Monthly Final Energy
Consumption by Each System before retrofit.
Currently the units are fitted with fixed
speed reciprocating compressors and the water flow both in the primary circuit
and the distribution system are constant. The building works on a cooling or
heating only basis. The lecture rooms, hallways and canteen are conditioned
with the building’s fourteen AHUs (twelve on the roof and two indoor). The
building also has thirty-four offices and one fan-coil unit per office.
Tables
II and III
show the simulation results after retrofit.
Table II. Monthly final energy
consumption by each system after retrofit.
Jan | Feb | Mar | Apr | May | Jun | Jul | Aug | Sep | Oct | Nov | Dec | Total | |
Lighting | 5 945.8 | 5 437.9 | 5 997.20 | 5 437.9 | 5 971.5 | 5 730.4 | 5 971.5 | 0.0 | 5 463.6 | 5 971.5 | 5 704.7 | 5 171.2 | 62 803.1 |
Cooling | 256.8 | 199.1 | 969.50 | 2 013.4 | 3 389.8 | 4 186.8 | 8 083.3 | 0.0 | 6 062.8 | 4 459.8 | 883.7 | 383.4 | 30 888.5 |
Pumps | 2 551.3 | 2 029.4 | 1 666.80 | 11 35.3 | 1 709.8 | 2 684.1 | 3 587.4 | 0.0 | 2 975.9 | 1 822.2 | 1 529.3 | 2 275.4 | 23 966.9 |
Fans | 23 147.5 | 18 503.9 | 17 935.50 | 19 446.0 | 20 235.7 | 18 301.3 | 19 256.2 | 39.4 | 1 9067.1 | 1 9692.9 | 18 289.1 | 24 293.8 | 218208.5 |
Heating | 157.5 | 121.4 | 76.60 | 29.8 | 1.3 | 0.0 | 0.0 | 0.0 | 1.8 | 14.7 | 84.5 | 147.3 | 635.0 |
TOTAL | 32 058.9 | 26 291.7 | 26 645.5 | 28 062.4 | 31 308.1 | 30 902.6 | 5 971.5 | 0.0 | 5 463.6 | 5 971.5 | 5 704.7 | 5 171.2 | 62 803.1 |
Table III. Energy performance
certificate after retrofit.
| Concept | Studied
Building | Reference
Building |
Final Energy ( kWh/year) | 452 677.4 | 106 439.1 | |
Final Energy ( kWh/ m²year) | 82.6 | 194.2 | |
Primary Energy ( kWh/year) | 862 678.0 | 2 075 804.1 | |
Primary Energy ( kWh/ m²year) | 157.4 | 378.7 | |
Emissions (kg CO2/year) | 186 134.1 | 525 533.8 | |
Emissions (kg CO2/ m²year) | 34.0 | 95.9 |
The heat pump’s user experience has been
unsatisfactory. The units have proved to be unreliable and their performance at
low temperatures has been poor, in part due to the area’s high humidity on cold
mornings.
Therefore, a biomass boiler is installed
with a power rating of 500 kW, thus covering for 100% of the required
heating demand and 100% of energy demand. An additional propane boiler will be
fitted as a redundant system to guarantee adequate service in case the biomass
boiler becomes defective, thus will not be taken into account in this study.
To cover for cooling demands, two Daikin
EWAD TZPS 345 cooling units are chosen. Enclosing inverter screw compressors
and with a nominal power of 339 kW, said units are highly efficient with
an EER=3.34 and an ESEER=5.46 (according to EN14511-3-2011).
The building’s renovation must conform to
current Spanish legislation that requires the installation of heat recovery
systems. Thus the existing AHUs are modified and a heat recovery system is
added to them. In addition, the control systems are improved to take advantage
of free cooling through enthalpy controllers, as well as perform night cooling
when convenient. Similarly, VFDs are incorporated to both the return and supply
fans.
Seeing as the secondary pumping system will
now be fed via a hydraulic variable displacement pump, the current three-way
valves within each AHU are replaced by two-way valves.
All analogous control systems are replaced
to ensure optimal performance within the pumping-production-distribution loop,
guaranteeing therefore that demand and production are as close as possible at
all times.
The building’s lighting makes up 14% of the
total energy demand and is henceforth an aspect of the building to be
considered. Thus a light controlled LED lighting system is proposed, to replace
all existing and out-dated systems.
As there are no domestic hot water systems
in this building, except for a small electric boiler in the canteen, the DHW
systems and its calculations are not taken into account in this study.
Table IV. Table of components
before and after.
COMPONENTS | BEFORE RETROFIT | Power | Effi or ƞ | AFTER RETROFIT | Power | Effi or ƞ | ||
Uts. | Ʃ kW | EER / COP | Uts | Ʃ kW | EN14511-3:2011 | |||
Cooling Plant | 3 | 2 Heat Pump +1
Chiller, R_22 Reciprocating Comp | 690 | 2.19 | 2 | Chillers,
R-134a, Inverter Screw | 678 | EER / ESEER 3.34
/ 5.46 |
Heating Plant | 2 | Heat Pump,
R-22, Reciprocating Comp | 460 | 2.60 | 1 | Biomass Boiler | 250 | 90% |
Renewable
Energy Systems | 0 | 1 | Photovoltaic
system, Instant self-consumption (60 kWp) | 50 | 85% | |||
1º Pump System | 3 | Constant Water
Flow | 9 | 49% | 3 | Constant Water
Flow | 7.5 | 60% |
2º Pump System | 6 | Constant Water
Flow | 11 | 49% | 6 | Variable Water
Flow | 9 | 60% |
AHU'S | 14 | Constant Air
Flow, Constant Water Flow, Thermal Free Cooling, No Heat Recovery, No_CO2_Detection | 34,5 | 14 | Variable Air
Flow, Variable Water Flow, Enthalphy Free Cooling, CO2 Detection, 65%_Heat_Recovery | 34.5 | ||
Fan Coils | 34 | Constant Air
and Water Flow | 6,3 | 34 | Constant Air
and Water Flow | 6.3 | ||
Control | Centralized
Analogical Control of AHU's. No Monitoring | Centralized
Digital Control of AHUS's, Chillers and Boiler. WebServer Monitoring | ||||||
Under Spanish legislation an efficient building
(Class ‘A’) is defined as a building with a non-renewable primary energy
consumption; due to air conditioning, lighting and hot water systems, 40% lower
compared to its own “reference building”.
The debate about what constitutes as
renewable energy and what does not, has no effect over certification, it can
therefore be understood that it will not affect future Class A buildings.
Renewable energies used are:
1. Biomass: Biomass produced on campus;
consisting of the campus’s and nearby farm’s agricultural crop residues, as
well as forest and garden waste and any other material found on the river
slopes is used. The chosen boiler is poly-combustible, though it is primed for
the use pellets; it will also be capable of working with chips and biomass with
a humidity of up to 30%.
2. Photovoltaics. A 60 kWp PV
system is installed in order to supply energy to the air conditioning
equipment. The system has been dimensioned to accommodate for the demand
produced by the AC pumps and fans. Therefore the primary energy savings due to
the use of the PV system is only justified through its use in the HVAC
facilities. PV energy sale to the grid is not considered, neither is its
consumption in any other facility within the building.
As mentioned above, Spanish certification
practice is based upon a comparison with a reference building. Not only is this
paper concerned with comparing the university building with a reference
building, but also and more importantly, with its former self.
Table V. Demand and emissions
comparison.
Demand and emissions | Before | After | Savings |
Heating Demand ( kWh/ m²) | 22.60 | 18.40 | 4.20 |
Cooling Demand ( kWh/ m²) | 153.00 | 134.80 | 18.20 |
Primary Energy ( kWh/ m²) | 718.00 | 157.40 | 560.60 |
Cooling Emissions (kg CO2/ m²) | 157.90 | 27.60 | 130.30 |
DHW Emissions (kg CO2/ m²) | 0.00 | 0.00 | 0.00 |
Lighting Emissions (kg CO2/ m²) | 21.20 | 6.30 | 14.90 |
Total Emissions (kg CO2/ m²) | 179.10 | 33.90 | 145.20 |
The improved indexes are produced via: the
upgraded air conditioning units, the utilization of biomass, the improvement in
lighting and the introduction of VFDs to the facilities’ pumps and fans. Ratios
by system are shown in Table VI.
Table VI. Energy and emissions by
each system before and after.
Before | After | |||||
SYSTEM | Final
Energy ( kWh/year) | Primary
Energy ( kWh/year) | Emissions
(kg CO2/year) | Final
Energy ( kWh/year) | Primary
Energy ( kWh/year) | Emissions
(kg CO2/year) |
Heating | 220 358.10 | 573 592.20 | 143 012.40 | 116 810.50 | 117 587.80 | 362.40 |
Cooling | 574 003.70 | 1 494 131.50 | 372 528.30 | 30 888.50 | 68 523.30 | 17 084.70 |
Pumps | 83 332.30 | 216 914.00 | 54 082.70 | 23 966.90 | 53 168.50 | 13 256.40 |
Fans | 455 483.90 | 1 185 624.20 | 295 609.00 | 218 208.50 | 484 076.00 | 120 693.50 |
Lighting | 178 805.40 | 465 430.30 | 116 044.70 | 62 803.10 | 139 323.00 | 34 737.10 |
TOTAL | 1
511 983.40 | 3
935 692.20 | 981 277.10 | 452 677.50 | 862 678.60 | 186 134.10 |
Investment in equipment is necessary as
existing equipment was obsolete. The proprietor (the university) is uniquely
concerned primary energy savings and the use of renewable energies.
Furthermore, the use of biomass is fully justified given the campus’s
characteristics.
The building’s Energy Performance
Certificate has been upgraded from ‘E’ to ‘A’.
The investment budget is € 690 906.
The economic savings will be analysed through subsystems.
Table VII. Economic ratios and return
periods by system.
Energy
and Emission Savings | Money
Saving and Repayment Period | ||||||
SYSTEM | Final
Energy ( kWh/year) | Primary
Energy ( kWh/year) | Emissions
(kg CO2/year) | Costs
of investment (€) | Cost
of final kWh Before | Annual
Savings (€) | Years
to repayment |
Heating | 103 547.60 | 456 004.40 | 142 650.00 | 119 348.00 | 0.05 | 5 476.08 | 21.79 |
Cooling | 543 115.20 | 1 425 608.20 | 355 443.60 | 279 653.00 | 0.06 | 34 099.70 | 10.43 |
Pumps | 59 365.40 | 163 745.50 | 40 826.30 | 34 568.00 | 0.11 | 6 530.19 | 6.73 |
Fans | 237 275.40 | 701 548.20 | 174 915.50 | 43 359.00 | 0.11 | 26 100.29 | 2.11 |
Lighting | 116 002.30 | 326 107.30 | 81 307.60 | 68 456.00 | 0.11 | 12 760.25 | 6.82 |
PV60 kWp | 115 624.00 | 9.58 | |||||
TOTAL | 1 059 305.90 | 2 617 009.20 | 652 493.00 | 661 008.00 | 84 966.51 | 7.78 | |
The average simple payback period of
investment is 7.78 years (Table VII).
Which is more than satisfactory given that the life expectancy of the
facilities is at least fifteen years.
The price of the heat recovery systems has
been included in the cooling system’s price. The cost implications of the
automatic regulation and control system have been shared out proportionately
amongst all systems.
The use of biomass fuel entails significant
savings in terms of the use of non-renewable, primary energy and eases the
procurement of the Energy Performance Certificate ‘A’.
The improved LED lighting system improves
the building’s efficiency, having such a fast return on investment.
ESEERs of above 5 are achieved using
cooling systems with inverter screw compressors, this dramatically improves the
building’s efficiency.
Though clearly not as remarkable as it
could have been in a colder climate, the energy recovery systems clearly
contribute towards the improvement in the building’s cooling and heating
demand. Moreover, in cases like these, they are a requirement under Spanish
regulations.
Not only do the fans, pumps and VFDs prove
to contribute actively towards the improved energy consumption and emission
ratings, but they also prove to be one of the more interesting ventures, due to
their fast return on investment.
The use of solar PV energy for instant
self-consumption within the HVAC system has proven to be the best method to
increase efficiency on these types of systems.
The annual consumption consequences of
running fans and pumps are very clear. During the building’s operating hours,
said systems are permanently on and in this particular case, account for
approximately 50% of final energy consumption. This can be effectively offset
through the utilization of renewable energy sources such as solar PV (in Spain,
only self-consumed PV electricity can be considered).
Follow us on social media accounts to stay up to date with REHVA actualities
0