


Stay Informed
Follow us on social media accounts to stay up to date with REHVA actualities
|
|
Marco NoroDepartment of Management and EngineeringUniversity of PaduaITALYmarco.noro@unipd.it | Giacomo BagarellaDepartment of Management and EngineeringUniversity of PaduaITALYbagarella@gmail.com |
Among the
public (but not only) buildings, residential care homes for elderly people are
ones of the potentially most important because of the increasing European
population aging. Nowadays about 14% of European population is over 65 years of
age, and it is expected that this number will double by 2050 [1]. These figures in Italy assume
dramatic values, as actually we have 21.4% of population over 65 (13 million)
and we will have 33.6% (18.7 million) by 2050 [2][3]. Nowadays about 1.5 million elderly
live in more than 24,000 care homes in Europe (300,000 elderly live in just
less than 6,000 in Italy). These buildings operate 24 hours a day, 365 days
a year, with full occupancy. For these reasons reducing energy consumption in
residential care homes is important.
In this
context, this paper focuses on the study of the energy performance of a quite
new residential care home for elderly people in Vicenza (North East of Italy).
A preliminary energy audit was carried out in order to obtain appropriate
information about energy consumption of the building. Moving from the request
of the managers responsible for running the care home, a Trnsys simulation
model of the building and heating/cooling plant system was developed aiming at
testing different solutions to retrofit the heating/cooling plant.
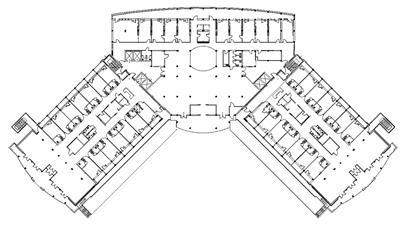
The
considered building is a 29,889 m³ residential care home for elderly
people built during the 2002–2004 period and located in Vicenza (North Italy). The
main data of the building are reported in Table 1. The model of this three floors building (about 2,800 m² each) was
implemented using “Trnsys3d for SketchUp” (Figure 1) and “TRNbuild”.
|
|
Figure 1. Photo, 3D model and layout (ground
floor) of the considered residential care home. | |
Table 1. Main data of the building.
Zone | Vicenza (North Italy) |
Heating degree days | 2479 |
Building destination | Residential care home |
Internal volume (m³) | 29,889 |
Floors | 3 |
External
Surface / Heated Volume ratio (m-1) | 0.35 |
Heating period | October 15th – April 15th |
Cooling period | April 16th – October 14th |
Typical
temperature set-point, heating period (°C) | 24.0 |
Typical
relative humidity set-point, heating period (%) | – |
Typical
temperature set-point, cooling period (°C) | 26.0 |
Typical
relative humidity set-point, cooling period (%) | 50% |
Ventilation
flow rate (m³ s-1) | 4.09 |
External
walls transmittance (W m-² K-1) | 0.517 |
Floor
transmittance (W m-² K-1) | 0.433 |
Roof
transmittance (W m-² K-1) | 0.287 |
Windows
transmittance (W m-² K-1) | 3.155 |
Average
internal heating gains (W m-²) | 4.0 |
Patients and staff | 160 |
An annual
simulation of both heating and cooling loads was run with one-hour time step:
annual heating and cooling energy use of the building were estimated to be 622,000 kWh
and 529,000 kWh, with peak loads of 610 kW and 707 kW
respectively. Concerning electric loads, there was availability of
disaggregated data (on a quarter hourly basis) from local electric distributor
for the years 2013 and 2014. Nevertheless, such data was subject to the
different environment conditions (e.g. summer 2014 was extremely colder than
usual in Italy) and building operating conditions. So, with some approximation
based on information found by talks with technical personnel of the home, an
hourly electric load profile was built taking into consideration monthly
electric consumptions (deduced by electric bills), the actual installed
electric power (400 kW) and the real data.
The
existing heating, ventilation and cooling plant is mixed air/water; it is set
up by:
·
heating
and cooling plant (vapour compression electric chiller and natural gas
boilers);
·
ventilation
and air conditioning plant (many air handling units (AHU) to control relative
humidity and for the necessary air changing inside the building; main units are
set up by a rotary heat exchanger, pre-heating, cooling and dehumidification
and post-heating sections). The common sites of the building (corridors, halls)
are served by fan-coils and ventilation air, rooms and bathrooms are served by
radiators and ventilation air, service and technical rooms by small AHUs or air
heaters;
·
air
extraction plant (for service rooms).
· The object of the work is the energy and economic analysis of the retrofitting of the heating and cooling plant only. The main components are:
·
one
air/water vapour compression electric chiller (2 circuits – 4 oil free
centrifugal compressors per circuit) which provides cold water for fan-coils
and cold coils in AHUs. The nominal cooling power is 895 kW, 270 kW
is the nominal electric power consumption, EER = 3.31. These
performances are labelled for summer external air 35°C and evaporator
input/output 12/7°C;
·
two
natural gas boilers with two-steps burners (nominal useful power 670 kW,
minimum useful power 425 kW each) provide the thermal energy for heating,
domestic hot water and pre and post-heating in AHUs.
The chiller
and the boilers supply three hydraulic circuits. The “hot collector” supplies
hot water to the radiators, air heaters, pre and post heating coils in the
AHUs. It supplies also the domestic hot water plate heat exchanger that loads a
5,000 l tank. The “hot/cold collector” supplies hot (during heating
season) or cold (during cooling season) water to the fan-coils. The “cold
collector” supplies cold water to the cold coils of the AHUs (obviously during
cooling season only). Reference [4] reports the temperature set points
of the different energy uses and the schedules of the main equipment.
The first
step was the simulation by Trnsys model of the just described existing plant
(“As Is” solution). The validation of the model was carried out by analyzing
flow rates and temperatures of the different circuits and by comparing
simulated and real energy consumptions of the heating/cooling plant system. Figure 2 reports the annual profiles of monthly
electrical energy (EE) and natural gas (NG) consumptions, both simulated and
real (referring to 2012, 2103 and 2014 available energy bills). Considering the
variability of the environment and building operating conditions, the
concordance between simulated and real data is quite good (the slight
overestimate of electrical energy consumption during mid seasons is due to the
wider cooling period in the simulations with respect to the reality).
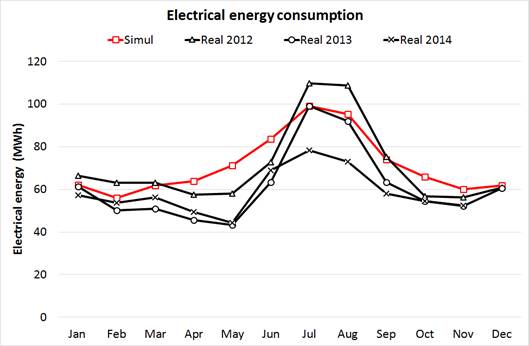
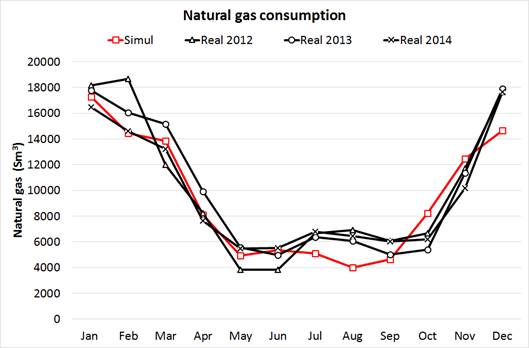
Figure 2. Annual profile of monthly
electrical energy and NG consumptions
Different
efficient technologies among the most common known were taken into
consideration for the energy improvement of the heating/cooling plant, chosen
referring to previous economic estimates in possession of the managers
responsible for running the care home. Main technical data of all the equipment
considered in the present analysis are reported in [4]. For the sake of brevity, extremely
concise information is here reported:
·
photovoltaics,
PV: different kinds of mono and poli-crystalline modules were considered,
varying the peak power in the 230–315 Wp
range (14-16.9% nominal efficiency), considering a fixed available area (two
terraces of 108 m² each on the roof and three parking shelters for 1,022 m²).
In one alternative it was supposed to be able to install more PV modules on the
roof (available area 350+350 m²). A penalization factor of −0.60%
per year was considered in order to take into account the annual decrease of
useful power. All the other parameters and input in Trnsys model were set in
order to suitably simulate the PV plant;
·
combined
heat and power, CHP (cogeneration): natural gas fueled internal combustion
engines were considered with two different electrical nominal power (103 and
199 kW) and two different control strategies (electric load following and
electric load following but during the 6.00 am-9.00 pm period only).
A smaller size one was further considered (60 kW nominal power, electric -
load following);
·
combined
cooling, heat and power, CCHP (trigeneration): in order to extend the operation
hours of the cogeneration plants, three of the previous cases were implemented
considering to use the heat produced by the engine also during cooling season
by coupling suitable sized lithium bromide-water single effect absorption
chiller;
·
heat
pumps: different sizes of vapour compression air/water heat pumps with both
electric motor (EHP) and natural gas engine (GEHP) were considered. For the
characterization of their performances the Authors referred to the UNI/TS
11300-4 and UNI EN 15316-4-2 method [5][6][7].
It was
assumed to maintain the two actually present boilers with the double scope of
both thermal integration and backup. Finally, primary energy consumptions were
calculated taking into account thermal and electrical nominal efficiencies (on
Lower Heating Value) for the cogenerators and nominal performances (COP) for
the heat pumps, and considering their variations with the partial load (data
derived by motors suppliers for the cogenerators – data derived implementing
the UNI/TS 11300-4 and UNI EN 15316-4-2 calculation methods for
quantifying energy loads and efficiencies of electrical HP-based heating
plants).
Table 1. Costs of the
different heating/cooling plant retrofitting solutions (*Refer to the HP nominal thermal power at the
condenser at A7/W45 conditions) (**Electric motor efficiency=0.95 – Internal
combustion engine efficiency=0.3 [7]).
Alternative | Cost per kW (Electric/Thermal/Cooling) installed | Electric/ Thermal/ Cooling installed power | Set
up and adaptation | Total investment cost | Annual
ordinary maintenance cost |
As Is | Sunk cost | - | - | - | 5000 € |
1, Solon Black | On the roof: 1,300 € kWp-1 On the parking
shelter: 1,700 € kWp-1 | 33.9 kWp-1 156.9 kWp-1 | - | 310,792 € | 3400 € |
2, Solon Black | On the roof: 1,300 € kWp-1 On the parking
shelter: 1,700 € kWp-1 | 29.4 kWp-1 136.2 kWp-1 | - | 269,744 € | 3400 € |
3, Abba Solar ASP | On the roof: 1,300 € kWp-1 On the parking
shelter: 1,700 € kWp-1 | 32.0 kWp-1 148.0 kWp-1 | - | 293,200 € | 3400 € |
4, Renesola 156 | On the roof: 1300 € kWp-1 On the parking
shelter: 1700 € kWp-1 | 35.2 kWp-1 162.8 kWp-1 | - | 322,520 € | 3400 € |
5, Renesola Virtus II
JC315M-24/Abs poli (315 Wp) | On the roof: 1300 € kWp-1 On the parking
shelter: 1,700 € kWp-1 | 30.2 kWp-1 156.2 kWp-1 | - | 304,920 € | 3400 € |
1, Solon Black | On the roof: 1,300 € kWp-1 On the parking
shelter: 1,700 € kWp-1 | 110.2 kWp-1 156.9 kWp-1 | - | 410,008 € | 3400 € |
1,
103 kW – el. following | 1,800 € kWel-1 | 103 kWel | 10000 € | 195,400 € | 0.020 € kWhel-1 |
2,
199 kW – el. following | 1,400 € kWel-1 | 199 kWel | 10000 € | 288,600 € | 0.020 € kWhel-1 |
3, 103 kW – el. following – day time only | 1,800 € kWel-1 | 103 kWel | 10000 € | 195,400 € | 0.020 € kWhel-1 |
4, 199 kW – el. following – day time only | 1,400 € kWel-1 | 199 kWel | 10000 € | 288,600 € | 0.020 € kWhel-1 |
5,
60 kW – el. following | 2,000 € kWel-1 | 60 kWel | 8000 € | 128,000 € | 0.020 € kWhel-1 |
2,
199 kW – el. following – trigeneration | Cogenerator: 1,400 € kWel-1 Abs. chiller: 500 € kWc-1 | Cogenerator: 199 kWel Abs. chiller: 147 kWc | 30000 € | 382,100 € | 0.020 € kWhel-1 |
3, 103 kW – el. following – day time only – trigeneration | Cogenerator: 1,800 € kWel-1 Abs. chiller: 600 € kWc-1 | Cogenerator: 103 kWel Abs. chiller: 70 kWc | 25000 € | 252,400 € | 0.020 € kWhel-1 |
5,
60 kW – el. following – trigeneration | Cogenerator: 2,000 € kWel-1 Abs. chiller: 625 € kWc-1 | Cogenerator: 60 kWel Abs. chiller: 50 kWc | 20000 € | 171,250 € | 0.020 € kWhel-1 |
EHP_99 kWt* | 500 € kWel-1 | 29 kWel | 20000 € | 34,600 € | 10 € kWel-1 |
GEHP_99 kWt* ** | 250 € kWth-1 | 153 kWth | 30000 € | 68,239 € | 5 € kWth-1 |
EHP_209 kWt* | 500 € kWel-1 | 58 kWel | 20000 € | 48,900 € | 10 € kWel-1 |
GEHP_209 kWt* ** | 250 € kWth-1 | 300 kWth | 30000 € | 105,042 € | 5 € kWth-1 |
EHP_311 kWt* | 500 € kWel-1 | 86 kWel | 20000 € | 63,000 € | 10 € kWel-1 |
GEHP_311 kWt* ** | 250 € kWth-1 | 458 kWth | 30000 € | 144,479 € | 5 € kWth-1 |
EHP_424 kWt* | 500 € kWel-1 | 116 kWel | 20000 € | 78,000 € | 10 € kWel-1 |
GEHP_424 kWt* ** | 250 € kWth-1 | 618 kWth | 30000 € | 184,438 € | 5 € kWth-1 |
Investment
costs were determined by purchase, installation and first set up, besides costs
of the existing plant adaptation [7][8][9][10] (Table 1). The same table reports on the
ordinary maintenance costs of the different solutions, while such costs for the
existing plant are considered to be 5,000 € year-1. Reference
[4] reports on the costs of energy:
natural gas and electricity purchased by the local distributors.
Concerning
the management of the electricity produced by the cogenerators and photovoltaic
plant besides own consumption, it was considered to be sold to the GSE (Energy
Services Manager) at a constant price (fixed in 5.5 c€ kWh-1). For the alternatives here considered, the incomes from the energy
efficiency certificates resulted negligible because they did not, or only
slightly, satisfy the minimum primary energy saving index provided by the
2004/8/EC directive [11]. Finally, for the primary energy
calculations we considered the conversion factors reported in [12][13], i.e. 1 kWhpr kWhth-1 and 2.17 kWhpr kWhel-1 respectively for natural gas and
electricity.
The
solutions that maximize NG consumptions (even if minimizing the boilers
consumption) are the ones with the installation of the 199 kWel nominal power cogenerators, while the solutions minimizing the
consumption in absolute terms concern installing the biggest sized electric
heat pumps (“EHP_311 kWt” and “EHP_424 kWt”). The balance, in terms
of electrical energy, takes into account the “self-produced” and the “sold to
grid” electricity: the solutions that minimize the purchase from the grid (by
more than 20 times with respect to the “As Is” plant) are the ones that
maximize the self-production (“2, 199 kW
– el. following” with and without trigeneration).
A more
comprehensive comparison, carried out in terms of primary energy (PE), is
reported in specific terms (per square meter of building surface) and in
absolute terms as well in Table 2. Self-produced electrical energy
accounts for a negative value in terms of consumption, so the best solutions
foresee the installation of 199 kWel cogenerator (coupling the
absorption chiller allows a very slight improvement). These solutions allow to
reduce by 63% the PE consumption. Anyway, if one looks at the benchmark for
Italy suggested by [1] (234 kWh m-² year-1), all the CHP and CCHP alternatives
and two PV solutions are performant. On the other hand, heat pumps, both
electric and natural gas driven, are not advantageous at all and, in some
cases, they lead to an increase of the PE consumption. This is due to the
penalized operation of air/water heat pumps in the Vicenza winter climate with
frequent defrosting necessity ([9][10][14]) and especially due to the high
temperature of water to be produced at the condenser (70°C) serving the
radiators and the pre and post heating coils of AHUs.
Table 2. Annual Primary Energy consumption of the different solutions, both absolute (MWh) and specific (kWh m-²)
Alternative | Total
PE | Saving | |
(MWh) | (kWh
m-²) | ||
As Is | 2,944 | 351 | – |
1, Solon Black 220/16 mono (265 Wp) | 2,015 | 240 | 32% |
2, Solon Black 220/16 poli (230 Wp) | 2,058 | 245 | 30% |
3, Abba Solar ASP 60 245-250 poli Plus
(250 Wp) | 2,058 | 245 | 30% |
4, Renesola 156 mono (275 Wp) | 1,942 | 231 | 34% |
5, Renesola Virtus II JC315M-24/Abs poli (315 Wp) | 2,138 | 255 | 27% |
1, Solon Black 220/16 mono (265 Wp)__Plus | 1,694 | 202 | 42% |
1, 103 kW – el. following | 1,236 | 147 | 58% |
2, 199 kW – el. following | 1,101 | 131 | 63% |
3, 103 kW – el. following – day time only | 1,524 | 181 | 48% |
4, 199 kW – el. following – day time only | 1,317 | 157 | 55% |
5, 60 kW - el. following | 1,689 | 201 | 43% |
2, 199 kW – el. following – trigeneration | 1,092 | 130 | 63% |
3, 103 kW – el. following – day time only – trigeneration | 1,581 | 188 | 46% |
5, 60 kW – el. following – trigeneration | 1,720 | 205 | 42% |
EHP_99 kWt | 2,999 | 357 | −2% |
GEHP_99 kWt | 3,067 | 365 | −4% |
EHP_209 kWt | 2,911 | 347 | 1% |
GEHP_209 kWt | 3,064 | 365 | −4% |
EHP_311 kWt | 2,916 | 347 | 1% |
GEHP_311 kWt | 3,111 | 370 | −6% |
EHP_424 kWt | 2,931 | 349 | 0% |
GEHP_424 kWt | 3,135 | 373 | −6% |
The
interest rate, the inflation rate and the period of the economic analysis were
fixed at 4%, 1.8% and 20 years respectively. From the economic point of view,
the comparison between the different alternatives did not consider the
investment cost of substituting the existing plant, as it was considered to be
a sunk cost (Table 1). The best solutions in terms of
trade-off between maximum differential (investment alternative versus “As Is”
solution) net present worth (NPW) and minimum discounted pay-back period (DPB)
are the CHP/CCHP ones with installed electrical power around or less than 100 kWel. In these cases, NPW is around 630-670 k€ and DPB is between 3 and 4
years (Figure 3); these are very interesting
results, also considering that we are talking about the plant of a public
building stock (so payback periods can be quite longer than in industry
sector). These are also the solutions that allow the minimization of thermal
energy dissipation by the cogenerator. From this point of view, it is
interesting to observe that a further increase of the economic viability of
such alternatives would be obtained by operating the cogenerator with the
thermal load following logic.
Concerning
the “2, 199 kW” solution it is worth to stress that coupling the
absorption chiller can improve the economic viability, but even more
advantageous is the operation during the day only (respectively NPW increases
from 195 to 332 to 423 k€ and DPB decreases from 10.9 to 9.6 to 7.1 years).
Photovoltaics is also interesting, even if it allows smaller NPWs (200-300 k€)
and longer DPBs (9-11 years). Should be possible to use more surface on the
roofs (“1, Solon Black 220/16 mono (265 Wp)__Plus”
solution) the economic viability would increase (NPW=440 k€, DPB=8.6 years). It
is interesting to observe that heat pump solutions are not advantageous at all
as they present a greater than “As Is” solution annual cash flow for the
reasons explained before.
In
reference [4] these conclusions are completed by
a sensitivity analysis in order to compensate for the uncertainty of some of
the parameters here considered, such as natural gas and electrical energy costs.
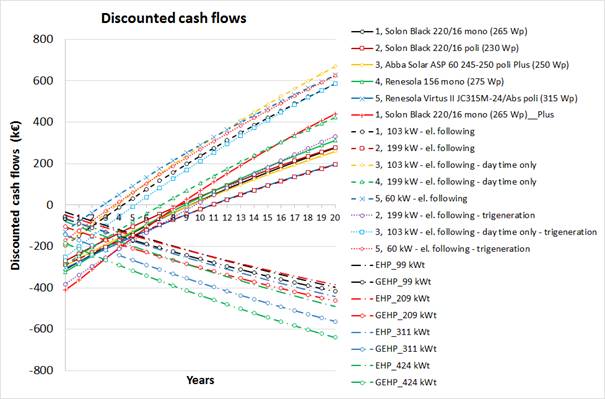
Figure 3. Discounted differential (between
the alternatives and the “As Is” solution) cash flows of the different
solutions. NPWs can be read at the end of the period of analysis (20 years),
DPBs by the interceptions of the curves with the x-axis.
Many energy
efficiency interventions can be thought to be implemented in residential care
homes for elderly people as the greatest part of them are old buildings, i.e.
built before regulations on buildings energy performance and economic
incentives. In this sense, interventions on the building (e.g. retrofitting of
the opaque and transparent surfaces by thermal insulation and windows
substituting) are the first ones that should be implemented; installing a solar
thermal plant and substituting the old lighting appliances by more efficient
ones should be the second ones. In more recent (and so more energy performant)
buildings some retrofitting interventions in heating/cooling plant can be analyze.
Photovoltaics, cogeneration, trigeneration, electric and gas engine heat pumps
were considered in this study and the energy and economic viability were
evaluated. Cogeneration with small size engines (with respect to the installed
electric power by local distributor) result the most advantageous solutions,
whereas coupling a single-effect absorption chiller do not significantly
improve the advantage. Photovoltaics as well allows an interesting energy
saving with respect to the existing plant, even if with longer payback periods.
Air/water heat pumps (the most economic and widespread diffused ones) are not
advantageous at all in this case because of the high temperature at condenser
and because of the cold and humid winter climate typical of the Po Valley (that
implies frequent defrosting of the evaporator coil). The main conclusions of
this study will be delivered to the managers responsible for running the
residential care home in order to make energy efficient informed decisions.
[1]
Esteves
Pedro, Fonseca Paula, Almeida Aníbal, Nunes Urbano, 2011. EU comprehensive
document on energy efficiency in Residential Care Homes for the Elderly. SAVE
AGE Project. IEE/09/676/SI2.558233.
[3] ISTAT (Italian
national statistics institute), 2006. Previsioni demografiche
nazionali (National demographic forecasts, in Italian).
[7]
Busato
Filippo, Lazzarin Renato, Noro Marco, 2012. Energy
and economic analysis of different heat pump systems for space heating,
International Journal of Low Carbon Technologies, 7(2), pp. 104-112,
doi:10.1093/ijlct/cts016.
[9]
Lazzarin
Renato, Noro Marco, 2006a. District heating and
gas engine heat pump: economic analysis based on a case study, Applied Thermal
Engineering, 26, pp. 193-199, doi:10.1016/j.applthermaleng.2005.05.013.
[10]
Lazzarin
Renato, Noro Marco, 2006b. Local or district
heating by natural gas. Which is better from energetic, environmental and
economic point of view?, Applied Thermal Engineering, 26, pp. 244-250,
doi:10.1016/j.applthermaleng.2005.05.007.
[11]
Directive 2004/8/EC of the European Parliament and of
the Council on the promotion of cogeneration.
[14] Busato Filippo, Lazzarin Renato, Noro Marco,
2011. Ten years history of a real gas
driven heat pump plant: energetic, economic and maintenance issues, Applied
Thermal Engineering, 31, pp. 1648-1654,
doi:10.1016/j.applthermaleng.2011.02.006.
Follow us on social media accounts to stay up to date with REHVA actualities
0