


Stay Informed
Follow us on social media accounts to stay up to date with REHVA actualities
|
|
|
Hana Bukovianska
PustayováSlovak University of
Technology in BratislavaFaculty of Civil
EngineeringDepartment of Building
Serviceshana.bukovianska@gmail.com | Veronika FöldvárySlovak University of
Technology in BratislavaFaculty of Civil
EngineeringDepartment of Building
Servicesveronika.foldvary@gmail.com | Dušan PetrášSlovak University of
Technology in BratislavaFaculty of Civil EngineeringDepartment of Building
Services |
The current
study investigates the impact of building renovation on the energy consumption,
thermal comfort, indoor air quality and occupants´ satisfaction. Two sets of
experiments were carried out. Indoor air quality was investigated in three
pairs of dwellings while energy evaluation and investigation of the thermal
comfort were carried out in six pairs of residential buildings. Each pair of
the dwellings consisted of two buildings with identical construction; however,
the building pairs were mutually different. One of the buildings was recently
renovated, while the other one was in its original condition. Both objective
measurements and subjective evaluation using questionnaires have been used.
Temperature, relative humidity and CO2 concentration were
measured in the apartments in winter and summer period. Energy performance and
thermal comfort were investigated in the heating season. The study indicates
that the large-scale renovations may reduce energy consumption of the building
stock. However, without considering the impact of energy renovation on
environmental quality, the implemented energy saving measures may reduce the
quality of the indoor environment in many apartments, especially in the winter
season.
Buildings are at the pivotal centre of our lives. The characteristics of a
building, its design, its appearance, feel, and its technical standards not
only influence our productivity, our well-being, our moods and our interactions
with others, but they also define the amount of energy consumed by a building [1].
Energy retrofitting of the existing European building stock provides both
significant opportunities and challenges. It is an important topic not only in the field of
energy conservation, but it may influence the quality of life as well. People spend
more than 90% their time indoors, with a significant portion of this time spent
at home [2], therefore the potential impact of energy saving measures on indoor
environmental quality should not be neglected. This is especially the case in
countries where the trend is to reduce air infiltration by tightening the
building. Changes
caused by renovation can be negative or positive, and some measures will not
influence indoor environmental quality at all [3].
The
parameters of the indoor environment that have an impact on the energy
performance of buildings as well as input parameters for the building systems
design and energy performance calculations are well specified by Standard
EN 15 251(2007). It defines the global comfort as the sum of
different aspects, i.e. thermal comfort, indoor air quality, visual comfort and
acoustic comfort. The standard also recommends parameters of indoor
temperatures, ventilation rates, illumination levels and acoustical criteria
for the design, heating, cooling, ventilation and lighting systems. It is
mainly applicable to moderate thermal environments, where the objective is to
reach the satisfaction of the occupants [4]. The impact of energy retrofitting
on the indoor air quality is rarely considered. The indoor air quality may be
often compromised due to decreased ventilation and infiltration rate.
This study
provides an insight in the energy performance of the Slovak residential
buildings and investigates impact of building renovation on indoor
environmental quality.
The study
was performed in three pairs of residential buildings. One of the buildings in
each pair was renovated and the other was in its original state. The
energy-retrofitting included thermal insulation of facade, replacement of
windows with energy efficient ones and hydraulic balancing of the heating
system. The non-renovated buildings were mostly in their original state.
However, new plastic frame windows have been already installed over the last
years in most of the apartments in these buildings. Natural ventilation was
used in all buildings. Exhaust ventilation was present in bathrooms and toilets
[5].
Experimental
measurements were performed during the heating season in 2013/2014 and in
summer 2014. Temperature, relative humidity and the concentration of CO2 were measured in bedrooms of the apartments using a
HOBO U12-012 data logger (Onset Computer Corp., USA) and CARBOCAP CO2 monitors (GMW22, Vaisala, Finland). The data were
recorded in 5 minute intervals for one week in each building [6]. The
locations of the instruments were selected with respect to the limitations of
the carbon dioxide method [7]. The measurements were conducted in 94 apartments
in the winter (45 apartments in original buildings, 49 in renovated ones)
and in 73 apartments in the summer season (35 apartments in original
buildings, 38 in renovated ones). Data from night periods between 20:00 and
6:30 were used for calculation of air change rates. Occupancy and physical
state of residents were also included into the process of calculation [8].
At each
visit, the residents were asked to fill in a questionnaire regarding some
building characteristics, occupant behaviour and habits, sick building syndrome
symptoms and occupants’ perception of indoor air quality and thermal
environment. The occupants of the renovated buildings were also asked questions
about altered habits after renovation [5].
The CO2 concentration was used to calculate the air exchange
rate during 5–8 nights in each bedroom. The occupants’ CO2
emission rate was determined from their weight and height available from the
questionnaires [9].
According
to ISO 7730 and ASHRAE Standards, the recommended range of the indoor
temperature during the winter conditions is between 20°C and 24°C [10, 11]. In
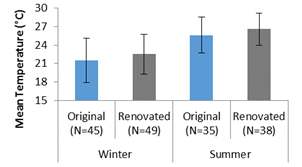
the winter season the overall mean indoor air temperature was higher in the
renovated buildings (22.5°C) compared to the original dwellings (21.5°C), (Figure 1). The indoor temperature in bedrooms was within the recommended range
for most of the time in both the original (78%) and the renovated (91%)
dwellings. Longer periods with average temperatures below 20°C were observed in
the non-renovated buildings (18%) than in the renovated ones (2%).
The
recommended indoor temperature during summer conditions ranges between 23°C and
26°C [10, 11]. In summer the overall average temperature was 25.7°C in the
original dwellings and 26.6°C in the renovated dwellings (Figure 1). According to the results obtained from the whole measurement period
49% of apartments in the original building and 71% of apartments in the
renovated dwellings were out of the recommended range with higher indoor
temperatures than 26°C. The rest of the apartments met the criteria of the
guidelines.
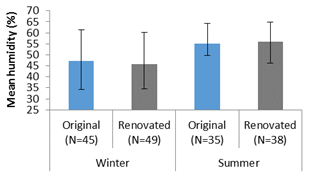
The
recommended indoor relative humidity is between 30% and 60% [11]. The mean
relative humidity across almost all the apartments met the prescribed range (Figure 1). In winter only two apartments in the original buildings and one
apartment in the renovated dwellings reported higher average relative humidity
than the recommended maximum. In summer except four apartments in the original
buildings as well as in the renovated ones all the apartments met the criteria
on the indoor relative humidity.
|
|
Figure 1.
Average indoor temperature (left) and humidity (right) in the bedrooms of the
investigated during the winter and summer season. Ends of the whiskers
characterises the minimum and maximum values. | |
In the
winter the average CO2 concentration during the
nights across all apartments was higher in the renovated buildings than in the
original ones. In 83% of apartments located in the renovated buildings the
average CO2 concentration was higher than
1 000 ppm, while this was the case in 75% of apartments in the
original buildings. The fractions of apartments where the 20-min running
average CO2 concentrations exceeded 1 000,
2 000 and 3 000 ppm are shown in Table 1. In the summer the average
night-time CO2 concentrations were similar in both
types of buildings [5].
Table 1.
Night-time CO2 concentrations and fractions of
apartments with average CO2 above 1000 ppm
and with at least one 20-minute period with CO2 above
three cut-off values in the investigated buildings.
Winter | Summer | |||
Original | Renovated | Original | Renovated | |
Mean CO2 during night (ppm) | 1425 | 1680 | 845 | 815 |
Average CO2
>1 000 ppm (%) | 71 | 80 | 43 | 40 |
20-min period CO2
>1 000 ppm (%) | 75 | 83 | 43 | 40 |
20-min period CO2
>2 000 ppm (%) | 17 | 32 | 0 | 5 |
20-min period CO2
>3 000 ppm (%) | 4 | 8 | 0 | 0 |
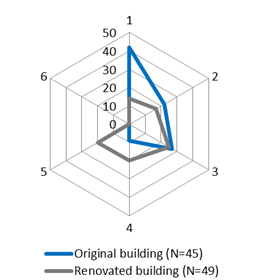
According
to results obtained from questionnaire surveys the residents in the
non-renovated buildings did not indicate severe problems with the perceived air
quality. During the winter, a greater fraction of the occupants indicated poor
air quality in the renovated buildings compared to the non-renovated buildings
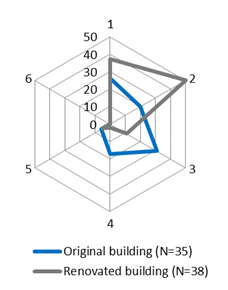
(Figure 2). In the summer, most of the subjects in the
renovated buildings found the indoor air quality good while occupants in the
original buildings indicated medium to good indoor air quality in the bedrooms
[5].
|
|
Figure
2. Summary of answers to the question “How unpleasant do you think the indoor
air quality is in your bedroom during night/in the morning?”. Answers were
from 1 – perceived air quality was not a problem, to 6 – poor indoor air
quality. One occupant in each apartment answered during winter (left) and
summer (right) [1]. | |
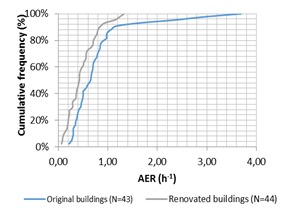
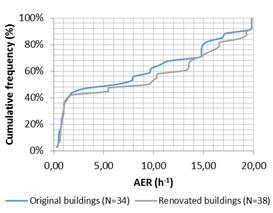
The average
air exchange rate across the apartments in the original buildings (0.79 h-1) was significantly higher than in the renovated
buildings (0.48 h-1) in winter. The average
air exchange rates were above the minimum recommended value (0.5 h-1) in 63% of apartments located in the original
dwellings, unlike in the renovated ones (42%). In the summer the average air
exchange rates were similar in both types of buildings [5]. The majority of the
evaluated apartments in the non-renovated (97%) as well as in the renovated
dwellings (94%) exceeded the minimum criteria for the air exchange rates (Figure 3).
|
|
Figure
3. Cumulative percentage of air exchange rates in the original and the
renovated buildings during winter (left) and summer (right). | |
Energy
renovation may change the indoor environment in the dwellings. It may directly
lead to lower ventilation rates and higher concentrations of indoor pollutants [12]. Ventilation rates are also
influenced by the occupants´ ventilation habits. In the present study 22% of
the occupants in the renovated buildings indicated that they ventilate more
often during the winter than before renovation. This may indicate increased CO2 concentrations and poorer indoor air quality
associated with renovation works. The results from the summer further support
this observation; 47% of residents indicated that they have changed their
ventilation habits and ventilated more often than they did before renovation.
People ventilate more often at higher ambient temperatures. This leads to
higher ventilation rates in summer than in winter [13, 14]. The larger fraction of occupants
in the renovated homes changed their ventilation habits in the summer compared
to winter. This may partly explain the lower CO2
concentrations and better perceived air quality in the renovated buildings than
in the original buildings in the summer, as opposed to the winter [5].
This part
of the study was performed in six pairs of residential buildings. In each pair
of the buildings was renovated and the other was in its original state. Each
pair of the dwellings contained from identical apartment buildings in term of
construction systems. The following Slovak structural systems were chosen: TA
06 BA, BA NKS, ZTB, BA NKS P.1.15, P.1.14, P.1.15. Building refurbishment
included three energy efficiency strategies: thermal insulation of facade and
roof, replacement of windows in common premises, hydraulic balancing of the
heating system. The non-renovated buildings were mostly in their
original state. However, in the residential part of the buildings,
approximately 90% of the windows have been already replaced with energy
efficient (plastic) ones [15].
Energy
audit was carried out to investigate the energy performance of the residential
buildings. It included inspection, evaluation and analysis of existing
situation of the selected buildings. Energy need for heating was calculated for
each investigated dwelling according to EN ISO 13790. Also the real
data of energy consumptions were collected from the housing associations
maintaining the selected buildings. The detailed steps of energy auditing are shown
in publication by Dahlsveen et al [16].
The data
collected from energy monitoring were processed in ENSI EAB software.
Energy-Temperature diagram (ET-diagram) performed by this software was used for
data analyses. It presents ET-curves tailored for quick calculations of the
energy performance in original and new buildings.
For the
purpose of the subjective evaluation two types of questionnaires were created
(questionnaires used in the original and the renovated buildings). The
questionnaires contained questions about basic information on the inhabitants,
building characteristics, thermal comfort and local discomfort as well as about
occupants´ ventilation habits. The occupants of the renovated buildings were
also asked questions about altered heating and ventilation habits after
renovation [15].
The evaluation of thermal environment was performed using PMV (predicted
mean vote) and PPD (percentage of dissatisfied) indices. The survey asked
subjects about their thermal sensation on the ASHARE seven-point scale from
cold (−3) to hot (+3). Fanger’s equations were used to calculate the PMV
of a large group of occupants (N=244 in original; N=236 in renovated
dwellings). It also took into account the occupants’ physical activity
(metabolic rate), the thermal resistance of their clothing, air temperature,
mean radiant temperature, air velocity, and partial water vapour pressure [10].
The field measurements of indoor temperature and relative humidity were
performed in the living rooms of selected apartments (N=8 in original; N=12 in
renovated buildings), in period of the heating season from October 2011 to
April 2012. The data were recorded in 15 minute intervals by using HOBO
U12 loggers.
a) Energy
evaluation
The energy need for heating was calculated for each pair of the residential
buildings [15]. Table 2 shows a
detailed summary of the real energy consumptions, energy needs for heating and
the classification of the investigated buildings into energy classes according
to the Slovak regulations. The energy saving potential was higher than 30%
across all investigated structural systems with the highest percentage of
difference in energy need for heating (52%) in case of T06 BA residential
buildings. The real data of energy consumption were alike the results from
calculation except for two structural systems, ZTB and BA NKS-S P.1.15.
Noticeable difference between calculated and real values might be caused by
standardized climatic conditions for Bratislava which were used in the
calculation method. The real conditions are usually different from the
standardized ones. In our study the real outdoor temperature was changing day
to day during the heating season. As it was expected, the energy retrofitted
dwellings were classified into higher energy classes than the original ones.
Table 2. Summary of real energy consumption, energy calculation and
energy classification of the residential buildings.
Structural system | State of building | Real energy
consumption (kWh) | Difference (%) | Energy need for
heating (kWh) | Difference (%) | Floor area (m²) | Energy class for
heating | |
T06 BA | Original | 307433 | 55 | 352148 | 52 | 3723 | D | |
Renovated | 138889 | 169846 | B | |||||
BA NKS | Original | 388956 | 39 | 368329 | 34 | 3980 | D | |
Renovated | 238703 | 241607 | C | |||||
ZTB | Original | 722910 | 15 | 843437 | 51 | 9094 | D | |
Renovated | 611930 | 409814 | B | |||||
BA NKS | Original | 476440 | 28 | 530000 | 40 | 6110 | D | |
Renovated | 341469 | 319871 | B | |||||
P.1.14 | Original | 367970 | 43 | 360571 | 38 | 4680 | C | |
Renovated | 209278 | 224244 | B | |||||
P.1.15 | Original | 239192 | 51 | 343533 | 51 | 3421 | D | |
Renovated | 117890 | 181263 | B | |||||
b) Energy
monitoring
Energy
monitoring was based on periodic (weekly) recording of the energy consumption
data and measurements of the corresponding mean outdoor temperature. The
ET-curve for each pair of the buildings was created to compare the results
between the actual state of energy consumption in the original buildings and
the optimal energy consumption in the retrofitted ones. The ET-curve was
created for each investigated building type. Figure 4 shows an example of ET-curves for
the structural systems T06 BA and P.1.14.
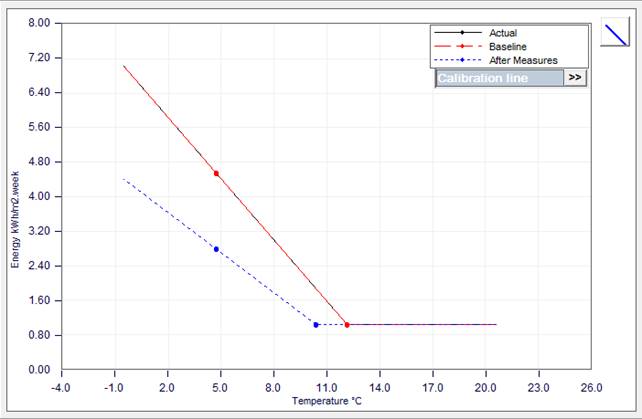
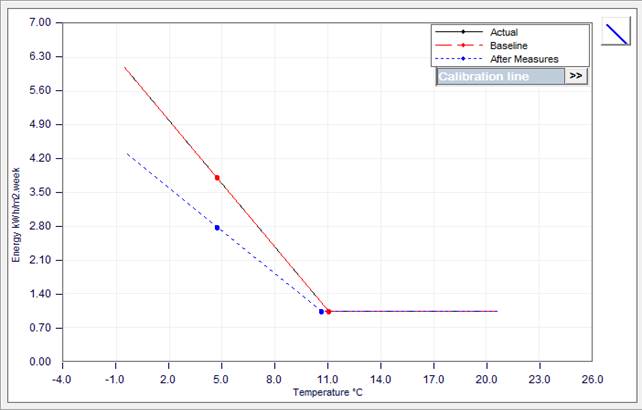
Figure 4. ET-curve for the structural systems T06 BA (top) and P.1.14 (bottom).
The solid
line represents buildings in the original condition and the dot line
characterises the retrofitted buildings. The curve consists of two parts. The
sloping line presents energy consumption of the heating system and the
horizontal one shows energy consumption of the domestic hot water (DHW). The
energy of the delivered DHW was not inquired into detail. It was calculated
based directly on floor area. This method is characterised by the assumption
that there is a linear relationship between the DHW demand and the floor area
of the building [17].
The greater fraction of occupants indicated slightly warm and warm thermal
sensation in both types of buildings, with higher percentages of “warm (+2)”
thermal environment in the renovated dwellings (50%) compared to the original
ones (30%). Regarding the thermal preferences of occupants´, higher percentage
of respondents preferred warmer thermal environment in the non-renovated
dwellings (31%) compared to the responses from occupants in the retrofitted
buildings (8%). The majority of occupants were satisfied with the ordinary
state of the air temperature in both types of the dwellings (Table 3), [15].
Table 3. Thermal sensation (left) and the
thermal preferences (right) in the investigated residential buildings.
|
|
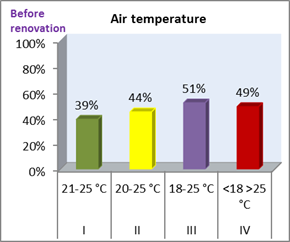
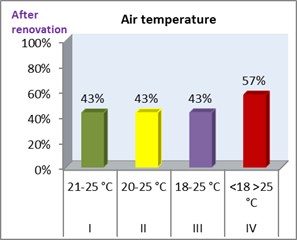
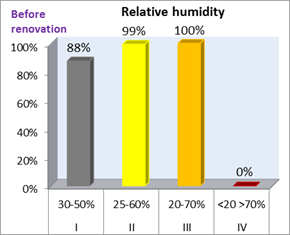
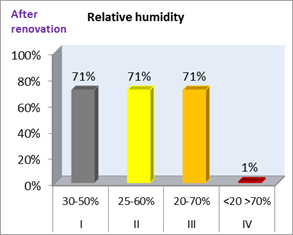
Indoor air temperature and relative humidity were classified by categories
according to EN 15 251 (Figures 5 and 6). The
overall mean air temperature was lower in the original dwellings (22.8°C)
compared to the renovated ones (23.7°C). In case of the non-renovated buildings
the air temperature was fluctuating between Category I and Category III, with
mainly presented temperature range from 22°C to 24°C. In buildings after
renovation the temperature was ranging from 23°C to 25°C. The measured relative
humidity corresponded to Category II. Visible decrease of the relative humidity
occurred from 1.2 2012 to 15.2 2012 when the outdoor temperature was ranging
between −5°C and −10°C. The relative humidity was between 30% and
50% in the retrofitted buildings and it was mostly corresponding to Category
III. The percentage of the time when the measured data were out of the limit
are negligible in both types of the buildings [18, 19].
|
|
Figure 5. Classification of the air temperatures according to EN
15 251 in the original (left) and retrofitted (right) residential buildings.
|
|
Figure 6. Classification
of the relative humidity according to EN 15 251 in the original (left) and
retrofitted (right) residential buildings.
Energy
retrofitting can contribute significantly to reduce energy consumption of
buildings. On the other hand, without consideration of its effects on indoor
environmental quality and people as well as without properly made renovation
plan it may reduce the quality of the indoor environment in the apartments,
especially in the winter season. Unless measures are taken against decreasing
ventilation rates during the reconstruction process (e.g. installing exhaust
ventilation or mechanical ventilation), the occupants need to ventilate more in
order to improve the indoor air quality to the level it was before the
reconstruction.
The authors
want to thank Bjarne W. Olesen and Gabriel Bekö from the Technical University
of Denmark for co-supervising of the projects.
[1] Buildings Performance Institute Europe (BPIE), Europe’s Building under
the Microscope-a country by country review of the energy performance of
buildings, 2011.
[2] Molloy S.
B., Cheng M., Galbally I. E., Keywood M. D., Lawson S. J., Powell J. C.,
Gillett R., Dunne E., Selleck P. W. Indoor Air Quality in Typical Temperate zone Australian dwellings. Atmospheric Environment,2012,
vol. 54, p. 400–407.
[3] Noris F.,
Delp W., Vermeer K., Adamkiewicz G., Singer B., Fisk W. Protocol for maximizing
energy savings and indoor environmental quality improvements when retrofitting
apartments. Energy and Buildings, 2013, vol. 61, p. 378–386.
[4] STN EN 15251 Indoor environmental input parameters for design and
assessment of energy performance of buildings addressing indoor air quality,
thermal environment, lighting and acoustics. Brussels: CEN.
[5] Olesen, B.W., Seppanen, O., Boerstra, A. (2006) Criteria for the indoor
environment for energy performance of buildings: A new European standard,
Facilities, Vol. 24 Iss: 11/12, pp.445–457
[6] FÖLDVÁRY, V., BEKÖ, G., PETRÁŠ, D.
Seasonal variation in indoor environmental quality in non-renovated and
renovated multifamily dwellings in Slovakia. In Healthy Buildings Europe 2015: proceedings. Eindhoven, Netherlands, 18.–20. 5.
2015. Eindhoven: Eindhoven University of Technology, 2015, ISBN
978-90-386-3889-8.
[7] Földváry V.,
Bekö G., Petráš D. Impact of energy renovation on indoor air quality in
multifamily dwellings in Slovakia. Proceedings of Indoor Air 2014, Hong Kong,
Paper No. HP0143.
[8] Persily, Ak., Evaluating Building
IAQ and Ventilation with Indoor Carbon Dioxide. ASHRAE Transactions, 1997, Vol.
103, No. 2.
[9] Bekő G., Toftum J., Clausen
G., Modeling ventilation rates in bedrooms based on building characteristics
and occupant behaviour. Building and Environment, 2011, Vol. 46, p. 2230–2237
[10] ISO 7730 Moderate thermal environments –
Determination of the PMV and PPD indices (1994)
[11] ASHRAE
Standard 55-2003 Thermal
Environmental Conditions for Human Occupancy (ANSI Approved).
[12] Noris F., Delp W., Vermeer K., Adamkiewicz G.,
Singer B., Fisk W. (2013) Protocol for maximizing energy savings and indoor
environmental quality improvements when retrofitting apartments. Energy and
Buildings, vol. 61, pp. 378–386.
[13] Wallace La, Emmerich Sj, Howard-Reed
C. (2002) Continuous measurements of air change rates in an occupied house for
1 year: the effect of temperature, wind, fans, and windows. Expo Anal Environ
Epidemiol, 12(4), pp. 296–306.
[14] DUBRUL C. (1988) Inhabitant
behaviour with respect to ventilation – a summary report of IEA Annex VIII.
Technical Note AIVC 23. Berkshire, UK: Air Infiltration and ventilation Centre.
[15] Pustayová H. Evaluation of energy performance
and thermal comfort in the dwelling buildings in process of refurbishment,
Doctoral thesis, 2013.
[16] Dahlsveen, T., Petráš, D. Energy
audit of buildings. Bratislava: Jaga GROUP, 2005
[17] EN 15316-3.1 Heating systems in buildings –
Method for calculation of system energy requirements and system efficiencies –
Part 3.1: Domestic hot water systems, characterisation of needs
[18] Pustayová H., Petráš, D.Thermal Environment in Panel
Residential Buildings after Refurbishment. In ASHRAE OAQ 2013
: Environmental Health in Low Energy Buildings. Vancouver,
15.-18.10.2013. [b.m.] : [b.n.], 2013, s.491–497.
[19] Pustayová H., Petráš, D. Thermal comfort in dwelling buildings after
refurbishment. In INDOOR AIR 2014: proceedings of the 13th International
Conference on Indoor Air Quality and Climate, Hong Kong, China, 7.–12. 7. 2014. 1. vyd. Pokfulam: The University of Hong
Kong, 2014, S. 351–358. ISBN 978-962-85138-6-4.
Follow us on social media accounts to stay up to date with REHVA actualities
0