Stay Informed
Follow us on social media accounts to stay up to date with REHVA actualities

The
perspective of a consulting and engineering firm is providing IAQ consulting,
ventilation system design, implementation of systems and their monitoring. This
article is aimed at the practitioner and operator.
Four years
ago, a client requested the ability to continuously monitor their air quality
after we had installed an office-wide filtration system. After a market search
failed to yield suitable systems that could measure PM2.5 levels and report
over the internet, we had no choice but to create our own monitor, one of the
first of its type for non-industrial use in China. Less than a month after we
installed the monitors, Shanghai experienced some of the highest levels of
pollution ever recorded locally (over 1800% higher than the WHO 24-hour health
standard). The monitoring system showed that despite the high outdoor levels,
the filtration system achieved 93% average reduction with a healthy level
inside. Instead of having to respond to employees’ panic and absenteeism, our
client won staff trust and scored a PR coup for employees’ care and wellness. Since
then, we have sought to integrate monitoring into schools, offices, and
buildings, and currently oversee more than 3000 monitors streaming live data
over a cloud monitoring network.
China is an
ideal proving ground to acid test sensors and monitors. The frequent high
levels of pollution outdoors paired with a cultural preference for natural
ventilation provide challenging requirements. We often find that sensors
created in North America or Europe fail quickly in China, and perhaps, not
unsurprisingly, most of our preferred technology is domestically produced. Against
this backdrop, we have seen very fast growth in the adoption of monitors for a
number of reasons.
1. Monitors
are critical for developing recognition of an indoor air quality (IAQ) problem,
which then drives improvement. Traditionally, facility managers or building
owners had to commission long and in-depth audits with handheld particle
counters to determine whether there was a problem. However, today, continuous monitors
make it possible to quickly, inexpensively, and meaningfully depict the health performance
of a space.
2. Moore’s
Law – sensors have come way down in price while increasing in performance. There are superior monitors today
at, approximately, one third of the cost compared to those provided only two
years ago.
3. There
is growing recognition that monitoring is critical to validate performance. In China, the phrase “PM2.5” was
the fourth most searched term on the internet (per Baidu.com) in 2015. Visitors
entering elevators in the popular SOHO office complexes have a full colour
display showing outdoor versus indoor air quality readings. With the easy
availability of inexpensive consumer grade monitors (as low as ~USD40), it is
easy and natural for employees and tenants to test out their homes and offices.
If they discover problems, they will usually share the information on social
media or else challenge their managers, facilities managers, or operations
teams. This can either be a PR nightmare or, as in the case of our first
monitoring client, a marketing, selling or recruiting point.
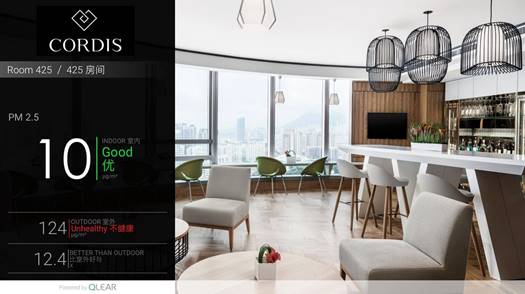
Figure 1.
Indoor air quality monitoring data screenshots as displayed in a hotel public
spaces.
4. Monitoring
data enables self-auditing and green building certification performance
validation. Most
sophisticated clients want to show the Return of Investments (ROI) on projects
to justify their investment. They may also want to keep their building or
office space performing at a high level over time. The addition of furnishings,
increase of headcount density, maintenance, outdoor air infiltration and
occupant activity all are factors that impact air quality after commissioning. An
unnoticed side effect of air quality monitoring is a mind shift in involving
the facilities managers and operations team in the “care and feeding” of their
indoor environment, because they have a feedback loop now which allows them –
and other stakeholders – to view cause and effect.
5. Monitoring
enables automation. In the past, we used to design and implement solutions for clients. We,
then, would train teams on how and when to operate the systems. Typically, a
unit is only considered successfully commissioned if it achieves over 95%
single pass reduction from the outlet vs. inlet readings and either below PM 2.5
of 35 μg/m³ over a 24 hours’ average, or greater than 90%
ambient room reduction during the same period. However, we found that in
reality, once we left, results would often degrade due to:
a. Improper
system operations – speed, on/off, filter maintenance
b. Failure
to control infiltration of outdoor air, or;
c. Negative
pressurization bringing in unfiltered outdoor makeup air
Training helps, but it is very difficult
to overcome ingrained habits such as opening the windows for “fresh air” during
cleaning or out of habit. Operations staff also frequently turn over, resulting
in a new crop of untrained personnel. Experience has shown that the best answer
is to take the operator out of the equation, using automation software powered
with live readings to govern filtration and ventilation system operation
“on-demand” only when needed. Automation systems should generally also have a
scheduling system to differentiate between working and non-working (or
non-occupied) hours. Not only does this ensure consistent performance, but, such
systems can also reduce energy usage up to 90% (compared to continuous
operation).
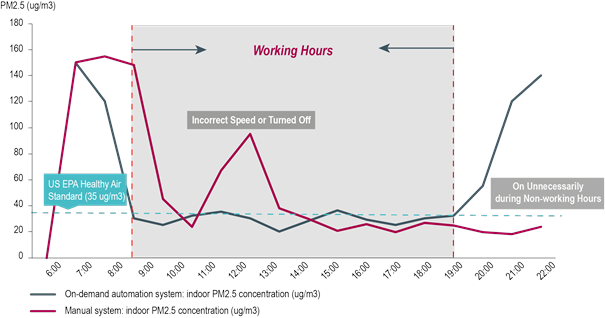
Figure 2.
On-demand Automation vs. Manual Operation (µg/m³ equals μg/m³). [Source:
“Every breath we take– transforming the health of China’s office space,” JLL
& PureLiving Research Report, December 2015.]
One of the
most frequent questions we are asked is “How do I select a monitor?” After all,
monitors today may cost between $35 to more than $5000.
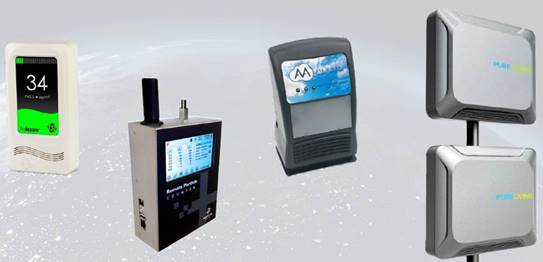
Figure 3.
Various types of continuous monitoring equipment.
Typically,
we guide monitor selection with a few considerations:
1. Pick
a monitor based on the sensors needed, the criticality of performance, and how
challenging the environment is. These parameters are the most important in IAQ
monitoring:
IAQ Parameter | Common Sensor Technologies | Recommended Measurement Range (Grade B) | Selection Notes |
Particulate Matter (PM) | Optical particle counter (OPC) | 0–300 µg/m³ | Sensors should be able to provide particle count,
not just mass concentration. Critical considerations: humidity compensation,
stability, repeatability, accuracy over the ranges likely to be encountered. |
Carbon Dioxide (CO2) | NDIR | 0–2000 ppm | CO2 indicates the
“quality” of ventilation and is possibly the most important IAQ parameter. Select
sensors that have auto-zeroing features and that can be field-replaceable. |
Total Volatile Organic Compounds (TVOC) | Metal Oxide Sensors (MOS) Photoionization Detector (PID) | 0.15–2.00 mg/m³ | Both MOS and PID sensors are indicative only and
used mainly to show relative change. They will not usually match lab testing.
High chemical levels will also require recalibration. |
Temperature | Thermocouples; Resistive Temperature Devices (RTDs);
Silicon diodes | 0–50°C | Many inexperienced manufacturers or first generation
monitors suffer from inaccuracy due to heat generated from nearby components
on same PCB. |
Relative Humidity | Capacitive | 20–90% | Generally, field-replaceable, important to measure
due to impact of humidity on measurements of other parameters. |
Formaldehyde | Colormetric, electrochemical; chemical | 0.03–0.3 mg/m³ | Currently, there are no real-time technologies known
to the author that reliably match laboratory HPLC analysis. Avoid. |
2. “Paper specs” are not a good
indicator of performance. Often, sensor capabilities listed in technical or
marketing data sheets are used to compare and select sensors, even by inexperienced
monitor manufacturers. However, sensors are impacted by design (i.e. sensor
proximity on a Printed Circuit Board may lead to elevated temperature readings
and premature failure.) Sensors often also vary widely in terms of long-term
stability. Therefore, monitors must be either performance tested by the end
user’s representative over time or by a reputable multi-brand dealer.
3. Realistic expectations of accuracy. Instead
of looking for accuracy that is close to the reference source, evaluators
should test by batches of at least 4 units and look for repeatability of
readings and fit to the reference monitor’s response curve. This indicates
manufacturing and sensor quality. Accuracy also needs to be evaluated over a
wide range, not just a single reading. Cheaper sensors may match a reference
method within a common range, but not at low or high ranges.
4. RESET™ monitoring standards are key
to identifying the difference between good and poor sensors. Created in China
in 2011 and adopted by companies across the world, RESET™ is a healthy building
standard for indoor air quality built around continuous monitoring data. In
addition to whole building and interiors certifications, RESET™ also certifies
monitoring hardware with a set of requirements that categorize monitor quality
into three groups: A for calibration-grade, B for commercial-grade, and C for
consumer-grade. RESET™ includes requirements that one would not normally
consider such as a data buffer so that in case communications fails, data will
still be stored.
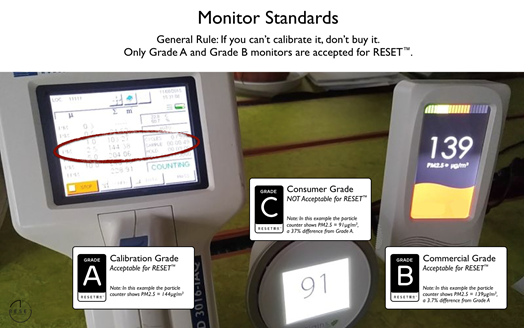
Figure 4.
Varying accuracy of three monitors show the difference between monitor quality
grades. Latest RESET™ standards are here:http://reset.build/resources/RESET_Accredited_Air_Monitor_Requirements
5. Costs
·
Initial.
Monitors meeting RESET™ standards typically cost about $100–300 for Grade C
(Consumer-grade) monitors, about $600–1400 for Grade B (Commercial-grade)
monitors, and upwards of $3000 for Grade A (Calibration-grade). Costs vary
depending on number of sensors, convenience features, and brand.
·
Maintenance.
Annual or semi-annual calibration is critical for maintaining accuracy,
particularly in polluted environments and is generally mandatory for
recertification. Generally, annual calibration and maintenance costs are
typically 10-20% of initial cost.
·
Software.
Most professional software is on a subscription basis and can be paired with
different hardware. Annual costs may be free for limited basic versions or
$100-300 per monitor per year depending on total number of monitors and the
sophistication of the software.
·
Hosting
and connectivity. If privacy is a concern, local hosts and networking may be
required, but in most cases, monitors simply need to connect to the internet.
Initial installation can be done by third parties or DIY.
·
Leasing
options. Increasingly, service providers are offering “pay-as-you-go”
monitoring packages that include hardware, calibration, cloud-ware, and support
on an annual basis. This way, hassle is minimized and technology is
future-proofed.
Deployment
location, choice of communications protocols, power supplies, should be
carefully planned to ensure representative data – or data at all – is received
for analysis.
1. Connectivity. The ability for the monitor to
transmit data is a major source of problems if not carefully considered when
monitors are selected and deployed. IT departments must be involved early on or
can pose challenges later.
Communications Type | Pros | Cons |
Bluetooth | Useful for portable hand-carried or wearable
monitors, but not fixed ones; useful if application requires frequent
communications with mobile phones | Very limited range; pairing problems; Bluetooth is
still not a universal standard |
Wifi | Ubiquitous in most places; if not many monitors,
easy to set up a dedicated “hotspot” style Wi-Fi router. Mainly useful in
residential or small business and non-critical sites | Can be unstable; routers settings or passwords often
changed due to business process; some monitor chipsets cannot handle 5.0 GHz
bands; most monitors cannot handle username login systems that businesses
often use |
GPRS (mobile SIM card) | Can be used anywhere there is mobile signal; can be
used to augment gaps; separate GPRS modem may be more acceptable to some
security requirements than piggybacking on inter/intranet | Cell coverage can be spotty and change over time;
must remember to keep subscription paid; cost of GPRS modem; must check
compatibility of network with monitor’s SIM card module |
Zigbee | Longer distance than Wi-Fi, penetrates walls and
solid materials better | Requires “hub and spoke” setup; ZigBee router is
cost prohibitive if just several monitors; not very popular with monitor
suppliers |
LAN (RJ-45) | Very stable; fewest chances of connectivity problems | Some IT departments and business rules don’t allow
third party devices to get on network; physical cabling needed |
Coax/analog | Similar to LAN; very stable; good for hotels or
buildings; inexpensive | Generally, only available during construction (or
requires opening up walls); less common |
2. How many monitors are
needed?
Monitors read only the nearby air quality. Therefore, the appropriate number of
monitors depends on how many representative environments are in a space. A
small 500 m² office with staff area, conference rooms, canteen, and lab,
for instance, may need four monitors, while a 2000 m² factory floor with
the same equipment and ventilation system may only need two. In a mixed-use
office environment, the general rule of thumb is about one per
500 m². Building
standards and certification programs such as RESET™ may have their own
requirements. Also, sensitive populations may expect monitoring around them.
Generally, focus on staff areas.
3. Location
and placement
·
Height.
Generally, in the breathing zone – 1–2 m high above the floor is ideal.
However, if there are children (i.e. school) or theft/interference is an issue,
mounting monitors above head height or in lockable boxes are options.
·
What
to avoid. Monitors should not be located near windows or areas of outdoor air
intrusion, near HVAC supply ducts (unless the supply air is being monitored),
or any sources of unusual IAQ pollutants. If possible, a site survey taking
handheld readings to check the representativeness of planned monitoring
locations should be done ahead of time.
·
Tables
vs wall mounted. If possible, wall mounted is preferable, as occupants are
major sources of IAQ pollution and can particularly impact CO2 and VOC readings. Wall mounts do require some
installation (see photos) but also are less likely to be disrupted, unplugged,
or moved. For new construction, be aware that newly painted walls can impact
TVOC readings.
·
Ducts.
Generally, we are most interested in measuring the actual ambient air that
occupants are breathing and place the monitors in the breathing zone. However,
if our purpose is to measure the building’s own ventilation system or
filtration systems before the occupants’ behaviour or indoor sources filter or
contaminate this air, we want to measure the air being supplied by the ducts.
The use of a duct box that penetrates the duct as well as secures the monitor,
can achieve this. Tip: monitoring outdoor air supply ducts is a convenient way
to measure outdoor air quality without needing an outdoor “hardened” monitor to
be exposed to the elements.
·
Documentation.
It is very important to create – and maintain – the location of monitors on a
floorplan or BIM (building information management) system plan. Monitors have a
way of moving and accountability can be a problem over time, especially with
staff turnover.
4. Power options. Corded power packs, while
convenient, are likely to be unplugged, so DC from within the walls is
preferred. If power cords must be used, select outlets that are less utilized,
and mark the power plugs with signs saying, “Do not unplug”, etc. Some monitors
have a battery option, which can be convenient for validation or calibration
against fresh air.
5. Validation. Monitors must be checked against reference
machines, preferably before deployment and then once again on-site.
Documentation should be kept in case of challenge. Outdoor air may be used as a
field expedient check for CO2 and TVOC. Be careful
about comparing spot PM readings against published PM readings, which are
typically hourly averages and, also, not co-located. If many monitors are being
deployed (typically more than 10), it is often advisable to also deploy a high
quality handheld reference machine or an “alpha class” monitor that can be used
as a comparison.
6. Signage. As previously mentioned, occupants
may often impact monitoring, either by moving the monitors, unplugging them,
breathing on them, doing construction work near them, or even stealing them. If
the monitors cannot be deployed in a secure manner or out of reach, clear dual
language signage that says, “Ongoing monitoring, please do not touch or unplug”
is necessary.
7. Renovation or other
indoor sources. If
possible, monitors should not be installed until just before occupation. Since
monitors can be a useful tool in gauging the readiness of indoor air for
move-in, they can be set up before, but never should be exposed to construction
activity such as painting, which can damage or destroy sensitive sensors. If
they must be installed during construction, they should be bagged up in
airtight bags and secured to avoid loss.
Sensor data
is of little value, especially to non-experts. Data needs to be aggregated, made
visually meaningful, and interpreted to drive action. In the old days, software
was like cleanroom software – unattractive, purpose-built, not flexible, and local
to the building. Today, the software is built on the cloud to provide remote
access, be interoperable, create easier interoperability, allow benchmarking
and trend analysis, and enable automation. However, privacy issues may impact
this decision. Although the focus is currently on air, software platforms are
enabling us to increasingly include other environmental parameters, such as
light and sound. Due to space constraints, software, visualization, and data
analysis will be the subject of a follow-on article.
Continuous
air quality monitoring is a critical component of effective IAQ systems, from
assessing the baseline condition to optimizing settings to maintenance. The
monitoring hardware industry is growing rapidly, but “soft knowledge” – selecting
the right hardware, deploying monitors correctly, and getting maximum value out
of the data with a cloud analysis platform and automation software – will need
attention in order to actually achieve results.
Follow us on social media accounts to stay up to date with REHVA actualities
0