Stay Informed
Follow us on social media accounts to stay up to date with REHVA actualities

Building materials and systems, and the
activities carried out in them, can be a source of contaminants that are
harmful to human health. For example, there is evidence that some of the
materials used to construct and furnish buildings emit harmful gases and
harbour biological organisms. Unvented combustion processes for space and food
heating emit gaseous and particulate contaminants and can be a source of
moisture that is a primary driver of biological growth. Human activities, such
as cooking and vacuum cleaning, also emit particulates, cleaning and
deodorizing products emit gaseous contaminants and particulates, and smoking
emits over 7000 different compounds of which many are harmful (CfDC, 2010). Pets
harbour and transport biological contaminants, and can themselves be allergens.
People and pets also emit gaseous bio-effluents that are disagreeable to smell,
and harbour pathogens that produce disease. These examples show the many
potential hazards and contaminant sources in buildings, for which there are
multiple exposure pathways, and not all of them are airborne.
The measurement of airborne contaminant
concentrations is generally a task carried out by experts, and reported in
academic journals and technical reports. The presence and concentrations of contaminants
is often measured without careful consideration of their relevance, and those
measured may not be the most prolific or the most harmful. Some contaminants are
inappropriately grouped together; for example, there are over 1 million volatile
organic compounds (VOCs) and their toxicities are generally unknown, yet they
are sometimes reported as single values and referred to as total
VOCs (TVOC). Carbon dioxide (CO2) is often
used as an indicator of poor IAQ, although it does not negatively affect the
health of occupants in the concentrations usually found in buildings, it is a
marker of human bio-effluents. Its presence is a function of occupancy, occupant
activity, gender, age and physiology, combustion, and transport from elsewhere.
Without an understanding of these variables, indoor CO2
cannot be used to assess indoor air quality or ventilation. And, it can never
be used to indicate the presence of other important indoor contaminants, such
as formaldehyde emitted from building materials, whose emission is unrelated to
CO2 concentration.
However, existing measurements of contaminants,
whose type and toxicity are known, still give cause for concern (Logue et al., 2011). They could negatively affect the health of
occupants of any building they were found in and, when extrapolated to larger
building stocks, could adversely affect healthcare systems and economies.
Ventilation is the primary method of contaminant
dilution and removal in buildings. Ventilation standards generally agree that
indoor air should be perceived as fresh and pleasant by a significant majority
of occupants and so they set a baseline ventilation requirement of around 8 l/s
per person to dilute bio-effluent odours to an acceptable
level for anyone who enters an occupied room from relatively clean air
(Persily, 2015). They then attempt to account for other contaminants, such as
building materials and furnishings, by increasing the baseline rate to around 10 l/s
per person, although the increase is not based on specific contaminants
(Persily, 2006). Ventilation rates in national standards around the world
differ by up to 4 times, and their origins aren’t always known or documented (Borsboom,
2017). Comparisons of measured ventilation rates against those prescribed by
national standards suggest that there is also a widespread inability to
implement them effectively in many building types (Persily, 2016), such as
houses (Dimitroulopoulou, 2009) and schools (Chatzidiakou et
al., 2012). This suggests that they are smelly, but they could be unhealthy
too.
There are limits to the ability of ventilation
to mitigate these contaminant exposures. Occupants are exposed to contaminants via
three mechanisms: inhalation, dermal absorption (through the skin), and ingestion.
For example, infections are carried by fomites, such as skin cells, hair,
clothes, bedding, utensils, and furniture, and are spread by all three
mechanisms. The pumping action of doors, the movement of bedding, and the
action of sitting on soft furniture can all re-suspend fine particles that can
be inhaled into the lower respiratory tract. Large droplets produced by
breathing, talking, sneezing, and coughing contain mucus, saliva, cells, and
infectious agents that are transmitted over distances of less than 1 m.
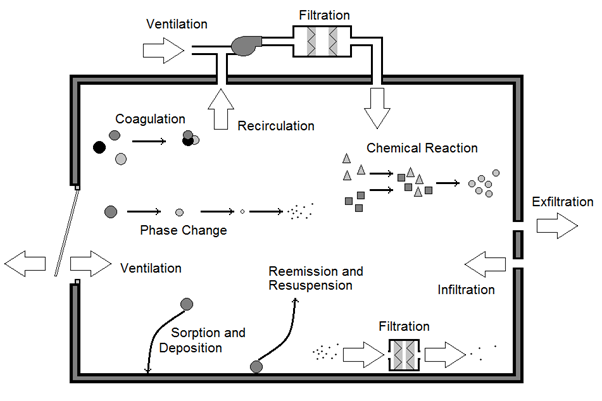
Ventilation
Mechanisms and Pollutant Behaviours Indoors.
Such particles can be inhaled into the upper
respiratory tract (Atkinson et al., 2009). Semi-volatile
organic compounds (SVOCs), such as those emitted by dry cleaned clothing or
flame retardants, are absorbed through the skin from clothing and can be sorbed
by food and ingested (Weschler & Nazaroff, 2008). Organic allergens, such
as those produced by dust mites, are contained in bedding, carpets, and soft
furnishings and are inhaled (Biddulph et al., 2007). The
complexity of such exposures shows that ventilation is an insufficient
remediation measure on its own and inherently doesn’t deliver acceptable IAQ,
especially when contaminant sources are not reduced or eliminated.
By the mid-1800s, a pioneer of modern hygiene
and environmental science, Max Joseph von Pettenkofer, had identified source control as the most effective first step towards acceptable
IAQ.

“If there
is a pile of manure in a space, do not try to remove the odour by ventilation.
Remove the pile of manure.” Attributed to Max Von Pettenkofer. Source Control (Fanger, 2006).
When source control is impossible, then local exhaust
ventilation, such as a kitchen cooker hood, is effective in removing contaminants
before they are able to mix in a space.
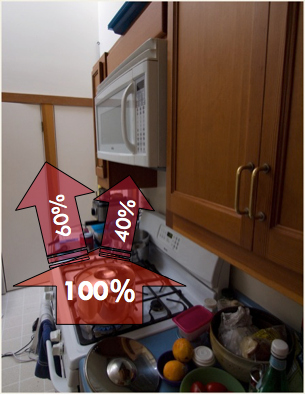
Capture efficiency of a range hood commonly
found in the U.S.A (Image courtesy of Iain Walker at the Lawrence Berkeley National
Laboratory).
These devices are imperfect, and so it is still
necessary to dilute well mixed contaminants using ventilation, or to remove contaminants
using an air cleaner. These devices can be a useful alternative to ventilation,
but they have energy and financial penalties, as well as performance
limitations. There is also evidence that they can reemit collected particulates,
and serve as sites for microbiological growth or chemical reactions that create
secondary contaminants, such as ozone, formaldehyde, and other VOCs (Siegel,
2016). There is a pressing need for standardization and performance data for these
devices.
Some contaminants, such as carbon monoxide,
are harmful when the exposure is acute and so sensors and alarms can be useful
for monitoring indoor levels. However, many others require exposures to be
chronic before negative health effects occur. Traditionally, CO2 has been used as a marker for IAQ although its
limitations have already been highlighted. Therefore, devices that are capable
of indicating the presence of specific contaminants should be used, but given
the plethora of possible contaminants it is not always clear which should be measured
first, and what thresholds the measurements should be compared against. To do
this, a system of measurement is required.
An air quality metric should identify when the
quality of indoor air is unacceptable and should be based on its effects on
human health and comfort, acknowledging that they may not be immediate.
One method of analysis is to ask occupants to personally
assess IAQ. The human nose is as sensitive to some gaseous contaminants as
chemical analyses and using it indicates occupant preference and ensures that
people are the focus of an assessment. Perceived air quality (PAQ) is the basis
of most ventilation standards and is used to assess indoor odours (ISO, 2014) and
air quality in buildings (Wargocki et al., 2004).
However, its very subjectivity, the inability of the nose to smell all harmful contaminants
(CO is odourless, for example), its high dependence on temperature and relative
humidity (Fang et al., 1998), and the propensity of
people to adapt to malodours after only a few minutes (Berg-Munch et al., 1986), are acknowledged by some as fundamental concerns.
A second method might be to identify
properties of a building that are known to affect IAQ directly, for example using
a tick-box approach. Each feature could be weighted according to their hazard
and aggregated to produce a single metric. This method could be used to develop
a third-party rating system, similar to many existing energy rating schemes,
and should be helpful to someone who is particularly sensitive to specific contaminants
in choosing a house to live in.
To obtain a comprehensive picture of the IAQ in
a building it would be necessary to measure a range of contaminants, but their
individual concentrations may be incomparable because of different health
impacts and time scales, and units; for example, radon (Bq.m-3) and particulate matter (μg.m-3). One approach is to convert the individual
contaminant concentrations into sub-indices, which may be a function of their health
risks, before they are aggregated into a single index. However, the summing of sub-indices
can lead to situations where they are all under individual health thresholds, but
the final index shows exceedance. Conversely, the averaging of sub-indices can
lead to a final index that indicates acceptable IAQ when one or more sub-indices
are greater than their individual thresholds. One solution is to use the
maximum of all sub-indices as the final index (Sharma and Bhattacharya, 2012),
but this does not indicate overall IAQ. Other methods weight the sub-indices
before aggregation (Abadie et al., 2016).
Exposure limit values (ELV) are used in occupational
environments to prevent or reduce risks to health from hazards, such as
vibrations (HSE, 2008), by setting a maximum quantity experienced per person per
day. This principle could be applied when measuring the concentrations of a
range of contaminants in a building. Here, the ratios of their maximum
concentrations to their respective ELV concentrations give a quick indication
of risk, where a ratio ![]() 1 might be acceptable but one approaching or exceeding unity may be
problematic.
1 might be acceptable but one approaching or exceeding unity may be
problematic.
A problem with IAQ indices and ELVs is that it
isn’t clear how a change to either metric, say by 10%, would affect occupant
health and comfort. Here, an indication of the relationship between exposure
and health consequences is required.
The disability adjusted life year (DALY) is a
measure of time where a value of unity is one year of healthy
life lost to some disease or injury. DALYs are calculated as the sum of years
of life lost to premature mortality and morbidity in a population for some
negative health effect. Disability is weighted by its effect on person’s life
in general, and so can account for mental illness. In the case of IAQ, the
burden of disease is a measurement of the difference between the current health
status of a population of building occupants and an ideal situation where they all
live into old age, free of disease and disability (WHO, 2009). The DALY has
been used by the AIVC (2016) to prioritize indoor contaminants found in houses for
mitigation.
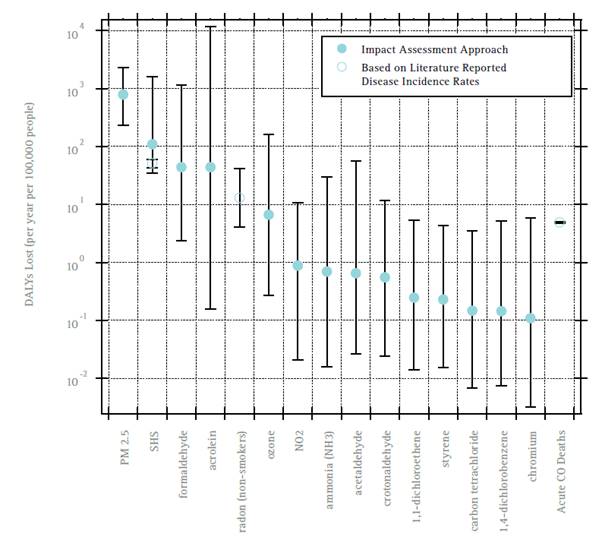
Estimated population averaged annual cost, in
DALYs, of chronic air contaminant inhalation in U.S. residences (AIVC, 2016).
For a metric to be useful and accepted as best practice, it must be robust and trusted. Unreliable
evidence can be disputed and could lead to litigation. A metric must have robust
technical specifications, prescribing the methods of measurement and
calculation. It must clearly identify measurement locations, device types,
tolerances, calibration intervals, and measurer and analyst competences. This
will aid consistency, and increase the likelihood that two different assessors
surveying the same building arrive at the same metric score.
Metrics should not be a barrier to innovation,
and so it is important that methods of pollution control are not prescribed. This
follows the principles of performance-based building design,
which focus on the end result and not on the means of achieving it. Any remediation
measure should consider the need to simultaneously provide acceptable IAQ and
energy use reduction, and so they should only be used when they are effective
in achieving both ends. This requires good sensing and control devices whose
performance is understood.
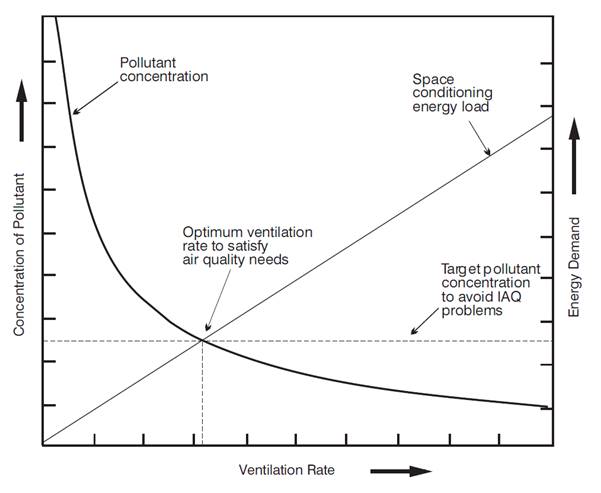
Controlling the Dominant Pollutant (AIVC,
1996).
When non-compliance is identified, then
pre-defined sanctions must be imposed. It is also important to define who is
liable and the actions in cases of non-compliance. To develop and apply
metrics, there is a clear need for resources, such as technical, legal, and
administrative staff, and for equipment. Towards this end, it is fundamentally
important to actively involve stakeholders so that they ensure they meet any IAQ
metric required in their building and support the enforcement of infringements.
There are many hurdles to overcome, but the
AIVC has begun to discuss key issues and challenge preliminary ideas. It will
continue to research IAQ metrics and to give guidance on their development. The
consideration of IAQ and its effects on occupant health and comfort will lead
to a new paradigm in building standards and guidelines, moving them beyond the
control of odour towards the provision of indoor environments that consider
occupant health. ASHRAE 62.2 (ASHRAE, 2016) has begun this transition, and as
other standards join, they will begin to have a tangible effect on people,
healthcare systems, and economies.
The author is grateful to Max Sherman, Andrew
Persily, Iain Walker, and Rémi Carrié for their comments on this article.
Abadie M, Wargocki P, Rode C. IEA EBC
Annex 68 - Indoor Air Quality Design and Control in Low Energy Residential
Buildings – Setting the Metrics. The 14th
international conference of Indoor Air Quality and Climate. Ghent, Belgium.
July 3–8, 2016.
AIVC. Is ventilation the answer to
indoor air quality control in buildings? Do we need performance-based
approaches? AIVC Workshop held in Brussels, Belgium. 14th–15th March, 2017.
AIVC. TN 68: Residential Ventilation
and Health. Air Infiltration and Ventilation Centre, Brussels, Belgium; 2016.
AIVC. GU03: A Guide to Energy
Efficient Ventilation. Brussels, Belgium: Air Infiltration and Ventilation
Centre; 1996.
ASHRAE. ANSI/ASHRAE Standard 62.2 -
Ventilation and Acceptable Indoor Air Quality in Residential Buildings. 2016.
Atkinson
J, Chartier Y, Pessoa-Silva CL, Jensen P, Li Y, Seto W-H. Natural
Ventilation for Infection Control in Health-Care Settings. World Health
Organization; 2009.
Berg-Munch
B, Clausen G, Fanger PO. Ventilation requirements for the
control of body odor in spaces occupied by women. Environment International. 1986;
12:195-9.
Biddulph, P et al.
Predicting the population dynamics of the house dust mite Dermatophagoides
pteronyssinus (Acari: Pyroglyphidae) in response to a constant hygrothermal
environment using a model of the mite life cycle. Experimental and Applied
Acarology. 2007; 41:61-86.
Borsboom, W. Rational Behind Current
Ventilation Airflow Rates. Presentation to AIVC
Workshop: Is ventilation the answer to indoor air quality control in buildings?
Do we need performance-based approaches? Brussels, Belgium. 14th March, 2017.
CfDC. How Tobacco Smoke Causes
Disease. The Biology and Behavioral Basis for Smoking-Attributable Disease. Centers
for Disease Control. Atlanta, Georgia, U.S.A.: U.S. Public Health Service;
2010.
Chatzidiakou L, Mumovic D, Summerfield
AJ. What do we know about indoor air quality in school classrooms? A critical
review of the literature. Intelligent Buildings International. 2012; 4:228-59.
Dimitroulopoulou
C. Ventilation in European dwellings: A review. Building and Environment. 2012;
47:109-25.
Fang
L, Clausen G, Fanger PO. Impact of Temperature and Humidity on the Perception
of Indoor Air Quality. Indoor Air. 1998; 8:80-90.
Fanger
PO. What is IAQ? Indoor Air. 2006; 16:328-34.
HSE.
Hand-arm vibration. - The Control of Vibration at Work Regulations 2005. Health
and Safety Executive. ISBN 0-7176-6125-3. Richmond, UK. 2008.
ISO.
16000-30 Indoor air: Sensory testing of indoor air. International Standards
Organization. 2014.
Logue
JM, McKone TE, Sherman MH, Singer BC. Hazard assessment of chemical air
contaminants measured in residences. Indoor Air. 2011; 21:92-109.
Persily
A. Challenges in developing ventilation and indoor air quality standards: The
story of ASHRAE Standard 62. Building and Environment. 2015; 91:61-69.
Persily
A. Field measurement of ventilation rates. Indoor Air. 2016; 26:97-111.
Persily
A. What We Think We Know about Ventilation. International Journal of
Ventilation. 2006; 5:275-90.
Siegel
JA. Primary and secondary consequences of indoor air cleaners. Indoor Air. 2016;
26:88-96.
Sharma
M, Bhattacharya A. National Air Quality Index. Central Pollution Control Board.
Ministry of Environment, Forests, & Climate Change; 2012.
Wargocki
P, Fanger PO, Krupicz P, Szczecinski A. Sensory pollution loads in six office
buildings and a department store. Energy and Buildings. 2004; 36:995-1001.
Wei
W, Ramalho O, Mandin C. Indoor air quality requirements in green building
certifications. Building and Environment. 2015; 92:10-9.
Weschler
CJ, Nazaroff WW. Semivolatile organic compounds in indoor environments. Atmospheric Environment. 2008; 42:9018-40.
Follow us on social media accounts to stay up to date with REHVA actualities
0