


Stay Informed
Follow us on social media accounts to stay up to date with REHVA actualities
|
|
|
Imrich Sánka
MSc.Slovak University of Technology in Bratislava,
Faculty of Civil Engineering, Department of Building Servicesimrich.sanka@stuba.sk | Veronika
Földváry PhD.,Slovak University of Technology in Bratislava,
Faculty of Civil Engineering, Department of Building Services | Prof. Dušan
Petráš PhD. Eur. Ing.Slovak University of Technology in Bratislava,
Faculty of Civil Engineering, Department of Building Services |
Most of the
residential buildings in Slovakia that were built in the 20th century do not
satisfy the current requirements for energy efficiency presented in the
national building code. Nationwide remedial measures have been taken to improve
the energy efficiency of these buildings and reduce their energy use (Földváry
V., Bekö G., Petráš D. (2014)). However, since the impact of these measures on
indoor air quality is rarely considered, they often compromise indoor air
quality due to the decreased ventilation and infiltration rate.
The highest
development in the housing stock, as a result of economic changes and
population growth, has been recognized as taking place during the second half
of the 20th century (Jurelionis A., Seduikyte
L. (2010)). The majority of housing in Central and Eastern Europe was
constructed from panel technology. The degradation of its quality, which has
led to its renovation, has become one of the most important measures from an
energy-saving point of view.
The aim of
the study was to evaluate the impact of basic energy-saving measures on indoor
air quality in a typical high-rise residential building built in the 1960s in
Slovakia.
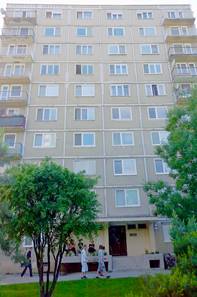
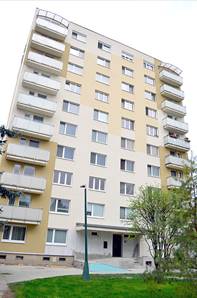
The residential building investigated (Figure 1) is located in Šamorín, Slovakia. It was built in 1964 from lightweight concrete panels. The building was naturally ventilated. Exhaust ventilation was only used in sanitary rooms, such as the bathrooms and toilets. Renovation of the building was carried out in 2015 and included the following measures: insulation of the building envelope using polyethylene (80 mm), insulation of the roof using mineral wool (120 mm) and hydraulic balancing of the heating system. New plastic frame windows had already been installed over the last years in most of the apartments in the building.(Földváry V., Bekö G., Petráš D. (2015)).
|
|
Figure 1. The evaluated dwelling before and after
refurbishment. | |
Table 1. Heat transfer coefficients of the structures.
Structure | Heat transfer coefficient | Heat transfer coefficient | Area | Average heat transfer coefficient | Average heat transfer coefficient | Improvement of the heat transfer coefficient |
Ui [W/(m²K)] | Ui [W/(m²K)] | SUM Ai [m²] | Ui [W/(m²K)] | Ui [W/(m²K)] | [%] | |
External
wall 1 | 1,6 | 0,37 | 1766,85 | 1,49 | 0,35 | 76,50 |
External wall 2 | 1,59 | 0,36 | ||||
External
wall 3 | 0,49 | 0,23 | ||||
External wall 4 | 0,44 | 0,23 | ||||
Wall
of the machine room | 1,69 | 0,38 | ||||
Flat roof | 0,8 | 0,22 | 328,77 | 1,23 | 0,23 | 81,30 |
Flat
roof of the machine room | 1,93 | 0,27 | ||||
Ceiling above the basement | 0,88 | 0,33 | 338,77 | 0,88 | 0,34 | 61,40 |
Transparent
structures | 1,56 | 1,3 | 569,43 | 1,56 | 1,3 | 16,70 |
3013,82 | 1,439 | 0,544 | ||||
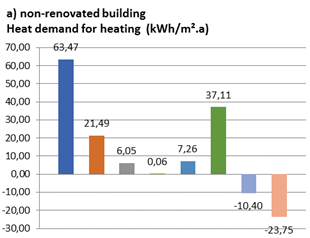
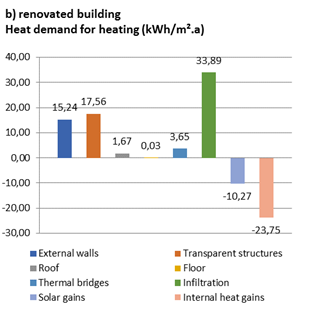
The heat demand was calculated for the non-renovated and renovated
condition. The highest energy-saving is provided by the thermal insulation of
the external walls. This can be explained with the large heat exchange surface
of the walls. On the Figure 2, is clearly indicated the heat demand for the
structures for square meter and the solar and heat gains for both types of
residential building. The figure shows that the heat demand for the insulated
part of the building significantly decreased and for the calculated air
exchange rate (AER) and gains remained the same.
|
|
Figure 2. Heat demand of the building (a-
non-renovated, b-renovated). |
The renovated and non-renovated residential building were classified into energy classes by the valid Slovak legislation: Decree of the Ministry of Transport, Construction and Regional Development No:300/2012.
The energy-saving measures mentioned above decreased the energy
consumption by 55%. In accordance to our law on energy efficiency of buildings,
the original dwelling belonged to the ‘E’ category (159 kWh/m²a), after
refurbishment to the ‘B’ category (74 kWh/m²a).
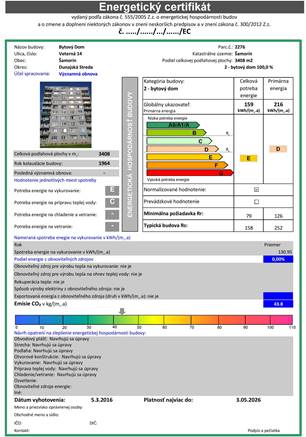
Figure 3. Energy
certificate of the non-renovated building.
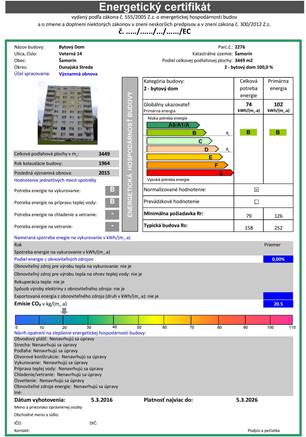
Figure 4. Energy
certificate of the renovated building.
The first round of the measurements was performed in January 2015 when the
building was still in its original condition, and the second round was
performed in January 2016 after energy saving-measures had been implemented.
Twenty apartments were selected across the residential building; they were
equally distributed on the lower, middle and highest storeys of the building.
The same apartments were investigated in both winter seasons over a period of
eight days (Földváry V. (2016); Bekö G., Földváry V., Langer S., Arrhenius K.
(2016)). The temperature, relative humidity, CO2 concentration, and
volatile organic compound concentration (TVOC) were measured in the bedrooms
(the TVOC concentration in the living rooms) of the apartments. HOBO U12-012
data loggers and CARBOCAP CO2 monitors (Figure 5) were used
for recording the temperature and CO2 concentration data.
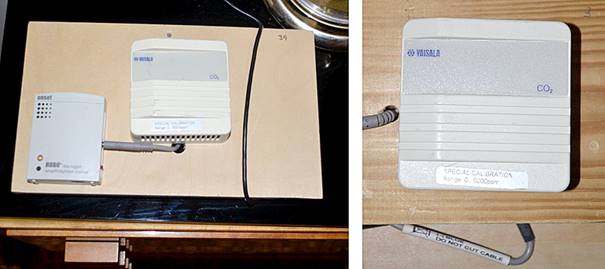
Figure 5. Hobo
data logger and Carbocap CO2 monitor (Sánka I., Földváry V., Petráš D.
(2016); Sánka I., Földváry V., Petráš D. (2017))
For the TVOC concentration Perkin-Elmer adsorption tubes (Figure 6) with 200
mg Tenax TA were used. The measurements were performed according to ISO
16017-2. All the devices were calibrated before the measurement campaign began.
The data were recorded at 5-minute intervals for eight days in each apartment.
The locations of the instruments were selected with respect to the limitations
of the carbon dioxide method (Földváry V., Bekö G., Petráš D. (2015))
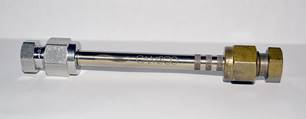
Figure 6. Perkin-Elmer
adsorption tube.
Each unit was placed at a sufficient distance from the windows and beds to
minimize the effect of the incoming fresh air or the effect of the sleeping
occupants. The space between the furniture and the room corners was avoided.
The CO2 concentration was used to calculate the air exchange
rate over eight nights in each bedroom. The occupants CO2 emission
rate was determined from their weight and height as set out in questionnaires
(Földváry V., Bekö G., Petráš D. (2015); Földváry V. (2016)).
The calculation of the air exchange rates was performed using the following
mass balance (Persily A. K. (1997)):
Ci(t) = (Co
− Ca) · e(−λ · ti) + Ca + (E ·103
λ ·VR · (1−e−λ · ti) )
Ci(t)= concentration at time t, ppm(V)
Co = concentration
in the beginning (at time t=0), ppm
Ca = outdoor
concentration, ppm
λ = air
exchange rate, 1/h
E = estimated
metabolic CO2 generation rate per person in the zone, h−1
VR = volume
of the room, m³
ti = time,
h
A questionnaire survey was used to determine the subjective evaluations of
the quality of the indoor environments. The questionnaire survey was carried
out along with the objective measurements. Two types of documents were prepared
(for the unrenovated and renovated building).
The questionnaire contained 6 main parts:
1. Basic
information about the occupants
2. The state
of the building
3. The
ventilation habits of the occupants
4. Sick
building syndrome symptoms
5. Perceived
air quality
6. Thermal
comfort
The results
of thermal comfort, the measured values of CO2, AER, and the TVOC parameters and
the questionnaire survey are as follows:
The
measured values of temperature and relative humidity are presented in the
following text.
From the
measured data is obvious that day and night average temperature was higher in
the renovated building than in the non-renovated (Figure 7,
Table 2).
Table 2. Indoor air temperature before and after renovation.
1) Before
renovation (N=20)
Time period | T [°C] | ||
Average | Minimum | Maximum | |
Day | 20,7 | 20,1 | 23,6 |
Night | 21,2 | 18,8 | 24,2 |
Whole
period | 20,9 | 18,7 | 23,9 |
2) After
renovation (N=20)
Time period | T [°C] | ||
Average | Minimum | Average | |
Day | 22,1 | 20,1 | 23,9 |
Night | 22,4 | 20,8 | 24,0 |
Whole
period | 22,2 | 20,6 | 24,0 |
The
relative humidity was very similar in both types of residential building (Figure 8,
Table 3).
Table 3. Relative humidity before and after renovation.
1) Before
renovation (N=20)
Time period | RH [%] | ||
Average | Minimum | Maximum | |
Day | 46,1 | 34,8 | 59,1 |
Night | 47,1 | 34,8 | 63,0 |
Whole
period | 46,2 | 34,5 | 60,8 |
2) After
renovation (N=20)
Time period | RH [%] | ||
Average | Minimum | Maximum | |
Day | 47,3 | 38,3 | 58,4 |
Night | 48,8 | 38,9 | 59,9 |
Whole
period | 47,9 | 38,6 | 59,1 |
Both
measured values fulfils the requirement of the Slovak standard STN EN 15 251(
T: T>20°C; T<24°C; RH: RH>30%; RH<70%).
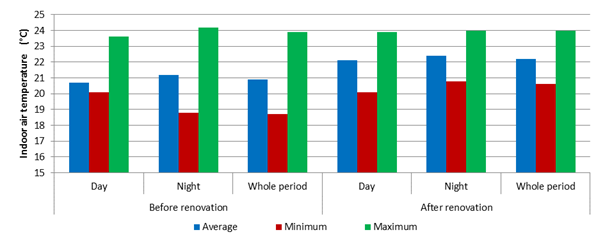
Figure 7. Average
temperatures in the apartments before and after complex renovation.
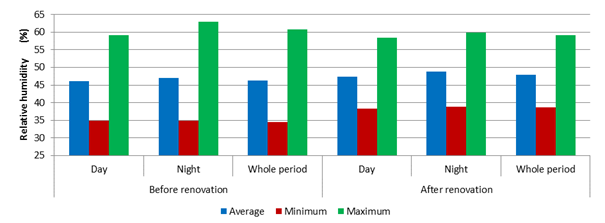
Figure 8. Average
relative humidity in the apartments before and after renovation.
The CO2 concentrations before and after the
renovation of the building are shown in Figure 9. Most of
the CO2
concentration data points were within the acceptable limit (green line) before
the renovation (blue line), while significantly higher concentrations were
measured after the renovation (red line). Table 4 and Figure 10 present
the descriptive statistics of the day and night-time CO2 concentrations before and after the
renovation of the residential building. The grand average was 1205 ppm,
and the median was 1190 ppm before the renovation.
After
implementing the energy-saving measures, the CO2 concentration visibly increased.
The mean was 1570 ppm, and the median was 1510 ppm. Table 5 shows
the percentages of the average day and night-time CO2 concentrations above four cut-off
values in the residential building before and after its renovation. A higher
number of the apartments exceeded 1500 ppm and the upper concentrations
during both the day and night-time after the renovation than before the
renovation.
The lower CO2 concentration before the renovation
resulted in higher AERs in the apartments (average 0.61 1/h). After the
renovation, the mean air exchange rate (0.44 1/h) dropped below the
recommended minimum (0.5 1/h) (Table 6 and Figure 11).
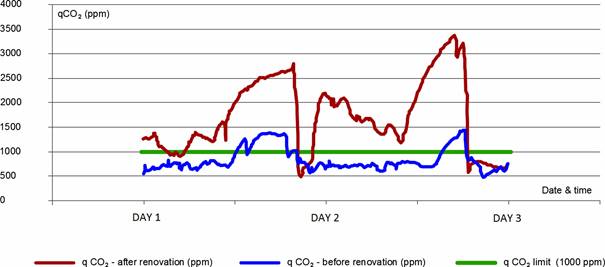
Figure 9. Example
of CO2
concentration in one selected apartment during two days out of the whole
measurement period before and after the renovation. (Sánka I., Földváry V.,
Petráš D. (2016); Sánka I., Földváry V., Petráš D. (2017))
Table 4. Day- and night-time CO2 concentrations
before and after renovation of the residential building. (Sánka
I., Földváry V., Petráš D. (2016); Sánka I., Földváry V., Petráš D. (2017))
1) Before
renovation (N=20)
Time period | CO2 (ppm) | |||
Average | Minimum | Maximum | Median | |
Day | 1040 | 595 | 1550 | 1030 |
Night | 1400 | 740 | 2665 | 1300 |
Whole period | 1205 | 660 | 2050 | 1190 |
2) After
renovation (N=20)
Time period | CO2 (ppm) | |||
Average | Minimum | Maximum | Median | |
Day | 1320 | 790 | 2210 | 1265 |
Night | 1925 | 865 | 3575 | 1825 |
Whole
period | 1570 | 870 | 2770 | 1510 |
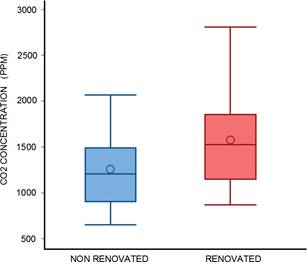
Figure 10.
CO2
concentration before and after renovation as a statistical output (Sánka I.,
Földváry V., Petráš D. (2016); Sánka I., Földváry V., Petráš D. (2017))
Table 5. The fractions of the
apartments where the average CO2 concentration exceeded
1000, 1500, 2000 and 2500 ppm during the day- and night-time. (Sánka I.,
Földváry V., Petráš D. (2016); Sánka I., Földváry V., Petráš D. (2017))
a) Before renovation (N=20)
Time period | Cut-off values [%] | |||
CO2>1000 (ppm) | CO2>1500 (ppm) | CO2>2000 (ppm) | CO2>2500 (ppm) | |
Day | 60 | 10 | 0 | 0 |
Night | 75 | 40 | 10 | 5 |
b) After
renovation (N=20)
Time period | Cut-off values [%] | |||
CO2>1000 (ppm) | CO2>1500 (ppm) | CO2>2000 (ppm) | CO2>2500 (ppm) | |
Day | 75 | 30 | 10 | 0 |
Night | 95 | 70 | 40 | 15 |
Table 6. AER before and after renovation (Sánka I., Földváry V., Petráš
D. (2016); Sánka I., Földváry V., Petráš D. (2017))
AER | Average | Minimum | Maximum | Median |
Before
renovation (N=20) | 0.61 | 0.32 | 1.15 | 0.59 |
After
renovation (N=20) | 0.44 | 0.21 | 0.76 | 0.45 |
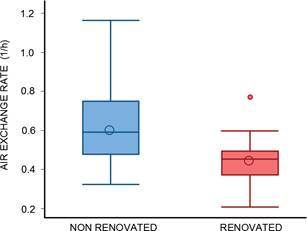
Figure 11.
Air exchange rate before and after renovation as a statistical output (Sánka
I., Földváry V., Petráš D. (2016); Sánka I., Földváry V., Petráš D. (2017))
In both
cases (before and after the renovation) the volatile organic compound (TVOC)
concentrations were above the maximum limit value (300 µg/m³) Even higher
concentrations were measured in the apartments after refurbishment (Table 7). In
some cases, concentrations of TVOC were measured as very high (>1000 µg/m³), which are illustrated by the green
dots on Figure 12. Table 8 contains
the percentages of the measured values exceeding the threshold values.
Table 7. TVOC concentration
before and after renovation.
TVOC concentration | Average | Minimum | Maximum |
Before renovation (N=20) | 569 µg/m³ | 179 µg/m³ | 1805 µg/m³ |
After renovation (N=20) | 773 µg/m³ | 185 µg/m³ | 2362 µg/m³ |
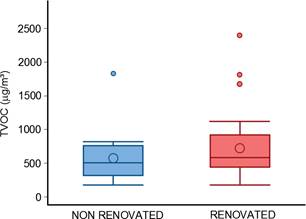
Figure 12.
TVOC concentration before and after renovation as a statistical output (Sánka I., Földváry V., (2017))
Table 8. TVOC concentration before and after renovation (Sánka I., Földváry V., (2017))
Limit values of TVOC concentration | Before renovation | After renovation |
TVOC
> 300 µg/m³ | 80% | 85% |
TVOC
> 500 µg/m³ | 50% | 60% |
TVOC
> 1000 µg/m³ | 5% | 25% |
TVOC
> 2000 µg/m³ | 0% | 5% |
The results
of the questionnaire survey are based on the responses of the occupants of the
evaluated residential building. The results below characterize the ventilation
habits of the occupants, the perceived air quality, and the acceptability of
the indoor air quality.
The
residents labelled the acceptability of the indoor air on a scale from −1
to +1. The following figure shows the acceptability of the indoor air quality
in the bedrooms and living rooms of the unrenovated and renovated building. The
boxplot value of -1 represents poor air quality, and the value 1 represents
good air quality.
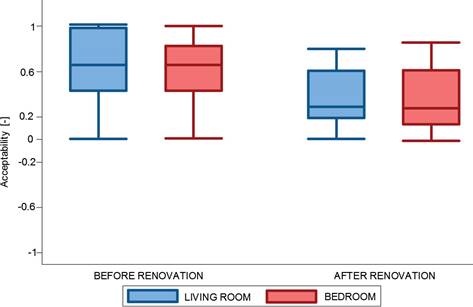
Figure 13.
Acceptability of the indoor air as statistical output.
The changes
in the ventilation habits of the inhabitants before and after the renovation
are presented in Table 9. The first part of the table shows the
percentage characterizing the frequency, while the second part contains the
duration of the ventilation.
The results
indicate that the inhabitants did not change their ventilation habits after the
renovation. Most of them ventilated the living room once a day, and the
ventilation time was 7.5 min. The
occupants ventilated bedrooms daily or almost daily but not every day. After
the renovation, the ventilation time slightly increased but not
significantly.
Table 9. Ventilation habits of the inhabitants.
Ventilation | Before renovation (N=20) | After renovation (N=20) | ||
Whole apartment | Bedroom | Living room | Bedroom | |
Frequency of ventilation [%] | ||||
More than once a day | 70 | 40 | 60 | 30 |
Daily or almost daily | 30 | 60 | 40 | 70 |
The average duration of ventilation [%] | ||||
3.5 min | 25 | 15 | 15 | 15 |
7.5 min | 35 | 20 | 40 | 20 |
20 min | 15 | 30 | 20 | 40 |
30 min | 25 | 35 | 25 | 25 |
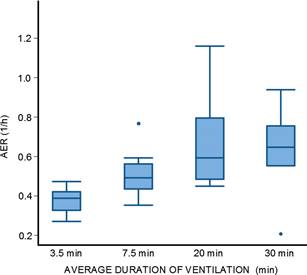
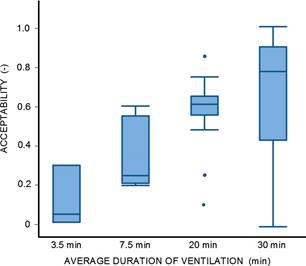
The
boxplots in Figure 14 shows the relationship between the
duration of the ventilation and the air exchange rate, as well as the
relationship between the duration of the ventilation and the acceptability of
the indoor air.
The results
clearly show a linear relationship between the duration of the ventilation
(AER) and the acceptability of the indoor air.
|
|
Figure 14. Relation between AER and acceptability. |
Indoor air quality is a dominant contributor to total personal exposure
because most people spend a majority of their time indoors (N. Klepeis, W. C.
Nelson, W. R. Ott el al. (2001). The findings presented in this measurement
campaign support the conclusions of previous studies in Slovakia (Földváry V.,
Bekö G., Petráš D. (2014)) in which deterioration of indoor air quality follows
energy renovations. In this study, the implementation of the energy-saving
measures was not combined with measures to improve the indoor environmental
quality, which explains the lower AERs and higher CO2 and TVOC
concentrations in the renovated buildings in the winter.
Many international studies have also attributed this phenomenon to the fact
that older buildings are leakier and newer ones are more air-tight as a result
of improved construction techniques and stricter regulations (Kotol M., Rode
C., Clausen G., Nielsen T. R. (2014); Bekö G., Toftum J., Clausen G. (2011)).
The limitation of the study is its small sample size. The validation of the
results on a larger sample size is warranted. The study is ongoing, and additional
results will be available in the near future.
A key goal of the implementation of an energy renovation strategy is to
achieve the improved energy efficiency of buildings. However, the effect of
these programs has not been systematically assessed. The effects on indoor air
quality and well-being of the occupants is often ignored. There is an urgent
need to assess the impact of the currently applied building renovation
practices on the residential indoor air quality on a nationwide scale.
Jurelionis
A., Seduikyte L. (2010): Assessment of indoor climate conditions in
multifamily buildings in Lithuania before and after renovation. 2nd
International conference on Advanced Construction. Kaunas, Lithuania.
Földváry
V., Bekö G., Petráš D. (2014): Impact of energy renovation on indoor air
quality in multifamily dwellings in Slovakia. Proceedings of Indoor Air 2014,
Hong Kong, Paper No. HP0143. Arash Rasooli, Laure Itard, Carlos Infante Ferreira, “Rapid, transient,
in-situ determination of wall’s thermal transmittance,” in Rehva Journal, vol.
5, 2016, pp. 16-20.
Földváry
V., Bekö G., Petráš D. (2015): Seasonal variation in indoor environmental
quality in non-renovated and renovated multifamily dwellings in Slovakia.
Proceedings of Healthy Buildings Europe 2015, Eindhoven, Paper ID 242.
Földváry
V. (2016): Assessment of indoor environmental quality in residential buildings
before and after renovation. Doctoral thesis. Bratislava, Slovakia.
Bekö
G., Földváry V., Langer S., Arrhenius K. (2016): Indoor air quality in a
multifamily apartment building before and after energy renovation. Proceedings
of the 5th International Conference on
Human-Environment System, ICHES 2016 Nagoya, Japan.
Persily
A. K. (1997): Evaluating Building IAQ and Ventilation with Indoor Carbon Dioxide. ASHRAE
Transactions. 103, Vol. 2.
N.
Klepeis, W. C. Nelson, W. R. Ott el al. (2001): The National Human
Activity Pattern Survey (NHAPS): a resource for assessing exposure to
environmental pollutants. Journal of Exposure Analysis and Environmental
Epidemiology. 11, pp. 231–252.
Kotol M., Rode C., Clausen G., Nielsen
T. R. (2014): Indoor environment in bedrooms in 79 Greenlandic households, Building and
Environment, Vol. 81, pp. 29-36.
Bekö
G., Toftum J., Clausen G. (2011): Modelling ventilation rates in bedrooms based
on building characteristics and occupant behaviour. Building and Environment,
Vol 46, pp. 2230-2237.
Sánka
I., Földváry V., Petráš D. (2016): Experimentálne meranie CO2 a intenzity
výmeny vzduchu v bytovom dome. (Experimental measurements of CO2
concentration and air exchange rate in a residential building) TZB-Haustechnik,
Vol 25, 5/2016, pp. 46-49.
Sánka
I., Földváry V., Petráš D. (2017): Evaluation of Indoor Environment Parameters in
a Dwelling Before and After Renovation. Magyar épűletgépészet Vol, 65, pp.
29-33.
Sánka
I., Földváry V., (2017): Experimentálne meranie toxických látok vo vnútornom
vzduchu pred a po obnove bytového domu. (Experimental measurements of toxic
substances in the indoor air before and after renovation) TZB-Haustechnik, Vol
26. 2/2017, pp. 32-35.
Follow us on social media accounts to stay up to date with REHVA actualities
0