

Stay Informed
Follow us on social media accounts to stay up to date with REHVA actualities
| Stine Pedersen |
| Steffen Petersen |
M.Sc. Civil and
Architectural Engineeringstinemlp@gmail.com | Associate
Professor Department of Engineering, | ||
stp@eng.au.dk |
The concept of a Predicted Mean Vote (PMV) as a design criterion for thermal comfort (Fanger 1970) is carefully developed and validated in a scientific manner under controlled conditions in laboratories. These criteria are widely accepted and used for design goals in building design projects. However, a number of experiments (de Dear et al. 1998, Humphreys and Nicol 2002, Olesen and Parsons 2002) show that there seems to be a deviation between the ”theoretical” thermal comfort and the ”actual” thermal comfort in real buildings.
Reasons for this deviation are by some ascribed to be the occupant expectations to the indoor climate and the possibilities of occupants to adapt themselves or their environment to maintain thermal comfort. The so‑called adaptive comfort models (de Dear et al. 1998, Humphreys and Nicol 2007) rely on the recognition of these behavioural and psychological factors. Even the heat balance‑based PMV has been suggested to be expanded with an expectation factor so the index becomes PMVe (Fanger and Toftum 2002).
The prevailing adaptive models and the PMVe model result in different temperature ranges of thermal comfort. This is because the data for the models are obtained in different climates. This goes to show that expectations to the indoor climate can be different in different climates and cultures. More studies are needed to understand the expectation factor in relation to thermal comfort in real buildings. The challenge of research in this area is the scale and frequency of the data needed. Typically web‑based indoor environment surveys only sample each participant once (Konis 2012). This can be problematic because the indoor environment is not homogeneous but dynamic: the indoor conditions change throughout the day. Furthermore, the participants are likely to forget to answer the survey due to their work tasks (Konis 2012). Therefore new efficient methods to collect vast amounts subjective and objective data simultaneously in a fast and reliable manner are desired.
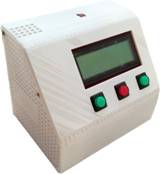
A desktop polling station (DPS) for fast and reliable collection of vast amounts of data has been developed. The DPS is a small box with an interface where building occupants can be asked for their subjective assessment of the indoor climate while sensors continuously are logging objective measures like air temperature, relative humidity, CO2 concentration, and illuminance level. The subjective assessment is based on a questionnaire containing questions about clothing level, thermal sensation, thermal preference, air quality, air velocity and lighting level. The questionnaire takes 1‑2 minutes to answer. The questionnaire uses the 7‑point ASHRAE‑scale (ISO 7730 2005) to assess the subjective thermal sensation. The other questions were adopted into this form but only with a 5‑point scale to shorten the survey time. The DPS can be seen in Figure 1 (top).
|
|
Figure 1. Top: The Desktop Polling Station. Bottom: Flow diagram of the user interactions.
The desktop polling station was designed and built to be located at each participant’s workstation making the interaction easier. This allows the occupants to participate in studies without them having to change location, time schedule or environment. Interactions with the DPS are encouraged trough prompts for regular subjective feedback by blinking diodes in the buttons. The conceptual design of how the DPS collects fast data can be seen in the Figure 1 (bottom).
A pilot field study was conducted on the lower floor (2nd) of a 5‑story open plan air‑conditioned office in Aarhus, Denmark. The purpose was 1) to test the robustness of the DPS for data collection, 2) testing the rate of user interaction and experience, and 3) to gather data for the development of a conceptual analysis method to identify the expectation factor based on DPS data. Data was collected at the workspaces of 10 participants with a distribution of gender at 40% female and 60% male. All participants had similar work task that involved computer work for the majority of their work hours.
Despite of some minor technical issues, a total of 371 subjective assessments of the indoor environment were collected from 9 participants on the course of 10 workdays. This is a relatively vast amount of assessments within the few days considering that 4 655 observations were collected in a time period of three years in the research project SCATs (Nicol et al. 2007) which is the basis for the adaptive comfort criteria in the European standard EN 15251. In average each DPS collected 4.7 participant responses per day but the most active participants had 8–12 assessments per day. The DPS technology therefore has a high potential for gathering large amounts of subjective votes and objective data.
A difference between PMV and Actual Mean Vote (AMV) was observed. A theory is that difference between PMV and AMV is due to an expectation factor since no other adaptive behaviour was observed in the pilot field study case. The preliminary findings showed a tendency for a relationship between the derived expectation factor and air indoor temperature (Figure 2, left) and a relatively weaker relation between the expectation factor and running mean outdoor temperature (Figure 2, right). It is important to note that the pilot study was very small in number of participants and limited to a very short period to make any sound conclusions for development of indoor climate models. However, the pilot study has illustrated that the DPS technology has the potential to collect vast amount of data – data which is valuable for various purposes in indoor climate research and development of more user‑driven control of indoor climate systems. We welcome any ideas for future collaborations in this field.
|
|
Figure 2. The expectation factor in relation to the air temperature and the running mean outdoor temperature.
de Dear R. and G. Brager (1998): Thermal Adaptation in the Built Environment: A Literature Review. Energy and Buildings no. 27, pp. 83–96.
de Dear R., G. Brager and D. Cooper (1997): Developing an Adaptive Model of the Comfort and Preference. ASHRAE RP‑884.
Fanger P.O. (1970): Thermal Comfort ‑ Analysis and Applications in Environmental Engineering. McGraw‑Hill Book Company.
Fanger P.O. and J. Toftum (2002): Extension of the PMV Model to Non‑Air‑Conditioned Buildings in Warm Climates. Energy and Buildings no. 34, pp. 533‑536 ISSN 0378‑7788.
ISO 7730 (2006): Ergonomics of the thermal environment – Analytical determination and interpretation of the thermal comfort using calculation of the PMV and PPD indices and local thermal comfort criteria 3. Edition.
Konis K. S. (2012): Leveraging ubiquitous computing as a platform for collecting real‑time occupant feedback in buildings, Intelligent Buildings International.
Nicol F. and M.A. Humphreys (2002): Adaptive thermal comfort and sustainable thermal standards for buildings, Energy and Buildings no. 34, pp. 563–572.
Nicol F. and M. Humphreys (2007): Maximum temperatures in European office buildings to avoid heat discomfort. Solar Energy no. 81, pp. 295–304.
Olesen B.W. and K.C. Parsons (2002): Introduction to thermal comfort standards and to the proposed new version of EN ISO 7730, Energy and Buildings no. 34, pp. 537–548.
Follow us on social media accounts to stay up to date with REHVA actualities
0