Stay Informed
Follow us on social media accounts to stay up to date with REHVA actualities


The term ZEB is used commercially without clear agreement on its content [1, 2]. In general, a ZEB is understood as a grid-connected, energy-efficient building that balances its total annual energy consumption by on-site generation and associated feed-in credits. To emphasize the balance concept – in contrast to an autonomous building – the term Net has been introduced, so that one can speak of Net ZEB and the variants nearly Net ZEB or Net plus energy building, as shown in Figure 1.
Since the 2010 recast of the EC Energy Performance of Buildings Directive [3], the discussion has become even more intensive. REHVA published a proposal in the May 2011 issue of its Journal [4]. The EPBD Concerted Action offers a platform for member states to discuss the various national approaches to formulate relevant definitions at the building code level [5]. The on-going IEA activity “Towards Net Zero Energy Solar Buildings” was formed in 2008 as a scientific forum at the international level [6]. The authors of this paper are members of the subtask, “Definitions & large-scale implications”.
Over the past few years, the IEA working group has analysed relevant publications on the ZEB topic and has published a comprehensive review [7]. This review was followed by a recently published article addressing a consistent definition framework [8], a project data base [9] and a book including a set of well-documented exemplary buildings covering a wide range of typologies and climates [10]. This paper summarizes the most relevant findings, adding to the information provided in previous issues of the REHVA Journal.
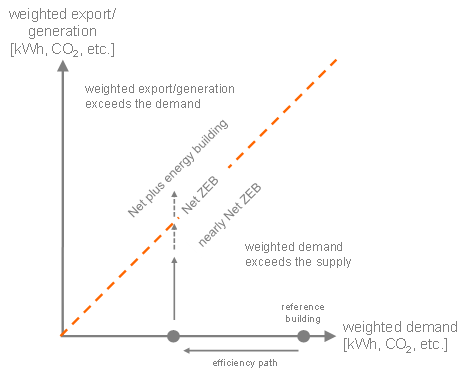
Figure 1. Graph representing the path towards a Net Zero Energy Building (Net ZEB), with the nearly and plus variants. Source: University Wuppertal, btga.
Building codes focus on a single building and the energy services that are metered. Therefore, it is possible to distinguish between a physical boundary and a balance boundary. The combination of physical and balance boundaries defines the building system boundary, see Figure 2.
The physical boundary identifies the building (as opposed to a cluster or a neighbourhood). The energy analysis addresses energy flows at the connection point to supply grids (power, heating, cooling, gas, fuel delivery chain). Consequently the physical boundary is the interface between the building and the grids. The physical boundary therefore includes up to the meters (or delivery points). The physical boundary is also useful to identify so-called “on-site generation” systems; if a system is within the physical boundary (within the building distribution grid before the meter) it is considered to be on-site, otherwise it is off-site. Typical on-site generation systems are PV and micro CHP, which allow energy to be exported beyond the physical boundary. The yield of solar thermal systems is typically consumed entirely on-site due to technical limitations at the connection point to district heating systems. Therefore solar thermal systems are mostly treated as demand-reduction technology (efficiency path, x-axis in Figure 1). A typical off-site option is a share in a wind energy turbine which is financed by the building budget. This option would allow economically feasible options to balance the building energy consumption [11], but should be considered within the primary energy factor for the imported electricity to avoid double counting. However, the EPBD addresses only energy generated on-site or nearby. Therefore, while the concept of ‘nearby’ still needs to be better defined, off-site solutions seem to be beyond its scope.
The balance boundary identifies which energy services are considered. In the EPBD, energy balance calculations take into account the technical services for heating, cooling, ventilation and domestic hot water (and lighting in the case of non-domestic buildings). Plug loads and central services are not included, but are typically included when metering energy use at the point of delivery. Some pilot projects also include the charging of electric vehicles on-site (before the meter [8]). Although these loads are not related to the building performance, a holistic balance including all electric consumers on-site helps to characterise the grid interaction in more detail (see below). Electric cars include batteries, thereby increasing the “on-site” storage capacity.
Other forms of energy consumption that do not appear in the annual operational phase but belong to the life cycle of a building may be considered within the balance boundary, such as embodied energy/emissions related to construction materials and installations. The recently formulated definition in Switzerland and the one under development in Norway address this issue [9, 10]. The result of a recent study on the life-cycle energy balance of low-energy and net zero-energy buildings indicates that the embodied energy of a building increases only slightly when the step towards nearly and net ZEBs is taken. This is due to the domination by structural building elements compared to energy-saving measures or generation systems [11].
The weighting system converts the physical units of different energy forms into a common metric to facilitate the balancing process, Figure 2. According to the EPBD recast, the metric of the balance for a nearly ZEB is primary energy. Nevertheless, some countries prefer carbon emissions as the primary metric. Examples of weighting factors are documented in EU standards such as EN 15603 but many different factors are used in national building practice, reflecting the specific national or local power grid structure (annex 1 in [8]). Factors develop with time and are not physical constants. Most countries typically apply factors which take only the non-renewable component of the primary energy content into account. This is the background leading to the low conversion factors for biomass or biofuels, resulting in market stimulation for such energy supply solutions for Net ZEBs. Some countries apply politically adjusted (increased) factors in order to reflect the regionally limited availability of biomass and biofuels from sustainable forestry or agriculture (e.g. Switzerland [16]). In other countries, politically adjusted (decreased) factors are applied to electricity in order to include the expected ‘greening’ of the power sector in accordance with national and EU road maps (e.g. Denmark [17] and Norway [18]). Such ‘discounting’ of electricity favours all-electric solutions such as systems based on heat pumps, facilitating achieving the Net ZEB target in connection with decarbonised power grids (with a high share of renewable energy). Similarly, discounted values for the district heating/cooling grid would make the Net ZEB target more feasible in connection with thermal grids based on large shares of renewable energy and/or waste as fuel.
Typically, symmetrical weighting factors are applied when balancing imported and exported energy; energy delivered by the grid and fed into the grid is given the same value. Other developments weight asymmetrically to stimulate on-site generation approaches (Germany 2012: 2.4 kWh primary energy per kWh electricity delivered from the grid, 2.8 kWh primary energy per kWh electricity exported to the grid [19]). Weighting factors may vary seasonally (or even at the daily or hourly level) as discussed below.
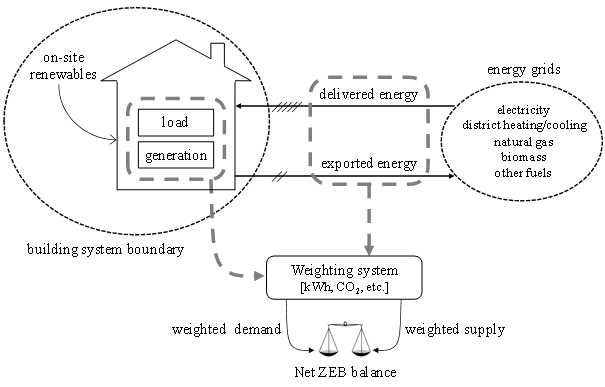
Figure 2: Sketch of the connection between buildings and energy grids showing the relevant terminology, source [8].
The Net ZEB’s annual balance between weighted demand and weighted supply is often implicitly understood as the so-called import/export balance, indicated by the green line in Figure 3. Weighted delivered and exported energy quantities can be used to calculate the balance when monitoring a building, as long as all consumptions are included. Separating some components of the consumption out of the balance creates the need for more sophisticated (sub-)metering.
Such quantities are known in monitoring, but in the design phase they could be calculated only if there were good estimates of “self-consumption”: the share of on-site generation that is immediately consumed in the building. Self-consumption differs according to the type of generating technology, the type of building, the climate and the user behaviour because it depends on the simultaneity between generation and consumption. Currently there is not enough knowledge about self-consumption to establish standardised self-consumption fractions. This is one of the points which were left open in the previous REHVA article on a Net ZEB definition [4]. In order to enable the import/export balance calculation in the design phase planners need to have data on end uses patterns, e.g. for appliances, cooking, hot water use, etc. with sufficient time resolution. In the same way as weather data are standardized to provide reference climates for dynamic simulations, user profile data may be standardized to enable an import/export analysis under reference conditions.
As the EPBD recast mainly addresses building performance requirements in the planning phase, it focuses on the balance between weighted on-site generation and the calculated energy demand, the so-called load/generation balance (red line in Figure 3). These quantities do not cross the building system boundary, so the grid interaction is disregarded. The advantage is that both quantities can be calculated independently in the absence of detailed information on time-dependent load and generation profiles with high resolution. The main difference between the two balance types is the self-consumed fraction of energy generated on site, resulting in different numbers.
The load/generation balance in the understanding of the EPBD recast addresses generation by renewable sources only. This means that a CHP system fuelled by natural gas and exporting power to the grid is not taken into account on the generation side, whereas it typically is included with its power generation on the export side of the import/export balance. While solar thermal gains are counted as load reduction in the import/export balance (no heat exported), these gains are counted as on-site renewable generation within the load/generation balance and for the fraction of renewables covering the load. As the EPBD calls for a “significant share” of renewables to cover the remaining load of a Net ZEB or nearly-Net ZEB, the total share of renewables needs to be clearly defined.
As most national energy codes apply calculations on a monthly basis, generation and consumption may be calculated and compared on a monthly level, allowing a so-called virtual load match to be determined. Monthly on-site generation up to the level of the monthly load is counted as virtual self-consumption (= reducing the load, efficiency path in Figure 1). Only the monthly residuals, i.e. monthly generation surplus or remaining load, are added up to determine annual totals. Such a balancing method may be called monthly net balance (blue line in Figure 3). One application is in the version of the German building energy code that has applied since 2009 [20].
In the monthly net balance the annual surplus characterizes the service taken over by the grid to overcome the seasonal mismatch between load and generation. However, in the case of multiple delivered energy forms, the annual surplus is also influenced by the substitution effect; i.e. when exported electricity is also used to compensate for other forms of energy that have been imported, e.g. gas or biomass. In the case of multiple forms of exported energy, e.g. both electricity and heat, the annual surplus is also distorted by the different weighting factors. Finally, the result depends on the balance boundary with respect to plug loads and central building services: excluding part of the loads increases the monthly surplus (assuming constant generation). High-resolution net metering in the building operation phase typically results in a lower load/generation match and higher export than that estimated by the monthly net balance. The monthly net balance is a simplified approach for the design phase, when high-resolution profiles are not available.
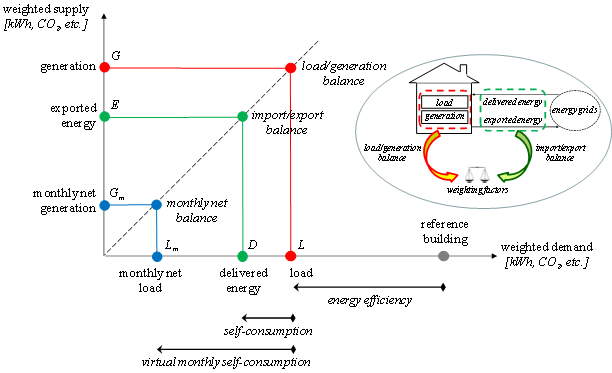
Figure 3. Graphical representation of the three types of balance: import/export balance between weighted exported and delivered energy, load/ generation balance between weighted generation and load, and monthly net balance between weighted monthly net values of generation and load, source [8].
Buildings using on-site generating systems have different abilities to match the load and benefit from the availability of energy sources and the demands of the local grid infrastructure, namely the power grid and in a few cases the heating/cooling grid. Differences occur in:
· the temporal match between energy generation on site and the building load (load match)
· the temporal match between the energy transferred to a grid and the demands of a grid (grid interaction), and
· the (temporal) match between the types of energy imported and exported (fuel switching).
As mentioned above, load matching and grid interaction have to be discussed with respect to the form of energy and the temporal resolution. Calculations have to be made for each form of energy separately. Simple monthly net metering is sufficient to describe and investigate the seasonal performance (Figure 4, simplified example of an all-electric building), whereas high-resolution simulation or monitoring is needed to describe daily and hourly fluctuations [21, 22]. Load matching and grid interaction is almost irrelevant in the context of fuel-based energy supply but is of major importance for the electricity grid interaction.
Increasing the load match is not an intrinsically favourable strategy for a grid-connected building. The value – expressed in the weighting metrics, or in an equivalent monetary value – of the exported energy to cover loads somewhere else in the grid may be higher than losses associated with on-site storage solutions to increase matching. The value may vary depending on the season and time of day, due to the varying fraction of renewable power available in the grid. The choice between on-site storage and export will depend on such dynamic values. There is no a priori positive or negative implication associated with high or low load match. However, a load match calculated on monthly values (=monthly net metering) will at least give a first order insight to characterize the service taken over by the grid to overcome the seasonal mismatch of load and generation (calculated on each single energy carrier, so without the distortions affecting the monthly net balance).
Weighting factors with seasonal/monthly variation applied within building energy code systems present a possible future method to influence the balancing results and to stimulate beneficial and sustainable developments. The factors for the power grid can address differences in the fraction of renewables. In the case of a grid with high penetration of solar power generation, large seasonal differences will be typical for most climates. Low weighting factors during summer as compared to higher factors during winter would stimulate building energy solutions which operate to the benefit of the grids. Time-dependent electricity tariffs are a typical measure within “smart grids” to communicate such issues at the financial level.
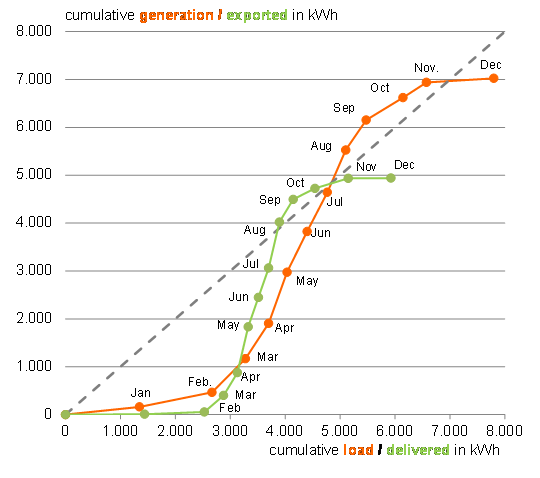
Figure 4. Monitoring results for a small all-electric, nearly Net ZEB in Germany. The building is the Wuppertal University entry to the Solar Decathlon Europe 2010 in Madrid [23]. The data based on 5-min resolution are expressed as a load/generation balance as well as an import/export balance including all on-site loads. Monitoring started in September 2011; data for July/August 2012 have been estimated. Source: University Wuppertal, btga
The report underlines the complexity of the topic and the implications of definitions and regulations for appropriate solutions. Nationally specific formulations have to clarify the balance boundaries, the balance type and the weighting with respect to the EPBD, the already established national building energy code framework and the strategic energy plan. As load match and grid interaction become important characteristics in future green and smart grids, it is important that calculation procedures reflect these issues. The import/export balance including all types of on-site (before the meter) generation and loads in a harmonized way seems to be the suitable approach in the medium-long term. However, there is a need to more knowledge on transient load patterns in the planning phase. The load/generation balance combined with a monthly net balance approach may serve as a compromise.
Asymmetrical and time-dependent weighting factors for grid-based energy are important components of a future method. Such an approach would be in line with tariff systems which communicate the strategy to consumers at a financial level. However, this does not mean that a net-zero or nearly net-zero energy building would have net or nearly zero energy costs. This is due to the cost of using the grid and related taxation.
As an aid to studying the various definition options, a spread-sheet tool for planning and monitoring data analysis that addresses the most relevant combinations of balance boundaries, balance types and weighting factors will be made available by the IEA working group at the end of 2012 (check [6] for free download). A standardized monitoring procedure with protocols to check the targets has been developed. The procedure includes sixteen steps belonging to three different phases of the accomplishment of a monitoring campaign [24].
The work presented in this paper has been largely developed in the context of the joint IEA SHC (International Energy Agency, Solar Heating and Cooling) Task 40/ECBCS (Energy Conservation in Buildings and Community Systems) Annex 52: Towards Net Zero Energy Solar Buildings.
1 | Marszal, Anna; Bourelle, Julien; Musall, Eike; Heiselberg, Per; Gustavsen, Aril; Voss, Karsten: Net Zero Energy Buildings - Calculation Methodologies versus National Building Codes. Proceedings of EuroSun Conference 2010. Graz |
2 | Musall, Eike;
Voss, Karsten: Nullenergiegebäude – ein Begriff mit vielen Bedeutungen. detail green 1/12 2012 (1), Page 80–85 |
3 | |
4 | Kurnitzki, J. et. Al.: How to define nearly net zero energy buildings nZEB, REHVA Journal May 2011 |
5 | http://www.epbd-ca.eu/ and Erhorn, H., Erhorn-Kluttig, H.: The path towards 2020 –
Nearly Zero Energy Buildings, REHVA Journal, March 2012 |
6 | |
7 | Marszal, A. et al.: Zero Energy Building – A Review of definitions and calculation methodologies. Energy & Buildings, Elsevier, Oxford, 02.2011 |
8 | Sartori,
I.; Napolitano, A.; Voss, K.: Net Zero Energy Buildings: A Consistent
Definition Framework. Energy and Buildings, Elsevier, Oxford, 2011 |
9 | http://www.enob.info/en/net-zero-energy-buildings/international-projects/ |
10 | Voss, K. and Musall, E. (ed.): Net Zero
Energy Buildings- International Projects on Carbon Neutrality in Buildings,
DETAIL, ISBN-978-3-0346-0780-3, Munich, 2011, http://shop.detail.de/eu_e/net-zero-energy-buildings.html |
11 | The so-called ”allowable solutions” in
the UK Zero Carbon Home approach, www.zerocarbonhub.org |
12 | http://www.bmvbs.de/DE/EffizienzhausPlus/effizienzhaus-plus_node.html |
13 | MINERGIE® (Hg.) (2011): MINERGIE-A®/A-ECO®. Available online at: http://www.minergie.ch/minergie-aa-eco.html, last update: 11.1.2012 |
14 | |
15 | Berggren, B., Hall, M.: LCE analysis of buildings - Taking the step towards Net Zero Energy Building, Task report, IEA SHCP task 40 / ECBCS annex 52, 2012 |
16 | Gebäudeenergieausweise
der Kantone – Nationale Gewichtungsfaktoren, EnDK, Bundesamt für Energie,
Bern, 2009 |
17 | Bygnigsklasse
2020, http://www.ens.dk/da-DK/ForbrugOgBesparelser/IndsatsIBygninger/lavenergiklasser/analyser_tyvetyve/Sider/Forside.aspx |
18 | |
19 | DIN V 18599,
Teil 1: Allgemeine Bilanzierungsverfahren, Begriffe, Zonierung und Bewertung
der Energieträger, Neufassung 12/2011 |
20 | http://www.enev-online.org/enev_2009_volltext/index.htm, Paragraph 5 |
21 | |
22 | Salom, J., Widén, J., Candanedo, J., Sartori, I., Voss, K. and Marszal, A. (2011) Understanding Net Zero Energy Buildings: Evaluation of load matching and grid interaction indicators, Proceedings of Building Simulation, 14-16 Nov., Sydney, AU. |
23 | Solararchitektur4,
DETAIL, ISBN 978-3-920034-48-5, München, 2011, http://shop.detail.de/de/solararchitektur.html |
24 | Napolitano,
A., and Lollini, R., Measurement and Verification protocol for Net Zero
Energy Buildings, IEA SHCP Task 40/ECBCS Annex 52 report, April 2012, check
[6] to download |
Follow us on social media accounts to stay up to date with REHVA actualities
0