


Stay Informed
Follow us on social media accounts to stay up to date with REHVA actualities
|
|
|
Li LanInstitute of Refrigeration & Cryogenics, Shanghai Jiao Tong University, Shanghai 200240, China | Pawel WargockiInternational Centre for Indoor Environment and Energy, DTU Civil Engineering, Technical University of Denmark, Building 402, DK-2800 Kongens Lyngby, Denmark | Zhiwei LianInstitute of Refrigeration & Cryogenics, Shanghai Jiao Tong University, Shanghai 200240, China |
The salaries of office workers are many times higher than the cost of operating a building in developed countries (Woods, 1989; Seppänen, 1999). Consequently, even small improvements in human performance and productivity following improvements of indoor environmental quality (IEQ) can result in a substantial economic benefit. Based on very conservative assumptions, Fisk and Rosenfeld (1997) estimated that improving indoor environment in US office buildings would result in a direct increase in productivity of 0.5% to 5%, worth US$12 billion to US$125 billion annually. It should be recognized that this estimate includes the effects of thermal environment and lighting quality affecting vision, and is only partially affected by indoor air pollution, or the distraction caused by odours and scents and their effects on productivity. The more recent estimates suggest slightly lower yet still considerable annual economic benefit of $17 to $26 billion as a result of improving IEQ (Fisk et al., 2011).
Even though the potential productivity benefits are quite substantial, they are not generally considered in conventional economic cost-benefit calculations pertaining to building design and operation. This is despite the fact that building services engineers are gradually interested in improving indoor environments and quantifying the subsequent effects of these improvements on productivity (Wargocki and Seppänen, 2006). Among many factors the reliable relationships between IEQ and productivity are needed so this may happen. An attempt to create such relationships was made by Seppänen and Fisk (2006) (see also REHVA Guidebook by Wargocki and Seppänen (2006)). Besides the relationships between air quality, ventilation and performance and ventilation rate and absence rates, the function estimating the effect of temperature on performance of office work was developed. Also others attempted to create similar relationship (Berglund et al.,1990; Roelofsen, 2001; Jensen et al., 2009; Lan et al., 2011b).
The objective of this paper is to compare quantitative relationships between thermal environment (temperature and thermal sensation) and human performance. The effects of indoor temperature on human performance are then discussed taking into account seasonal differences (winter vs. summer), as well as the selection of different categories of indoor environment used for design, as prescribed by the European Standard EN15251 (2007).
Air temperature is the commonly used indicator of thermal environment in IEQ and productivity research. One of the very first attempts to create the relationship between temperature and performance was made by Wyon (1986), and was based mainly on his experimental studies; the relationship differentiated between effects in summer and in winter (depending on clothing), as well as between effects for different type of work. The relationship showed that both elevated and too low temperatures have negative effects on performance of office work. Analogous observations were made by other authors who developed similar relationship. For example, Berglund et al. (1990) predicted performance decrement over a range of elevated indoor temperatures (see Figures 2 and 3) based on the performance measurement of wireless operators and Gagge’s two-layer model. The temperatures used in their experiments spanned however from about 30°C to 40°C; they were thus unusually high compared to temperatures “normally” occurring indoors. The results published by 24 different studies were used by Seppänen et al. (2006) to create the relationship between temperatures and performance (Figures 2 and 3); the studies were performed under laboratory conditions and in the field and dealt with performance of office work (21 studies) and schoolwork (3 studies).
Although the relationships described above linked temperature to performance, it is interesting to discuss whether the effects of thermal environment on performance should only be defined using temperature and whether other metrics such as thermal discomfort should be used as well. This question is particularly valid considering that Wyon et al. (1975) showed that subjects could achieve similar performance results under two different temperatures of around 23.2˚C (at 0.6 clo) and 18.7˚C (at 1.15 clo); at both temperatures they achieved subjectively assessed thermal neutrality by slightly adjusting the air temperature. This question is also valid considering that thermal discomfort is not only influenced by the temperature but is a result of combination of six parameters including metabolic heat production (physical activity), clothing, temperature, mean radiant temperature, air velocity and air humidity; different combinations of these parameters may result in the same thermal sensation or Predicted Mean Vote (PMV) as defined by Fanger (1970). Consequently these two indices along with the temperature can be used to describe how the thermal environment affects performance. This approach was adopted by Roelofsen (2001) who related the loss of performance with PMV (Figure 1) using the data of Berglund et al. (1990) and Loveday et al. (1995). Kosonen and Tan (2004) also used PMV to illustrate how the productivity loss can be minimized through improved thermal comfort design criteria; however, only the effects of feeling too warm on productivity were reported and no relationship between PMV and productivity was created. Jensen et al. (2009) derived on the other hand the relationship between thermal sensation votes and performance (Figure 1); they adopted the Bayesian model taking into account probabilistic distribution of different factors influencing thermal sensation and used the data on performance of addition task (a component skill used to simulate office work) from several laboratory and field experiments when creating their relationship. Recently yet another quantitative relationship also between thermal sensation votes and work performance was derived by Lan et al. (2011b) (Figure 1); they used the data on performance of neurobehavioral tests and simulated office work from their own three independent laboratory studies in which thermal sensation of subjects was recorded (Lan et al.,2009; Lan and Lian, 2009; Lan et al., 2011a).
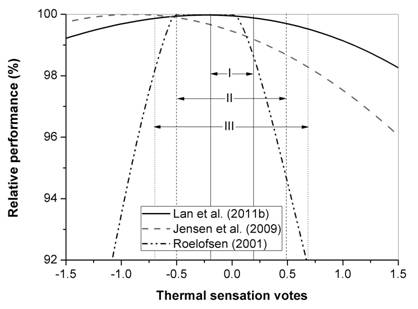
Figure 1. The relationships between thermal sensation and relative performance with superimposed categories of indoor environment according to standard EN15251 (2007); TSV is coded as follows: -3=cold, -2=cool, -1=slightly cool, 0=neutral, 1=slightly warm, 2=warm, 3=hot.
Figure 1 compares the three different relationships between thermal sensation and work performance developed by Roelofsen (2001), Jensen et al. (2009) and Lan et al. (2011b). It shows that there exists thermal sensation for optimal performance: feeling too cold or too warm will negatively affect the performance, though the effects are not symmetrical around thermal neutrality and they are somewhat skewed towards slightly cool sensation. The model of Roelofsen (2001) indicates the greatest impact of thermal discomfort on performance and probably carries the highest level of uncertainty. The relationship of Jensen et al. (2009) is similar to Lan et al. (2011b) on the cool side, though it is much different from the model of Lan et al. (2011b) on the warm side of the thermal sensation scale. The lowest impact on performance is observed for the relationship of Lan et al. (2011b) which only included laboratory data.
Using the relationships presented in Figure 1, Table 1 summarizes the potential effects of thermal environment on performance for different categories of indoor environment as specified in the standard EN15251 (2007). The relationship established by Lan et al. (2011b) indicates that within category I (with high level of expectation) one may expect the performance to decrease as much as 0.12% if different thermal conditions are selected while if category III (with acceptable, moderate level of expectation) is selected the performance can be reduced by up to 0.5% from the optimal performance of 100%. Consequently changing from category III to category I one may expect improvement of performance by at least 0.38%. Similarly, the relationship of Roelofsen’s (2001) predicts that changing the category III to category I may increase the performance by at least 6.98%. For the thermal conditions outside the criteria defined by categories I to III (category IV) one may expect that performance can be reduced by at least 0.5%compared with the optimum, and probably even more. This is also illustrated in Figure 1that shows the ranges of thermal sensation votes for different categories of indoor environment as specified by standard EN15251 (2007). All relationships show that designing for a lower environmental category will result in reduced performance.
Table 1. The potential maximum reduction in performance for different categories of indoor environment as defined by standard EN 1525 (2007).
Category according to | Predicted mean vote
(PMV) | Maximum performance
decrement compared to optimum performance of 100% (%) | ||
Lan et al. (2011b) | Jensen et al. (2009) | Roelofsen (2001) | ||
I | -0.2<PMV<0.2 | 0.12 | 0.82 | 1.44 |
II | -0.5<PMV<0.5 | 0.31 | 1.34 | 5.48 |
III | -0.7<PMV<0.7 | 0.50 | 1.75 | 8.42 |
IV | PMV<-0.7;PMV>0.7 | >0.5 | >1.75 | >8.42 |
The relationship between thermal sensation and performance developed by Lan et al. (2011b) was used to create the relationship between temperature and performance for summer (Figure 2) and for winter (Figure 3) to examine the effect of season on the predicted effects of temperature on performance. The relationship of Lan et al. (2011b) was used for this purpose as it shows the most conservative estimates of the effects of thermal environment on performance among the relationships presented in Figure 1, although other relationships can be used as well; thus the effects presented below are the minimum effects. When creating Figures 2 and 3 the mean radiant temperature was assumed to be equal to air temperature (i.e., operative temperature equals the air temperature), the activity level to be 1.2 met, air velocity to be 0.15 m/s and the relative humidity to be 50%; the clo value was assumed to be 1.0 clo for winter, and 0.5 clo for summer; other set of assumptions can of course be made if one wants to run similar sensitivity analyses in the future. The relationships between temperature and performance which are independent of seasonal changes and which were developed by Berglund et al. (1990) and Seppänen et al. (2006) were superimposed on Figures 2 and 3 for comparison.
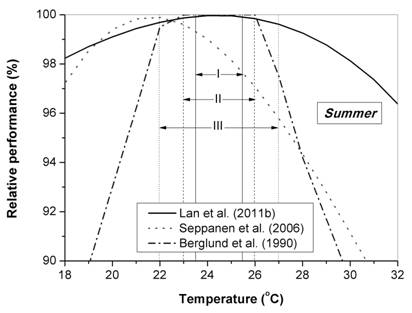
Figure 2. The relationships between air temperature and performance with superimposed categories of indoor environment for summer conditions according to standard EN15251 (2007).
Using the
relationships presented in Figures 2 and 3, Table
2summarizes the potential effects of temperature on performance in
winter and in summer for different categories of indoor environment as specified
in standard EN15251 (2007). It shows there are significant difference in the estimated effects on
performance between winter and summer if the relationships of Seppänen et al.
(2006) and Berglund et. (1990) are used, but quite comparable effects on
performance between the two seasons are observed in case of the relationship of
Lan et al. (2011b). The latter relationship shows also the most conservative
effects on performance among all three relationships; the performance is expected
to decrease from the optimal performance of 100%cbetween 0.08% and 0.39% in
summer, and between 0.14% and 0.49% in winter. Consequently changing indoor
environmental category from III to I one may expect the performance of office
work to be improved by at least 0.31% to 0.35%; this effect is, as expected, comparable
with the estimates shown in Table 1. For
temperatures outside category I to III (category IV) one may expect that
performance can be reduced by at least 0.39%. This can also be seen in Figures 2 and 3 which show also the temperature requirements for different categories
of indoor environment as specified by standard EN15251 (2007).
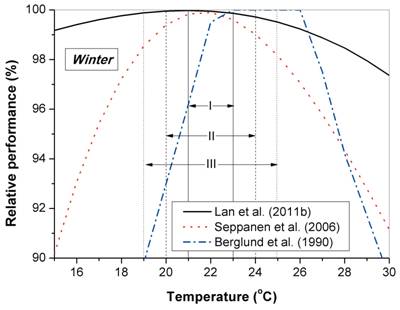
Figure 3. The relationships between air temperature and performance with superimposed categories of indoor environment for winter conditions according to standard EN15251 (2007).
It should be noted that Figure 3 shows that the temperature for optimum performance in winter is similar between the relationship developed by Lan et al. (2011b) and the relationship of Seppänen et al. (2006). This may suggest that the latter relationship is better suited for winter not for summer conditions, although the data used for developing this relationship stem from experiments performed both in winter and in summer, in different climatic regions and from laboratory and field studies (see Seppänen et al. (2006) for details).
Table 2. The potential maximum reduction in performance for different categories of indoor environment as defined by standard EN15251 (2007) in winter and in summer.
Category according to EN
15251 | Operative temperature (°C) | Maximum performance
decrement compared to optimum performance of 100% (%) | ||||||
Lan et al. (2011b) | Seppänen et al. (2006) | Berglund et al. (1990) | ||||||
Summer | Winter | Summer | Winter | Summer | Winter | Summer | Winter | |
I | 23.5~25.5 | 21~23 | 0.08 | 0.14 | 2.36 | 0.39 | 0.00 | 3.80 |
II | 23.0~26.0 | 20~24 | 0.15 | 0.28 | 2.93 | 0.98 | 0.00 | 7.00 |
III | 22.0~27.0 | 19~25 | 0.39 | 0.49 | 4.21 | 1.84 | 2.50 | 10.2 |
IV | <22; >27 | <19; >25 | >0.39 | >0.49 | >4.21 | >1.84 | >2.50 | >10.2 |
Figures 4 and 5 show the impact of changes in clothing insulation during summer and winter on the air temperature for optimum performance; they are based on the relationship of Lan et al. (2011b) shown in Figure 3. The insulation of each set of ensemble is calculated according to the description of ASHRAE Handbook (2005). All ensembles include shoes and briefs or panties. In summer, the indoor air temperature for optimum performance can be increased from about 23.9°C to 25.4°C when people wear walking shorts and short-sleeved shirt corresponding to 0.36 clo instead of trousers and short-sleeved shirt corresponding to 0.57 clo. The indoor air temperature for optimum performance can be decreased from about 21.9°C to 19.7°C in winter when trousers, long-sleeved shirt, thick long-sleeved sweater and thick sleeveless vest are chosen corresponding to 1.19 clo instead of trousers, long-sleeved shirt and thin long-sleeved sweater corresponding to 0.86 clo.
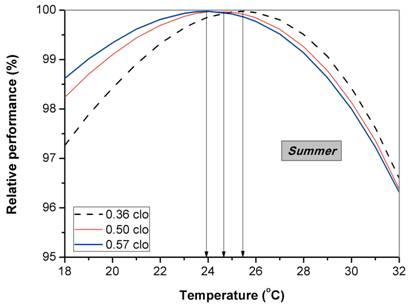
Figure 4 The relationship between indoor temperature and human performance at different clothing insulation levels for summer conditions.
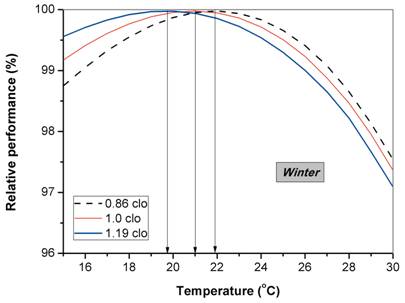
Figure 5 The relationship between indoor temperature and human performance at different clothing insulation levels for winter conditions.
Many countries now mandate that thermostats
should be set higher during warm weather to conserve the energy used for
cooling buildings. For example, a campaign named Cool Biz has been carried out
by the Japanese government recommending raising the set points during summer to
28°C and wearing lighter clothing (Akiyama et al., 2011). Figure 4 shows that increasing air temperature to 28°C and above, even with very light clothing, may reduce
performance by minimum of 0.5% if the most conservative relationship of Lan et
al. (2011b) is selected. The increased temperatures will also increase Sick
Building Syndrome (SBS) symptoms as indicated by Mendell
et al. (2002). They found that higher summer temperatures even in mid to high
levels within the comfort zone are associated with more SBS symptoms. Also Krogstadt
et al. (1991) and Fang et al. (2004) showed that high temperatures will
increase SBS. The
increased temperatures can also result in negative physiological responses (e.g.,
eye problems, change in respiratory patterns and oxygen exchange) (Lan et al.,
2011a), which may consequently affect health conditions and performance,
although at present it is not clear whether these effects are just because of
elevated temperature, or are due to thermal discomfort or both. Since elevated
temperatures in summer may have negative consequences for building users, it may
be recommended that air temperature during summer should be set within the
lower half of the summer thermal comfort range, mainly to improve performance
of office work but also to avoid the negative health effects discussed above. This
does not have to cost energy if only methods allowing avoiding thermal
discomfort due to warmth with low energy use are advanced. One of the methods
worth considering can for example be using the personalized ventilation for
cooling by intensifying the convective heat transfer (Melikov and Knudsen, 2007).
Many countries now also mandate that
thermostats should be set lower during cold weather to conserve the energy used
for heating buildings. Similar to Cool Biz, the Warm Biz campaign request home
owners and office building users to set thermostats to maximum 20°C during the
heating season. Figure 3 shows that keeping temperatures in winter at
20°C would basically have minimal effect (about 0.05% decrement) on performance.
At the same time the intensity and frequency of SBS symptoms will be reduced as
indicated by many previous studies (Reinikainen and
Jaakkola, 2001; Mendell and Mirer, 2009; Lan et al., 2010; 2011a). Actually Fisk et al.
(2011) estimated that eliminating temperatures above 23°C in winter would
result in annual economic benefits of $3.4 billion of which $2.1 billion is
attributable to improved performance and $1.1 billion to reduced prevalence of SBS
symptoms. As shown in
Figure 4, the temperature for optimum performance in
winter could be decreased efficiently by increasing clothing insulation level.
Thus maintaining the buildings in winter at the cooler end of the recommended
comfort range may not affect performance but it may also substantially reduce
many acute symptoms, all achieved together with saving a good deal of energy.
The relationships shown in Figures 1 to 5 are applicable for buildings with mechanical heating and cooling. Specifically Figures 2 and 3 provide different cooling/heating set points when applying the Fanger’s PMV model (1970). For the buildings without mechanical cooling, the indoor temperature (being the temperature at which people neither want more cooling or more heating) is a function of outdoor temperature, as prescribed by the adaptive comfort model (de Dear and Brager, 1998; EN15251, 2007). According to the adaptive model it is possible to reach thermal neutrality across the range of outdoor temperatures due to adaptive actions such as windows opening, adjustment of clothing and behavioural changes. It is difficult to estimate the effects on performance in buildings without mechanical cooling, although laboratory experiments suggest no negative effects of drifting temperatures (occurring in such buildings) on performance of simulated office work (Kolarik et al., 2009). More data on the effects on performance would still be needed from the buildings in which thermal conditions are specified using adaptive model. Nevertheless it should be noted that thermal conditions providing thermal neutrality, as e.g. defined by the adaptive model, may not give rise to maximum performance. This has already been demonstrated by Pepler and Warner (1968) and is also well illustrated by the relationships presented in Figure 1 which indicates that slightly cool environment promotes performance.
Inadequate thermal conditions expressed by both elevated or too low temperatures, by too warm or too cool environment have significant negative effects on human performance.
Studies indicate that comfortable cool
environment is beneficial for performance of office work. Avoiding elevated temperatures in
winter and in summer can bring measurable benefits.
Designing thermal environment for the lower category of indoor environment as specified in standard EN15251 (2007) will cause reduced performance of office work. The potential savings on the first costs and running costs by designing for the lower category of indoor environment can consequently be counteracted by reduced performance of office workers. Designing for the highest category would thus be desirable.
This work was supported by the International Centre for Indoor Environment and Energy, Technical University of Denmark, and the National Natural Science Foundation of China (No.51108260).
Akiyama, Y., Tanabe, S. and Nishihara, N. et al. 2011. Evaluation of air conditioning systems and cooling items by productivity and eco-efficiency. In: Proceedings of Indoor Air 2011, on CD-ROM.
ASHRAE. 2005. ASHRAE Handbook: Fundamentals. Atlanta, GA: American Society of Heating, Refrigerating and Air-Conditioning Engineers, Inc.
Berglund, L. G., Gonzales, R. R. and Gagge, A. P. 1990. Predicted human performance decrement from thermal discomfort and ET*. In: Proceedings of the fifth international conference on indoor air quality and climate, Toronto, Canada, p215-220.
de Dear, R.J.
and Brager, G. S. 1998. Developing an adaptive model of thermal comfort and
preference. ASHRAE Transactions, 104,145-167.
EN 15251, 2007.
Indoor environmental input parameters for design and assessment of energy
performance of buildings addressing indoor air quality, thermal environment,
lighting and acoustics, CEN, Brussels.
Fang,
L., Wyon, D. P. and Clausen, G. et al. 2004. Impact of indoor air temperature
and humidity in an office on perceived air quality, SBS symptoms and
performance, Indoor Air, 14( Suppl 7), 74-81.
Fanger, P. O. Thermal Comfort, Danish
Technical Press, 1970.
Fisk, W. J. and Rosenfeld, A. H. 1997. Estimates of improved productivity and health from better indoor environments, Indoor Air, 7, 158-172.
Fisk, W. J., Black, D. and Brunner, G. 2011. Benefits and costs of improved IEQ in U.S. offices. Indoor Air, 21, 357–367.
Jensen, K. L., Toftum, J. and Friis-Hansen, P. 2009. A Bayesian network approach to the evaluation of building design and its consequences for employee performance and operational costs, Building and Environment, 44, 456-462.
Krogstad, A. L., Swanbeck, G. and Barregård, L. et al. 1991. A prospective study of indoor climate problems at different temperatures in offices) [in Swedish], Göteborg, Volvo Truck Corp.
Kolarik, J., Toftum, J. and Olesen, B.W et al. 2009. Occupant responses and office work performance in environments with moderately drifting operative temperatures (RP-1269). International Journal of HVAC & R Research, 15(5), 931-960.
Kosonen, R. and Tan, F. 2004. Assessment of productivity loss in air-conditioned buildings using PMV index, Energy and Buildings, 36, 987-993.
Lan, L., Lian, Z. W. and Pan, L et al. 2009. Neurobehavioral approach for evaluation of office workers’ productivity: the effects of room temperature. Building and Environment, 44, 1578-1588.
Lan, L. and Lian, Z. W. 2009. Use of neurobehavioral tests to evaluate the effects of indoor environment quality on Productivity. Building and Environment, 44, 2208-2217.
Lan, L., Wargocki, P., and Wyon, D. P. et al. 2011a. Effects of thermal discomfort in an office on perceived air quality, SBS symptoms, physiological responses, and human performance. Indoor Air, 21, 376-390.
Lan, L., Wargocki, P. and Lian, Z. W. 2011b. Quantitative measurement of productivity loss due to thermal discomfort. Energy and Buildings, 43, 1057-1062.
Loveday, D, Hanby, V. I. and Woodward, W. D. 1995. A software tool for relating the comfort and productivity of occupants in commercial buildings. CIBSE National Conference, 69-75.
Melikov, A. K. and Knudsen G. L. 2007. Human response to an individually controlled microenvironment. International Journal of HVAC & R Research, 13(4), 645-660.
Mendell, M. J., Fisk, W. J. and Petersen, M. R. et al. 2002. Indoor particles and symptoms among office workers: results from a double-blind cross-over study. Epidemiology, 13, 296-304.
Mendell, M. J. and Mirer, A. G. 2009. Indoor thermal factors and symptoms in office workers: findings from the US EPA BASE study. Indoor Air, 19 (4), 291-302.
Reinikainen, L. M. and Jaakkola, J. J. 2001. Effects of temperature and humidification in the office environment. Archives of Environmental Health, 56, 365-368.
Roelofsen, P. 2001. The design of the workplace as a strategy for productivity enhancement, in: Clima 2000/Napoli 2001 World Congress, Napoli.
Pepler, R. D. and Warner, R. E. 1968. Temperature and learning: an experimental study. ASHRAE Transactions, 74, 211-219.
Seppänen, O. 1999. Estimated cost of indoor climate in Finnish buildings, in: Proceedings of the Eighth International Conference on Indoor Air Quality and Climate, Edinburgh, Scotland, vol.3, p13-18.
Seppänen, O., Fisk, W. J. and Lei, Q. H. 2006. Room temperature and productivity in office work, eScholarship Repository, Lawrence Berkeley National Laboratory, University of California, http://repositories.cdlib.org/lbnl/LBNL-60952.
Seppänen, O. and Fisk W. J. 2006. Some quantitative relations between indoor environmental quality and work performance or health. International Journal of HVAC&R Research, 12(4), 957-973.
Wargocki, P., and Seppänen, O. 2006. Indoor climate and productivity in offices-How to integrate productivity in life cycle costs analysis of building services, REHVA Guidebook 6., Federation of European Heating and Air-Conditioning Associations, REHVA, Brussels.
Woods, J. E. 1989. Cost avoidance and productivity in owning and operating buildings, Occupational Medicine, 4 (4), 753-770.
Wyon, D. P. 1986. Hur påverkas produktivitet och prestation av innomhusklimaet? (How is productivity and performance affected by the indoor climate), in Swedish, VVS & Energi, 3, 59-65.
Wyon, D. P., Fanger, P. O., and Olesen, B.W. et al. 1975. The mental performance of subjects clothed for comfort at two different air temperatures, Ergonomics, 18, 358-374.
Follow us on social media accounts to stay up to date with REHVA actualities
0