


Stay Informed
Follow us on social media accounts to stay up to date with REHVA actualities
|
|
|
James R. CullinResearch Associate, | Jeffrey D. SpitlerRegents Professor, | Signhild E.A. GehlinTechnical Expert, Swedish Centre for Shallow Geothermal Energy, Sweden,signhild.gehlin@geoenergicentrum.se |
Ground source heat pump (GSHP) systems are used worldwide, with an estimated installed total heating capacity of around 18 GW across 1.7 million units. While GSHP systems are highly efficient, their main disadvantage compared to conventional systems is a significantly higher first cost, due to drilling of boreholes for vertical ground heat exchangers (GHX), or excavation for horizontal GHX. In general, the length of GHX piping and, consequently, the first cost, depend on both the total annual heating and cooling loads and their distribution over the year, as well as ground thermal properties, undisturbed ground temperature, and GHX design, as well as other factors.
For low energy buildings the greatly reduced heating and cooling loads (as compared to conventional construction) provide for the possibility of using a smaller GHX. Previous work (Spitler et al., 2010; Xing et al., 2012) has detailed foundation heat exchangers (FHXs) that are placed within the excavation made for the basement and foundation, along with other excavations used for utility trenching. By eliminating separate excavation or drilling, the first cost of the GHX may be significantly reduced. Figure 1 shows a schematic of a typical FHX system around a house.
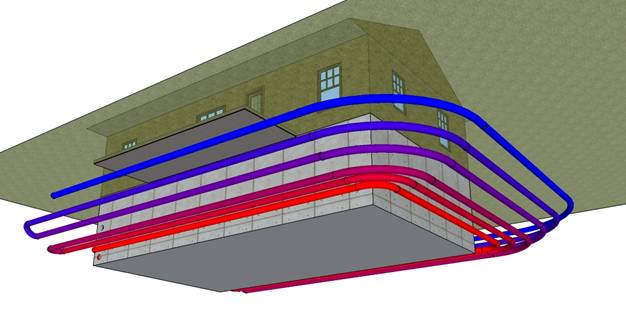
Figure 1. Schematic of foundation heat exchanger installation around house. (Figure courtesy of Edwin Lee)
The United States' Oak Ridge National Laboratory has experimentally demonstrated that an FHX-based GSHP system is feasible for several different houses in Tennessee (Shonder and Spitler 2009, Lu, et al. 2011). Additionally, a small-scale study has been performed for several house types in various European climates (Spitler et al., 2010), as well as a larger study of 17 U.S. locations (Cullin et al., 2012). The Spitler, et al. (2010) study did not include freezing and thawing of the soil; this tends to over-predict the temperature drop during winter. Therefore, this article addresses several northern European climates with a newer improved simulation model that includes freezing and thawing of the soil. Snow cover is still not addressed – partly for lack of data, but also because the worst case occurs when the weather turns cold before the snow falls. The relative importance of modeling the freezing/thawing and snow cover for ground heat transfer is discussed by Xu and Spitler (2011). But first, we review the previous European study for climates where freezing/thawing is relatively unimportant.
The Spitler, et al. (2010) study chose ten European locations to give a geographically-diverse set. A recent update of the Köppen-Geiger climate classification scheme (Kottek et al. 2006) was consulted. The seven non-Nordic locations are summarized in Table 1. For two of the climate zones (Cfb and Csa) two locations were chosen to increase the geographical diversity.
Table 1. Selected Locations and Corresponding Climates.
Location | Climate Zone |
Madrid, Spain | BSk (Mid-latitude steppe) |
Milan, Italy | Cfa (Humid subtropical) |
London, UK Frankfurt, Germany | Cfb (Marine/warm summer) |
Marseille, France Athens, Greece | Csa (Interior Mediterranean) |
Porto, Portugal | Csb (Coastal Mediterranean) |
Several versions of a prototypical house were used to generate hourly heating and cooling loads for the above locations using the EnergyPlus (Crawley et al., 2001) program. Two configurations – single story (1S) and two-story (2S) – and two insulation levels – “very high insulation” (VHI) and “high insulation” (HI) were used, as described in Table 2. All four variations of the building were simulated with a FHX completely encircling the building.
Table 2. Summary of the four simulated buildings.
HI | VHI | |||
1S | 2S | 1S | 2S | |
Floor Area (m2) | 148 | |||
Window U-factor (W/m2K) | 1.8 | |||
SHGC | 0.36 (covering 29% of the north and south facades and 3% of the east and west facades) | |||
Lighting and casual gains (W/m2) | 8.2 | |||
Constant infiltration rates | 0.5 ACH | |||
Length-to-width ratio | 1.56 | 1 | 1.56 | 1 |
Uwall (W/m2K) | 0.25 | 0.25 | 0.20 | 0.20 |
Uroof (W/m2K) | 0.16 | 0.16 | 0.13 | 0.13 |
Table 3 summarizes the results of the simulations in terms of minimum and maximum EFT. The resulting seasonal COPs were not reported in that work.
Table 3. Summary of results without auxiliary horizontal GHX.
Location | Minimum Entering Fluid
Temperature | Maximum Entering Fluid
Temperature | ||||||
1S, | 2S, | 1S, | 2S, | 1S, | 2S, | 1S, | 2S, | |
Madrid,
Spain | 6.8 | 4.7 | 6.2 | 4.3 | 23.6 | 26.2 | 23.9 | 36.0 |
Milan,
Italy | 7.6 | 3.7 | 6.6 | 1.7 | 27.3 | 28.7 | 27.5 | 35.2 |
London,
UK | 4.0 | 1.0 | 3.2 | −0.5 | 17.6 | 17.6 | 17.6 | 17.6 |
Frankfurt,
Germany | 2.1 | −1.3 | 1.3 | −2.5 | 18.2 | 18.2 | 18.2 | 18.2 |
Marseille,
France | 7.8 | 5.8 | 7.1 | 4.7 | 24.1 | 32.5 | 24.4 | 33.1 |
Athens,
Greece | 11.5 | 9.5 | 11.0 | 9.6 | 28.0 | 30.6 | 28.4 | 39.3 |
Porto,
Portugal | 11.7 | 9.9 | 11.2 | 9.8 | 23.0 | 23.9 | 23.0 | 29.8 |
In order to investigate in more detail, the range of FHX applicability in Nordic climates, a case study was performed. This study involved developing heating loads for a single-story (plus basement) house for seven different locations across Sweden. The house, as summarized in Table 4, is intended to resemble a typical house in southern Sweden, built prior to 1960 with "advanced refurbishment", as described by the TABULA project (Institut Wohnen und Umwelt, 2012). EnergyPlus (Crawley et al., 2001) was used to determine the hourly heating loads, heat pump performance and FHX performance. The FHX layout, with six pipes configured as in Figure 2, is based on the layout from the Oak Ridge experimental facility (Shonder and Spitler 2009) and completely encircles the house. The thermostatic setpoint for heating was 21.5°C. The FHX uses a 30% propylene glycol solution.
Table 4. Summary of the typical Nordic house.
Total ground floor area | 125 | m2 |
Wall U-value | 0.26 | W/m2K |
Roof U-value | 0.06 | W/m2K |
Window U-value | 0.76 | W/m2K |
Basement floor and wall U-value | 0.20 | W/m2K |
Roof area | 125 | m2 |
Window area | 22 | m2 |
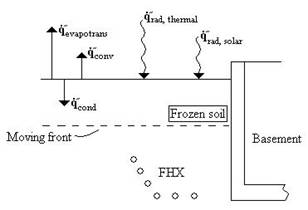
The FHX simulation in EnergyPlus environment utilizes a dual coordinate system finite volume method (Lee, et al. 2013). This model was validated against 12 months of experimental data (Lu, et al. 2011). At the ground surface, a full surface heat balance (Figure 2) including conduction, convection, short- and long-wave radiation and evapotranspiration is implemented. Recent work (Xu and Spitler 2011) has indicated that the additional accuracy gained from considering water migration is negligible, especially considering the additional computation time required to analyze it. However, freezing and thawing of the moisture in the soil is included; the insulating effect of snow cover on the ground surface is not included.
|
| ||||||||||||||||
Figure 2. FHX surface heat balance including soil freezing front, and coordinates for heat exchanger pipes. | |||||||||||||||||
Five locations across Sweden were selected for the Nordic climate case study: Gothenburg, Jönköping, Karlstad, Malmö, and Stockholm. Two more locations, Kiruna and Östersund, were also initially selected, but heat pump EFT were too low to make FHX systems feasible in those climates, and they were excluded from the further study. Hourly weather parameters for each site were taken from IWEC (Thevenard and Brunger 2001) and IWEC2 (Huang 2010) data. For each location, a two-year simulation was performed to assess whether a FHX would be suitable for locations in a Nordic climate. For this assessment, both the minimum heat pump EFT and the temperatures in the soil at the basement wall were checked, as low heat pump temperatures could cause equipment failure while freezing at the foundation could result in structural damage. Table 5 lists the minimum heat pump EFT over the course of the second year, for both the FHX system and, for comparison, a system utilizing a vertical ground heat exchanger (VGHX).
Figure 3 shows the temperatures in the soil for the hour that the fluid temperature is coldest in Gothenburg, which occurs on 29 January. The grey block in the upper left of the figure indicates the basement region. A purple line has been added to indicate where the ground is frozen. For the five cities the profile is similar, there is no additional freezing of the soil immediately adjacent to the basement wall; while the ground does freeze at the surface due to climate, and immediately around the FHX as heat is extracted from the soil, the frozen soil zone does not extend to the foundation.
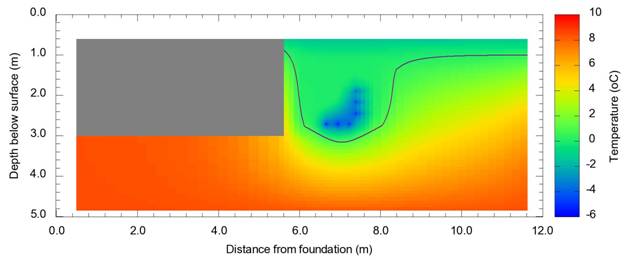
Figure 3. Soil temperature profile for coldest hour in Gothenburg.
The energy consumptions of the FHX systems were compared to systems utilizing a single 50 m deep VGHX. Using EnergyPlus, both systems were simulated for each of the five feasible locations. Table 5 shows the heating provided, as well as heat pump, pumping, and total energy consumption, for both the FHX and VGHX systems. Additionally, Table 4 lists two temperatures for each system: the minimum heat pump entering fluid temperature, and the mean heat pump entering fluid temperature, weighted by the heating supplied to the zone. The last two rows give the system "penalty" for using a FHX instead of a VGHX, in terms of the additional total energy required; the first of these two is for an FHX installed in a typical heavy, damp soil, while the second is for a soil with a higher thermal conductivity. Overall, the systems with the FHX consumed about 3-8% more energy than the systems with the VGHX, due to less favorable entering fluid temperatures. Neither system has particularly high seasonal coefficients of performance – in the case of the FHX system this is mainly an effect of the constraints of using only the perimeter of the house basement; were the system to be augmented by additional horizontal GHX, the COP would be increased, as would the margin of safety. Likewise, the VGHX is relatively short compared to typical practice – this is possible because of the highly insulated building envelope, but a deeper VGHX would yield higher heat pump entering fluid temperatures and higher seasonal COP.
Table 5. Comparison of FHX and VGHX systems.
FHX | |||||
Gothenburg | Jönköping | Karlstad | Malmö | Stockholm | |
Main Floor HP Heating Provided (kWh) | 14536 | 13971 | 15350 | 12710 | 15114 |
HP Total Electric Energy Consumption (kWh) | 5380 | 5144 | 5725 | 4590 | 5632 |
HP Run Time (hr) | 1163 | 1122 | 1228 | 1017 | 1209 |
HP Minimum EFT (°C) | −6.4 | −6.6 | −8.2 | −5.0 | −8.0 |
HP Mean EFT (°C), heating supply-weighted | −2.4 | −2.1 | −3.0 | −0.9 | −2.9 |
Pumping Energy Consumption (kWh) | 14.1 | 13.6 | 14.9 | 12.3 | 14.6 |
System Total Energy Consumption (kWh) | 5394 | 5158 | 5740 | 4602 | 5647 |
System Seasonal COP | 2.69 | 2.71 | 2.67 | 2.76 | 2.68 |
VGHX | |||||
Gothenburg | Jönköping | Karlstad | Malmö | Stockholm | |
Main Floor HP Heating Provided (kWh) | 14411 | 13840 | 15232 | 12598 | 15000 |
HP Total Electric Energy Consumption (kWh) | 4979 | 4820 | 5329 | 4227 | 5230 |
HP Run Time (hr) | 1153 | 1113 | 1219 | 1008 | 1200 |
HP Minimum EFT (°C) | −4.2 | −5.4 | −5.7 | −2.5 | −5.5 |
HP Mean EFT (°C), heating supply-weighted | 0.3 | 0.1 | −0.6 | 2.1 | −0.4 |
Pumping Energy Consumption (kWh) | 17.5 | 16.9 | 18.5 | 15.3 | 18.2 |
System Total Energy Consumption (kWh) | 4996 | 4837 | 5347 | 4242 | 5248 |
System Seasonal COP | 2.88 | 2.86 | 2.85 | 2.97 | 2.86 |
FHX System Penalty compared to VGHX system, λ=1.3 W/m-K | 7.7% | 6.4% | 7.1% | 8.2% | 7.3% |
FHX System Penalty compared to VGHX system, λ=1.8 W/m-K | 4.1% | 3.0% | 2.9% | 5.0% | 3.8% |
A previous parametric study of FHX operation in several European climates showed that the FHX appears to be a suitable alternative to conventional GHX used with residential GSHP systems for a wide range of climates. This paper presents a simulation-based case study investigating climates in Sweden, as examples of climate conditions in the Nordic countries, to determine where the technology may be feasible. In locations in middle-to-southern Sweden, the FHX appears to be feasible. For locations farther north, heat pump EFT are too low for the FHX to be feasible. Compared to VGHX systems, the FHX systems consume roughly 3−8% more energy due to less favorable ground temperatures. Augmenting the FHX system with additional ground heat exchanger will increase its performance. Conversely, an FHX may be an inexpensive and suitable complement to boost an existing VGHX in Nordic climates, when the building load has increased due to building extensions or when replacing an older heat pump unit with a newer heat pump with higher COP.
The simulation was experimentally-validated in a US location (36° N), so experimental testing in a Nordic climate prior to commercial implementation would help to better understand the behavior of FHX systems in colder climates, particularly since the simulation used in this work did not include snow cover in its analysis.
Crawley, D.B., L.K. Lawrie, F.C. Winkelmann, W.F. Buhl, Y.J. Huang, C.O. Pedersen, R.K. Strand, R.J. Liesen, D.E. Fisher, M.J. Witte and J. Glazer. 2001. EnergyPlus: Creating a new-generation building energy simulation program. Energy and Buildings 33(4): 319−331.
Cullin, J.R., L. Xing, E. Lee, J.D. Spitler, and D.E. Fisher. 2012. Feasibility of foundation heat exchangers for ground source heat pump systems in the United States. ASHRAE Transactions 118(1):1039−1048.
Huang, J. 2010. ASHRAE Research Project 1477-RP – Development of over 2,500 weather files for international locations. Final Report. ASHRAE.
Institut Wohnen und Umwelt. 2012. Typology approach for building stock energy assessment: Main results of the TABULA project. Final Project Report. Located at http://www.building-typology.eu/downloads/public/docs/report/TABULA_ FinalReport.pdf.
Kottek, M., Greiser, J., Beck, et al. 2006. World Map of the Köppen-Geiger climate classification updated. Meteorologische Zeitschrift 15(3): 259−263.
Lee, E.S., D.E. Fisher and J.D. Spitler. 2013. Efficient Horizontal Ground Heat Exchanger Simulation with Zone Heat Balance Integration. HVAC&R Research. In Press. DOI:10.1080/10789669.2013.774887
Shonder, J., and J.D. Spitler. 2009. Foundation heat exchangers: Reducing the first cost of ground source heat pumps. IEA Heat Pump Centre Newsletter 27:22−23.
Spitler, J.D., D.E. Fisher, J.R. Cullin, L. Xing, E. Lee, S.J. Rees, and D. Fan. 2011. Foundation heat exchanger model and design tool development and validation. Final report to Oak Ridge National Laboratory. Available online at http://www.hvac.okstate.edu/Papers/FHX_2013.pdf
Spitler, J., L. Xing, J.R. Cullin, D. Fisher, J. Shonder, and P. Im. 2010. Residential ground source heat pump systems utilizing foundation heat exchangers. Proceedings of Clima 2010. Antalya, Turkey. 9−12 May.
Thevenard, D. and Brunger, A. 2001. “ASHRAE Research Project 1015-RP typical weather years for international locations.” Final Report, American Society of Heating, Refrigerating, and Air-Conditioning Engineers, Atlanta GA.
Xing, L., J.R. Cullin, J.D. Spitler, P. Im, and D.E. Fisher. 2012. Foundation heat exchangers for residential ground source heat pump systems – Numerical modeling and experimental validation. HVAC&R Research 17(6): 1059−1072.
Xu, H., and J.D. Spitler. 2011. Prediction of importance of moisture transport, snow cover and soil freezing to ground temperature predictions. Proceedings of the Nordic Symposium on Building Physics. Tampere, Finland. 29−31 May.
Follow us on social media accounts to stay up to date with REHVA actualities
0