


Stay Informed
Follow us on social media accounts to stay up to date with REHVA actualities
|
|
|
|
P.J.H. WackersEindhoven University of Technology, Eindhoven,
The Netherlands. Pieter.Wackers@arup.com | M.G.L.C. LoomansEindhoven University of Technology, Eindhoven,
The Netherlands. M.G.L.C.Loomans@tue.nl | T.A.J. van GochBAM Bouw & Techniek bv, Bunnik, The
Netherlands. Dennis.van.Goch@bam.nl | J.L.M. HensenEindhoven University of Technology, Eindhoven,
The Netherlands. J.Hensen@tue.nl |
A
stochastic methodology is presented and applied to efficiently employ building
simulation tools in the risk management process. An actual Public Private
Partnership (PPP) -project of an atrium in The Netherlands is used for risk
treatment decision support. The application showed that a simple assessment
approach could already provide guidance either towards potential treatment
strategies or more complex assessment approaches. Components of the methodology
consist of sensitivity and uncertainty analysis and risk evaluation.
Risk can be
defined as the product of two contributing factors: the probability of
occurrence of a threat and its impact or consequence (de Wilde, 2012)
(Munier,2014). Risk assessment of future behaviour of systems enables reduction
of unwanted conditions leading, for instance, to less efficient operation of
systems or undesired indoor climates.
A new
design for a governmental office, in The Hague, has led to the need for
assessment of performance risks associated with the indoor climate of the large
atria. As the project is developed according to a design, build, finance,
maintain and operate (DBFMO) contract, assessment of risks in the design stage
of this DBFMO-contract is crucial given the long-term responsibility. Requirements, and related risks, towards the
atrium refer to the installation performance and comfort. Large atria are
complex environments. Their (risk) assessment nevertheless can be based on
methods ranging from simple (e.g. rule of thumbs and traditional physical
calculation methods) up to complex (numerical modelling). However, selecting
the right method for the problem is not straightforward (Moosavi et al, 2014)
(Morbitzer, 2003). In some cases,
increasing the level of complexity of the model may decrease the accuracy of
the results, due to increasing uncertainties in the input data (Kolsaker,
1995).
The main
objective of this research therefore was to support the selection of the
appropriate building simulation tool for the risk assessment. The atrium case
is used as a means to develop the method.
Figure
1 presents the
developed performance risk management framework. It originates from the
framework as proposed by ISO 31000 (2009a, 2009b). Risk identification is the starting point for the analysis. It requires the definition of
the Key Performance Indicator (KPI) that reflects the risk, and the variables
and its input parameters that affect the KPI. The risk encompasses two factors:
Consequence and Probability. Consequences often can be defined in terms of (extra) costs or
penalties. In PPP-projects penalties (money) generally will be the consequence
of not fulfilling the requirements agreed on. The probability of a risk
generally is harder to quantify, as deterministic models often are not
applicable, exact values for the input parameters in time and space are usually
unknown. To quantify this uncertainty, and with that the probability (e.g., %
chance), reference has to be made to stochastic models.
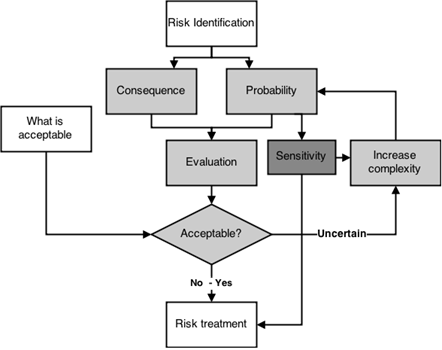
Figure 1.
Performance risk management framework.
The
stochastic method selected for the uncertainty analysis is the Monte Carlo
method. This method gives the probability distribution of possible results by
running a simulation model for a number of scenarios and randomly selecting a
different set of values from the uncertainty ranges of the input parameters. The
number of scenarios depends on the uncertainty ranges, the model and the amount
of parameters. To reduce the required computing time in case of large numbers
of scenarios and if large simulation models are required Latin hypercube
sampling (LHS) can be applied to arrive at a representative probability
distribution with less effort (van Goch, 2011) (Hoes, 2007) (de Wit, 2001).
Uncertainty analysis gives insight into the influence of the whole parameter
set on the risk probability.
Sensitivity analysis can provide additional
knowledge on the most influential input parameters. This knowledge can help in
focussing on the treatment to reduce the risk most effectively or identify the
need to analyse the effect of an input parameter at a more detailed (simulation)
level. In this work Monte-Carlo simulation in combination with linear
regression analysis is applied. Standardised regression coefficients (SRC) are
obtained to quantify the changes of the input parameters relative to the output
(Manache and Melching, 2008) (Houben et al, 2010). The input parameter with the
largest SRC has the most influence on the output.
Risk Evaluation assesses the combined consequences and
probability. The outcome is compared to what is regarded Acceptable. If the uncertainty in the analysis is too
large further analysis is required. Outcomes from the sensitivity analysis then
can be used to determine whether the current model applied requires more
detailed information or a new assessment should be chosen that allows more
variables to be included in the analysis. In both ways complexity of the
analysis is increased (Increase
complexity; Figure
1).
Figure
2 presents a
visualization of a generic example of increasing the complexity of the risk
evaluation in the two directions identified.
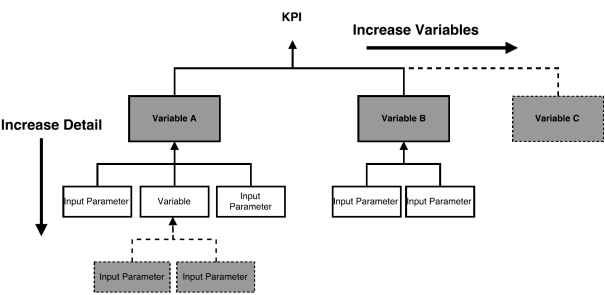
Figure 2.
Two ways to increase complexity (generic example).
The
presented methodology is applied on the DBFMO-case located in centre of The
Hague. The case consists of six atria which have been designed in 1993 as a
means to allow office windows to be opened while blocking noise and wind from
the immediate surrounding. The atrium is renovated. For part of the atria the
indoor thermal requirements decreased (i.e. lower temperatures allowed, till 3°C)
while keeping the original atrium façade in place. The office building façade
on the other hand was upgraded to have better insulation and air tightness.
For the
atrium case, one risk identified was the potential fogging of the atrium
windows due to condensation and potential of dripping of water from the ceiling
and façade. The risk referred to the visual comfort and the building
reputation, with surface temperature and relative humidity level as key
variables for assessing the condensation risk. In the original design
condensation hours were estimated at approximately 20 hours per year
(minimum indoor temperature atrium 12°C; Perquin, and Wapenaar, 1991)
The
possible consequences of condensation, comfort and reputation, can be
quantified in penalties. Similar penalties are in place for other rooms in the
case investigated, e.g., €200 for each hour indoor thermal requirements are not
met for more than 12 hours. No values were specified for the investigated
condensation risk. Therefore, an assumption was made with an increment in the
penalty in case of consecutive condensation hours (5 €/h for 1 hour to 40 €/h
for 5 consecutive hours or more).
Figure
3 presents the
input parameters and variables that relate to the condensation risk.
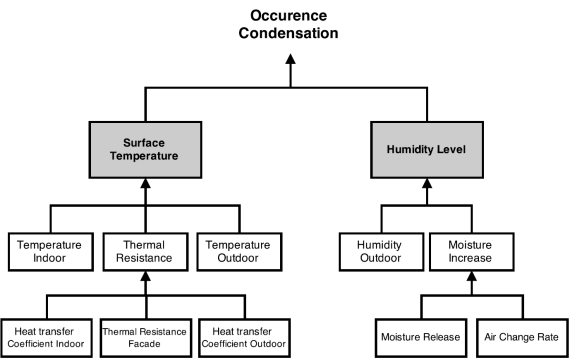
Figure 3.
Identification of condensation parameters.
The first approach
(model M1) for assessing the probability of the risk would assume the simplest
model feasible for the case at hand. In this case a steady-state
one-dimensional heat transfer model was chosen where only the atrium façade was
modelled. The Monte Carlo method is applied where, apart from the weather data
for the location and the façade thermal resistance, ranges for the boundary
conditions (Figure 3) were assumed wide and uniformly
distributed. Matlab was used for the calculations. Given the simplicity of the
model LHS is not required in this case and convergence of the solution was
assessed by increasing the number of scenarios to be calculated. Results of the
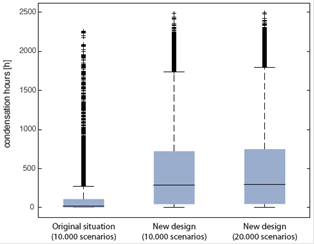
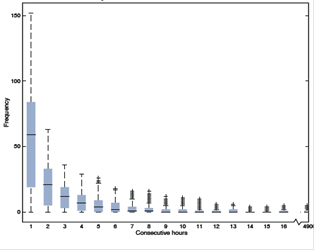
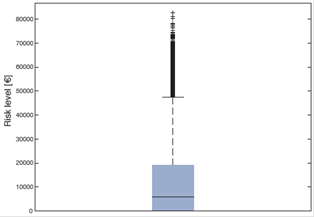
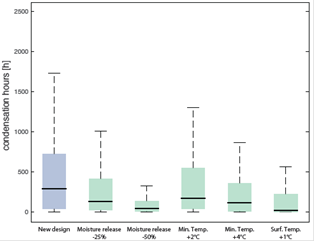
analysis are shown in Figure 4a-c. Figure 4d
presents examples of the effect of treating individual input parameters (from
regression analysis) on the number of condensation hours.
|
|
a. Probability of condensation hours per year during office hours.
Including validation and verification. Original situation (Med= 19,
σ=241), New design 10.000 (Med= 290, σ= 516), New design (Med= 295,
σ= 516). | b. Frequency of consecutive hours of condensation per year. The outliers go
up to 490 consecutive hours. |
|
|
c. Risk level condensation simulated with simple Matlab (M1) model. M1
(Med= €5,967, σ= €17,095). | d. Probability of condensation hours per year for different risk
treatments. M1(Med= 290, σ= 516), Moisture release reduction 25% (Med=
133, σ=346) and 50% (Med= 44, σ= 177). Minimum Temperature of atria
increase by 2°C (Med= 174, σ= 474) and by 4°C (Med= 120, σ=407).
Surface temperature increase by 1°C (Med= 22, σ= 329). |
Figure 4. Overview of outcomes for model M1 of the
application. | |
If the
condensation risk is unacceptable more complexity in the model can be
introduced, either by increasing the level of detail of the input parameters or
by introducing additional variables (Figure 2). For the
practical case the moisture release was most sensitive. Moisture contribution
to the atrium is obtained from (humid) airflow from the offices into the
atrium. This was assessed by assuming an airflow rate with presumed humidity
level from the office into the atrium (model M2). Again ranges and a uniform
distribution were assumed for these two parameters. As originally a
steady-state approach was assumed an additional variable ‘time’ was introduced.
For these calculations TRNSYS was used (model T1). Due to computation time now
LHS is introduced in the analysis to reduce the number of scenarios required.
With 250 scenarios in this case representative results were obtained. In
addition, this model was expanded with the extra parameters as identified for
model M2 (Model T2). The latter model also included the heat flow into the
atrium, which was not considered for model M2.
Figure
5 compares the
outcomes (condensation hours) for the four models.
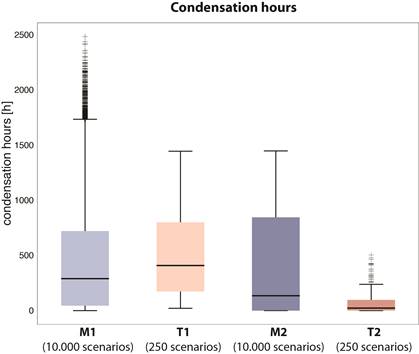
Figure 5.
Probability of condensation hours per year for different assessment approaches.
(Med= Median, σ= standard deviation) M1 (Med=290, σ= 516), T1 (Med=
409, σ= 386), M2 (Med= 135, σ= 436), T2 (Med=23, σ= 110).
The effect
of (thermal) buffering in the transient case is visible in the boxplot outcomes
for model T1 compared to the M1 model. The M2 model indicates a reduced but
skewed distribution as maximum moisture release is now determined by two input
parameters. Finally, the T2 model shows the important aspect of taking the heat
transfer from the offices into the model complexity as well. The T2 model
simulates an average atrium temperature of 13.2°C compared to 11.9°C for the T1
model. The Matlab models only focus on moisture transfer.
The
application presents an example of the functioning of the model developed. Risk
assessment and decision support for treatment selection are useful outcomes in
the design process. The application example however did show the importance of
providing correct assumptions on the ranges that may be assumed for the input
parameters under investigation. Though not easy, this is a critical aspect of
the methodology. Nevertheless, the stochastic method and combined sensitivity
analysis provide means to visualize this effect and act on it to reduce the
risk. In a deterministic method this may be much more difficult to capture.
Uncertainty of the result can be reduced effectively by focussing on
influential parameters during the selection of the more complex assessment
approach.
ISO.
(2009a). ISO 31000:2009, Risk management – Principles and guidelines (Vol.
2009). International Organization for Standardization.
ISO.
(2009b). ISO Guide 73:2009, Risk management – Vocabulary. International
Organization for Standardization.
Goch
van, T. a. J. (2011). The computational optimization of heat exchange
efficiency in stack chimneys. Master thesis, Eindhoven University of
Technology.
Hoes,
P., Hensen, J. L. M., Loomans, M. G. L. C., Vries, B. d., & Bourgeois, D.
J. 2009. User behavior in whole building simulation, Energy and Buildings, vol.
41, no. 3, pp. 295-302.
Houben,
J. V. F., Hensen, J. L. M., Trcka, M., & Zanden, W. (2010) Computational
Innovation Steering: Simulation-assisted performance improvement of innovative
buildings and systems, Proceedings of the System Simulation in Buildings
Conference SSB, 13-15 December, Liege, Belgium, p. 20.
Kolsaker,
K., & Frydenlund, F. (1995). Simplified models for air stratification and
thermal comfort in atria. ASHRAE Transactions, 101(2), 11.
Manache,
G., & Melching, C. S. (2008). Identification of reliable regression- and
correlation-based sensitivity measures for importance ranking of water-quality
model parameters. Environmental Modelling and Software, 23, 549–562.
Moosavi,
L., Mahyuddin, N., Ab Ghafar, N., & Azzam Ismail, M. (2014). Thermal
performance of atria: An overview of natural ventilation effective designs.
Renewable and Sustainable Energy Reviews, 34, 654–670.
Morbitzer,
C. A. (2003). Towards the Integration of Simulation into the Building Design
Process. PhD Thesis, University of Strathclyde, Glasgow, Scotland, UK.
Munier,
N. (2014). Risk Management for Engineering Projects - Procedures, Methods and
Tools. Springer International Publishing, Switzerland.
Perquin,
G., & Wapenaar, P. (1991). Bouwfysische aspecten van de serres van het
VROM-gebouw in Den Haag. Bouwen Met Staal, (99), 25–27.
Wilde
de, P., & Tian, W. (2012). Management of thermal performance risks in
buildings subject to climate change. Building and Environment, 55, 167–177.
Wit
de, M. S. (2001). Uncertainty in Predictions of Thermal Comfort in Buildings.
PhD thesis, Delft University of Technology, Delft, The Netherlands.
Follow us on social media accounts to stay up to date with REHVA actualities
0