


Stay Informed
Follow us on social media accounts to stay up to date with REHVA actualities
|
|
|
ArashRasooliOTB, Delft University of Technology, The NetherlandsA.Rasooli@tudelft.nl | Laure ItardOTB, Delft University of Technology, The NetherlandsL.C.M.Itard@tudelft.nl | Carlos Infante FerreiraP&E, Delft University of Technology, The
NetherlandsC.A.InfanteFerreira@tudelft.nl |
Buildings, accounting for nearly 40% of total energy consumption in Europe, play a key role in energy savings [1]. In the Netherlands, ISSO publication [2, 3, 4], as a part of EPBD (Energy Performance of Building Directive), prescribes calculation methods leading to an estimation of the gas and electricity consumption in buildings. However, the estimations have shown to be strongly deviating from the actual consumption [1,5]. The models applied to estimate the buildings’ energy consumption (Figure 1) have shown to be very sensitive to some of the input parameters such as the wall’s thermal transmittance U-value [6]. From the computational point of view, the problem seems to be the simplifications and the assumptions made whereas in the inspection viewpoint the main problem seems to be the lack of possibilities for quick and accurate on site measurement of the walls’ conductive thermal resistance.
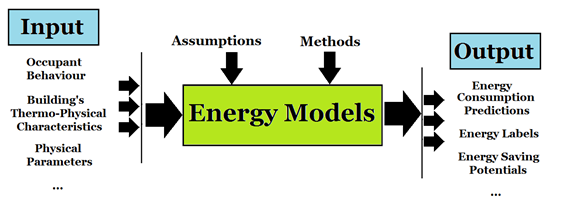
Figure 1. The general structure of a building’s energy model, the inputs, the process, and the outputs.
In the Netherlands, in case of lack of information regarding this variable, which is mostly the case in older buildings, the U-value is not being measured, but suggested based on construction period [3], conveying a strong possibility of a very poor estimation taking place in such cases. A new method is proposed, applied, and validated experimentally on site for three case studies. Applying this method, it is possible to rapidly measure the Rc-value of an unknown construction on site.
In this part of the research, the dynamic effect of walls’ heat storage due to the thermal mass is studied, applying dynamic simulations. Two dynamic methods (Figure 2), the Finite Difference and the Response Factor (RF) method [9] are used to simulate the effect of heat storage when aggregating from hourly calculations to monthly/yearly calculations.
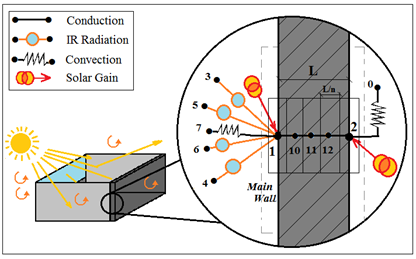
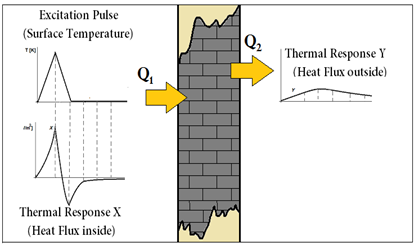
Figure 2. The Finite Difference method (top) and the Response Factors method (bottom).
Moreover, the energy labelling calculation method has been compared to a more complicated and detailed method using a thermal network. It has been shown why some simplifications made in the models based on energy labelling methods may be too radical. According to the simulations, the most obvious simplifications suspected to be playing a major role in overestimation of energy consumption include:
· Determination of heat transfer between adjacent rooms with identical air temperatures
· Definition of the combined radiative-convective heat transfer coefficients
· Different definitions of solar gains (by the surfaces or by the air)
· Including/excluding the solar gains by exterior surfaces such as roofs, etc.
It was concluded that the dynamic simulation of the walls does not change the results of energy demand prediction, as long as they are summed over a long period (e.g. weeks, months, seasons, year). However, for the hourly calculations, there is a clear discrepancy between the dynamic and static simulations, explaining a part of thermal comfort (e.g. wall’s radiant temperature) and therefore occupant behavior. Moreover, certain simplifications within the energy labeling calculations are shown to be too radical and therefore responsible for a part of the overestimations. It is recommended to include more detailed modeling parameters using correction factors.
The primary method for in-situ measurement of the thermal resistance (Rc-value) is the heat flow meter method by the international standard ISO 9869 [10] and the American standard ASTM [11, 12], demanding a very long measurement period (up to more than 2 weeks). There is therefore a need for a new, quick, feasible, and cost-efficient method.
A rapid in-situ measurement method was developed at Delft University of Technology and experimentally applied on three case studies. The fully transient method EPM, is based on the theory of RFs. The surface of the wall is exposed to a triangular temperature pulse. While the RFs are defined for a pulse with a magnitude of 1K, (see Figure 1), in EPM, the magnitude of the pulse is chosen as high as possible (up to 60°C). The RFs are then obtained using the heat flux, temperature, and the superposition principle (heat flux divided by the magnitude of the excitation pulse).
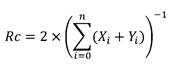
Once the RFs X and Y at both sides of the wall are obtained, the equivalent Rc-value is derived [7,8] as a function of X and Y through Eq. 1:
| (1) |
An experimental setup was designed (Figure 3) to validate the proof of principle. A proper test area of the wall is allocated by IR thermography. Two thermocouples and two heat flux meters are mounted on two sides of the wall opposite to each other, covered by a layer of tape with the same color of the wall’s surface. The linearity of the signal is controlled every 10 seconds. In order to damp the undesired temperature and heat flux fluctuations, an insulating box is mounted on the exterior surface of the wall.
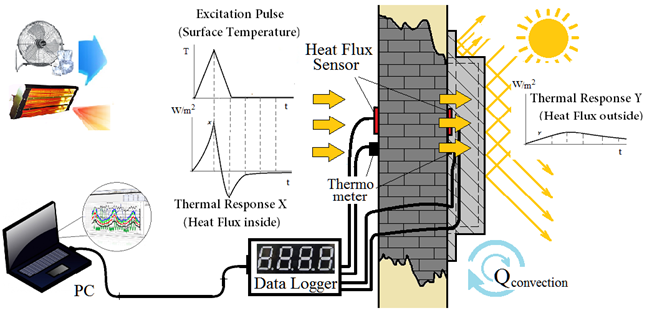
Figure 3. EPM experimental setup, linear heating followed by linear cooling, and measuring the RFs.
Using an IR heater, a variable heat flow is exerted to the surface of the wall in such a way that a pre-defined triangular temperature profile is formed on the surface of the wall. The temperature is increased to reach its desired maximum (e.g. 80°C). After this point, the heat flow is decreased to cool down linearly to the zero level. A fan with variable power and distance is employed to remove the rest of the heat absorbed by the body of the wall. Finally, when the fan’s highest speed is not enough, an ice bag is applied in combination with the fan to keep the surface temperature on a zero level. After a few time intervals, the test may stop.
The EPM is validated via comparison with the Average Method described in ISO9869 [10], in three different buildings (Figure 4). In the building from 1933, the type of construction (Dutch brick) was easy to determine and the Rc-value was calculated using brick’s properties. EPM shows an agreement with this calculation.

Figure 4. The three case studies studied by EPM and validated by ISO 9869 standard method.
The results of the validation (Table 1) show that the Rc-values measured by the EPM are in a good agreement (less than 2% error) with the ones obtained applying ISO9869, implying that EPM is reliable.
Table 1. Results of the validation of EPM (1.5 hour measurement) and by ISO 9869 (14 days measurement).
Case Study | Rc-Value (ISO 9869) | Rc-Value (EPM) | Rc-Value (Calculated) | Departure |
1 | 0.17 m²KW-1 | 0.17 m²KW-1 | 0.17 m²KW-1 | -0.58% |
2 | 0.77
m²KW-1 | 0.78 m²KW-1 | – | +1.2% |
3 | 1.57 m²KW-1 | 1.60 m²KW-1 | – | +2.0% |
Once validated, EPM has been applied to investigate the benefit of performing measurements rather than referring to the construction period as assumed in the Dutch labeling method (Table 2). It has been shown that such Rc-value default assumption can result in 88% underestimation, resulting in an overestimation of up to nearly 400% in thermal transmittance U-value, explaining a part of total energy consumption overestimation in older buildings.
Table 2. Comparison
of values obtained by EPM and Dutch energy labeling default values based on
construction year periods.
Parameter | Determination | Case Study 1 | Case Study 1 | Case Study 1 |
General Info | Construction Year | 1933 | 1964 | 1680 |
Energy Label | F | E | F | |
Rc-Value | Measured: EPM | 0.172 m²KW-1 | 0.78 m²KW-1 | 1.6 m²KW-1 |
Default value | 0.19 m²KW-1 | 0.19 m²KW-1 | 0.19 m²KW-1 | |
Difference * | +5.6% | −76% | −88% | |
U-Value | Measured: EPM | 2.92 Wm-2K-1 | 1.05 Wm-2K-1 | 0.56 Wm-2K-1 |
Default value | 2.76 Wm-2K-1 | 2.76 Wm-2K-1 | 2.76 Wm-2K-1 | |
Difference | −10% | +163% | +393% | |
* The differences are mainly caused by the fact that the default values
are, irrespective of the real construction, based on the construction year
where no insulation or cavity wall is assumed, these default are used for
buildings build before 1965. A calculation based on the real construction
properties, which cannot be obtained without destructive survey is expected
to show smaller differences. | ||||
From the experiments, it is concluded that EPM is quick, cost-efficient, and reliable. It helps measurement of the Rc-value of a wall within a couple of hours (in contrast with the current ISO standard requiring weeks of monitoring). EPM has an accuracy comparable to the existing standard and therefore, has the potential to be further developed and applied to energy labeling inspections. In case of unknown constructions, it is highly recommended to use EPM as an alternative to Rc-value suggestions based on construction periods.
1. Majcen,
D., L. Itard, and H. Visscher, Theoretical vs. actual energy consumption of
labelled dwellings in the Netherlands: Discrepancies and policy implications. Energy policy, 2013. 54: p. 125-136.
2. ISSO, 82.3, Energieprestatie Advies
Woningen Formulerstructuur. 2011, ISSO publicatie.
3. ISSO, 60, U en R-waarden van bouwkundige
constructies. 2005, ISSO publicatie
4. ISSO, 82.1, Energieprestatie Advies Woningen Energielabel + algemeen deel. 2011, ISSO publicatie.
5. Ioannou, A. and L.C.M. Itard, Energy performance and comfort in residential buildings: Sensitivity for building parameters and occupancy. Energy and Buildings, 2015. 92(0): p. 216-233.
6. Majcen, D., L. Itard, and H. Visscher, Actual and theoretical gas consumption in Dutch dwellings: What causes the differences? Energy Policy, 2013. 61(0): p. 460-471.
7. Rasooli, A., Itard, L., & Ferreira, C. I. (2016). A response factor-based method for the rapid in-situ determination of wall’s thermal resistance in existing buildings. Energy and Buildings, 119, 51-61.
8. Rasooli, A., Itard, L., & Ferreira, C. I. (2016). Introduction to an In-situ Method for Rapid Measurement of the Walls’ Thermal Resistance in Existing Buildings. Energy and Buildings. Heiselberg, P. K. (Ed.) (2016). CLIMA 2016 - proceedings of the 12th REHVA World Congress: volume 2. Aalborg: Aalborg University, Department of Civil Engineering.
9. Mitalas, G. and D.G. Stephenson, Room thermal response factors. ASHRAE transactions, 1967. 73(1): p. 1-
10. ISO, E., 9869-1: 2014(E). Thermal insulation - Building elements - In-situ measurement of thermal resistance and thermal transmittance, Part 1: Heat flow meter method, 2014.
11. ASTM, C 1155-95 (Reapproved 2001): Standard practice for determining thermal resistance of building envelope components from the in-situ data. Annual Book of ASTM Standards, 2001. 04.06.
12. ASTM, C 1046-95 (Reapproved 2001): Standard practice for in-situ measurement of heat flux and temperature on building envelope components. Annual Book of ASTM Standards, 2001. 04.06.
About this ArticleThe following article is
based on a research entitled “Computational and Experimental Investigation of
Wall’s Thermal Transmittance in Existing Buildings”, done in the Netherlands
at Delft University of Technology. During REHVA 12th world congress, CLIMA
2016, Aalborg, Denmark, two student competitions took place: On May 23rd
2016, REHVA International Student Competition and on May 24th,
REHVA World Student Competition. ArashRasooli, who had done this research for his M.Sc. thesis
in Mechanical Engineering, at Delft University of Technology, won the 1st
place in both competitions. REHVA International Student
Competition 2016Under the leadership of
Manuel Gameiro da Silva, REHVA Vice-President from
Portugal, fifteen candidates representing twelve European countries were in
competition. After the deliberation, the jury declared winner ArashRasooli for his work on
“Computational and Experimental Investigation of Wall’s Thermal Transmittance
in Existing Buildings”. REHVA World Student
Competition 2016Under the leadership of past
President Karel Kabele, seven candidates out of
five countries amongst REHVA’s international partners (ASHRAE, CCHVAC,
ISHRAE, SHASE and SAREK) were in competition. The winner of the REHVA
International Student Competition, ArashRasooli, took also part in this competition, representing
Europe. After the deliberation, the jury declared winner ArashRasooli for his work on “Computational and
Experimental Investigation of Wall’s Thermal Transmittance in Existing
Buildings”. Two trophies, two financial
prizes, and four certificates were offered to the winner. The following article summarizes the winning research.
|
Follow us on social media accounts to stay up to date with REHVA actualities
0