


Stay Informed
Follow us on social media accounts to stay up to date with REHVA actualities
|
|
|
Rajesh KotireddyBuilding Physics and ServicesDepartment of the Built EnvironmentEindhoven University of Technology, The Netherlandsr.r.kotireddy@tue.nl | Pieter-Jan HoesBuilding Physics and ServicesDepartment of the Built EnvironmentEindhoven University of Technology, The NetherlandsP.Hoes@tue.nl | Jan L. M. HensenBuilding Physics and ServicesDepartment of the Built EnvironmentEindhoven University of Technology, The Netherlandsj.hensen@tue.nl |
The developed methodology is generic and can be used for performance robustness assessment of both new buildings and renovations. This methodology is useful when different stakeholders with multiple performance requirements are involved in a project, and it is also effective in identifying a robust design from a large design space. Due to space constraints, this article demonstrates how a designer can use this methodology to identify robust net-zero energy building designs among only few design alternatives. This demonstration is carried out for the policymaker and the homeowner, who represent different interests in the building industry.
In current design practice, building performance is predicted by considering a set of assumptions about the building’s operation. Moreover, to predict the performance of the buildings historical weather data is used. Uncertainties in building operation, climate change and policies may influence the building performance, which could cause variations in energy use and operational costs and could also lead to indoor environment quality problems.The potential impact of these uncertainties is very high in low/ net-zero energy buildings [2] resulting in possible performance deviation between predicted and actual performance [3]. Furthermore, multiple net-zero energy building (NZEB) configurations can lead to similar optimal performance under deterministic conditions, but can have different magnitudes of performance deviation under these uncertainties. These uncertainties are rarely considered in the design process of net-zero energy buildings, and hence the decision making process may result in designs that are sensitive to uncertainties [4,5] and might not perform as intended. To reduce this sensitivity, performance robustness taking into account these uncertainties should be assessed during the design phase and should be included in the design decision making.
Policymakers can use performance robustness to define energy performance requirements in future building regulations to safeguard intended policy targets. They can also define policies considering robustness to support adaptations of current buildings to improve their performance and extend their lifespans. Similarly, performance robustness is a relevant concern for homeowners, since they wish to ensure their preferred building performance over the building’s lifespan. Energy performance contractors can benefit from performance robustness assessment by reducing the deviation between predicted and actual performance in operation.
The probabilities of occurrence of uncertainties are usually unknown. One way to proceed is to use ‘scenarios’, which can be understood as formulated alternatives, to integrate uncertainties into the performance robustness assessment [6]. Scenarios are used to present a range of possible alternatives so that the performance robustness of designs can be assessed based on how the different designs perform in each of these alternatives [7]. Following this approach, we developed a computational methodology to assess the performance robustness of net-zero energy buildings [8]. Figure 1 gives the graphical overview of the performance robustness assessment methodology. This methodology comprises multi-criteria performance assessment and multi-criteria decision making considering multiple performance indicators and their corresponding robustness (see Figure 2). In this approach, by prioritizing the decision maker’s preferences, the design space, future scenarios and performance indicators are defined. In summary, the performance of the design space is assessed for future scenarios using building performance simulations with multiple performance indicators and their corresponding robustness to identify robust designs.The steps of the methodology, as shown in Figure 2, are described in detail in the following section.
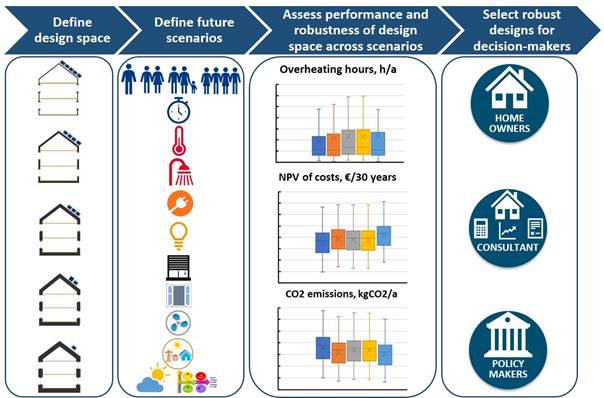
Figure 1. Graphical overview of performance robustness assessment methodology.
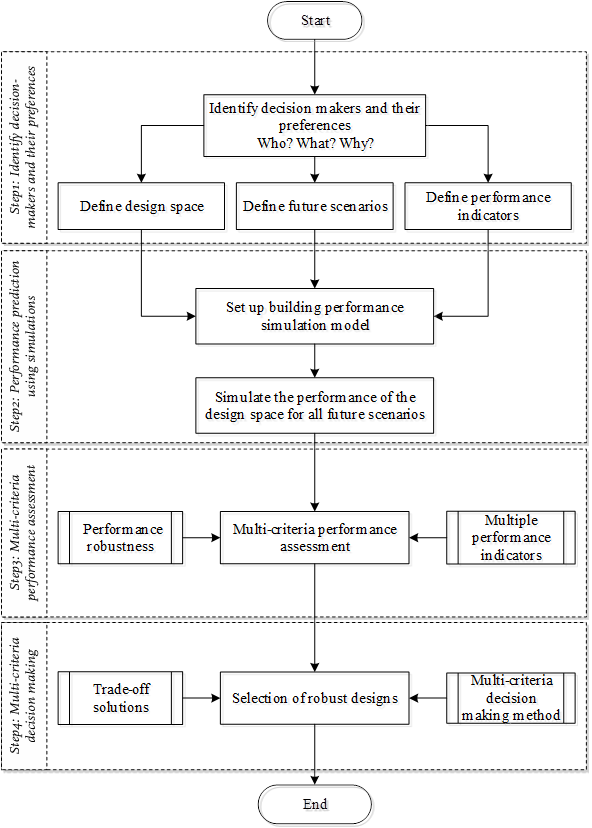
Figure 2. Detailed overview of performance robustness assessment methodology considering multiple performance indicators and their corresponding robustness.
Step 1: Identify decision maker preferences and define the building design space, future scenarios and performance indicators.
The design
space needs to be defined based on the requirements of decision makers and on
current and future building regulations such that the preferred design of a decision maker will also meet the
criteria of building codes and regulations [9–11]. In practice, it is generally the case that
several design configurations lead to similar optimal performance under
deterministic conditions, but these configurations have significantly different
magnitudes of performance deviation for future scenarios. For instance, all
designs shown in Figure 3, could be NZEB solutions under
deterministic conditions. For example, a NZEB solution can be achieved by
combining very high insulation levels (P1) and a
small renewable energy generation and storage system (RES1). In contrast, another NZEB solution can be realised by combining a relatively
lower insulation levels (Pn) and larger renewable energy
generation and storage system (RESn). However, when uncertainties
arise, these designs can have different magnitudes of performance deviation in
operation compared to predicted performance in the design phase. Hence, the
preferred design is based on optimal performance and performance robustness.
Scenarios need to be defined that consider all uncertain and influential parameters that can cause variations in the building’s performance over its lifespan. Figure 4 provides an overview of scenarios that could be considered. These scenarios include different household sizes that may occupy a building over its lifespan and their corresponding occupant behaviors. In addition, climate scenarios are included and cover a reference climate and future climate change. Policy changes such as feed-in tariff prices for net-metering are also considered. Similarly, performance indicators that are relevant to the decision makers need to be defined. For instance, a policymaker prioritizes a building design with low or no CO2 emissions, but not at the expense of high investment costs. In contrast, a homeowner prioritizes designs with comfortable indoor environment at low cost. Hence, CO2 emissions and investment costs are the preferred performance indicators for the policymaker, while indoor environment quality and costs such as investment, operating costs etc. are the preferred performance indicators for the homeowner.
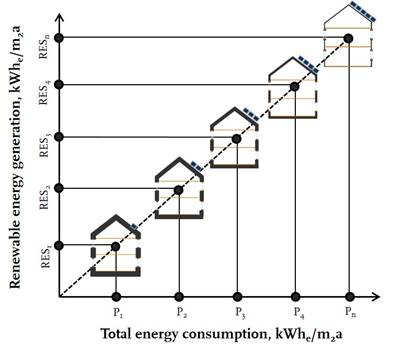
Figure 3. NZEB designs with different insulation packages (energy consumption) and corresponding onsite renewable energy generation and storage systems (energy generation).
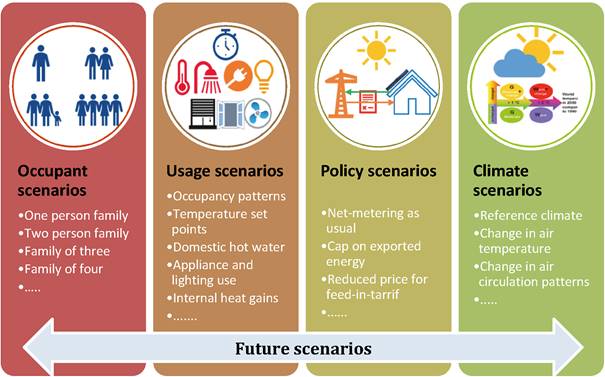
Figure 4. Scenarios formulated based on uncertainties in
(future) household size and range of occupant behavior, climate change and policy changes.
Step 2: Set up a building performance simulation model and simulate the performance, based on the defined performance indicators, of the design space for all future scenarios.
Step 3: Carry out a multi-criteria performance assessment considering multiple performance indicators and their corresponding robustness. In the current approach, in order to calculate robustness, we exploit the concept of minimax regret method [12]. In this method, for a given scenario, performance regret is the performance difference between a design and the best performing design in that scenario. Ultimately, maximum performance regret is used as the measure of performance robustness in this approach. In simple terms, the maximum performance regret of a design across all scenarios is the measure of its robustness. This multi-criteria assessment enables different decision makers to choose robust designs from a large design space based on their preferred performance indicators and corresponding robustness.
Step 4: Select robust designs for the decision maker by prioritizing the performance indicators based on his/her preferences. The design that has optimal performance and the lowest maximum performance regret is the most robust [13].
In the next section, using five NZEB designs it is demonstrated how this methodology can be used by designers to aid decision makers in the design phase to identify robust designs.
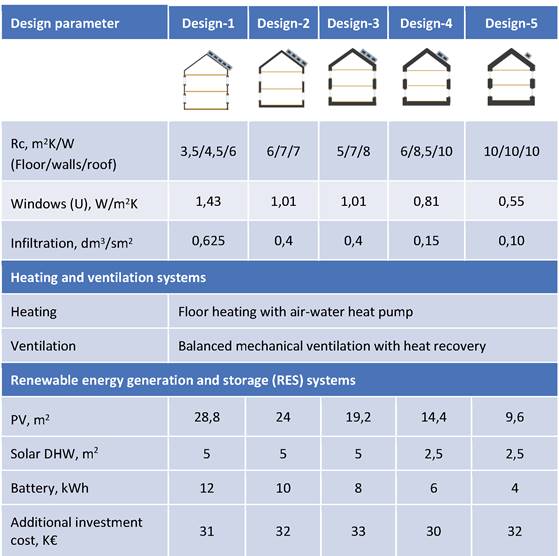
A semi-detached terraced house, a typical Dutch residence [9], was chosen as the case study building. It is a three-story building with a gross surface area of 124 m² and a treated floor area of 104 m². The building is heated using a floor heating system with an air-water heat pump and is ventilated using a balanced mechanical ventilation system with heat recovery. The heat pump capacity for each design is optimally sized by minimizing underheating hours. To reduce overheating during summer, natural ventilation (free cooling) by opening windows is used instead of mechanical cooling. Windows are shaded by external devices, which are controlled based on indoor temperatures and radiation levels on the window surfaces (see Table 1). Domestic hot water (DHW) needs are met by a solar domestic hot water system with an auxiliary heater. It is an all-electric building and the total electricity consumption for heating, ventilation, DHW system, lighting, and appliances of the building is met by an onsite photovoltaic (PV) system. A battery based energy storage system is used to reduce the building’s dependency on the grid.
Step 1: Identify homeowner’s and policymaker’s preferences and define the design space, scenarios and performance indicators
A homeowner prefers a robust design that delivers a comfortable indoor environment with low operational and investment costs. Overheating hours, which are based on adaptive temperature limits proposed by [14], is used for thermal comfort assessment. Total costs, which comprise investment, replacement, operational and maintenance costs, are used to assess the financial implications of design [11]. Since they are the same for all designs, fixed costs such as land, labor etc. are not considered in this study. Operational costs are calculated based on net-energy consumption using the current energy prices in the Netherlands. It is worth noting that the effect of net-metering is also considered in the calculation of operating costs. These costs are calculated for a 30-year period. To calculate net-present value (NPV), these costs are discounted considering inflation rates and real interest rates.
A policymaker prefers a robust design that has low CO2 emissions with low investment costs to enable the policy of providing subsidies for the implementation of CO2 reduction measures for end users. CO2 emissions are calculated based on net electricity consumption. An emission factor of 0,540 kgCO2 per kWh of electricity consumption is used to calculate CO2 emissions [15].
The NZEB design space is defined, as shown inTable 2, by varying envelope properties such as insulation levels, infiltration rates, and window type etc. so that the resulting designs meet a range of applicable standards. Current Dutch building standards are realized in Design-1, Dutch zero energy building standards are realized in Design-2, Design-3 and Design-4 and a passive house standard can be realized in Design-5. Renewable energy and storage (RES) systems such as PV, solar DHW systems and an electric battery based storage system are added to these designs to make them NZEB.
Occupant scenarios
are formulated based on Dutch household statistics. These scenarios cover
different household sizes ranging from a single person family to a multi-person
family of four. For each of the occupant scenarios, usage scenarios are
formulated based on energy usage and activity in the building. These usage
scenarios span very careful energy users to energy-wasting users, and cover different types of equipment
with low to very high efficiencies. For usage scenarios, occupancy patterns,
heating setpoint temperatures, lighting and appliance use, ventilation rates,
domestic hot water consumption and shading control are varied (see Table 1).
Two climate scenarios are considered. One is a typical climate reference year,
NEN 5060, which is based on average months of 20 years of historical weather
data. Another is a climate change scenario, W+, which represents an extreme
case of an increase of temperature of +2°C in 2050 relative to 1990. In the current
policy, the energy imported and exported are equally priced if the net annual
energy balance is zero. If excess energy is exported, it is priced at 0,07€/kWh.
However, since so many buildings have taken advantage of this option to sell
excess energy to the grid, the grid is often oversupplied and under great
stress in summer months. Therefore, it seems probable that this current
net-metering pricing model will be terminated in the future [17] and hence, net-metering scenarios are
formulated that represent business as usual and the termination of the current
net-metering policy. The combinations of all these scenarios are used for the performance
robustness assessment.
Step 2: Set up building performance simulation model
In
order to predict thermal and energy performance of the designs (Table 2),
a detailed building and energy systems simulation model was developed in the TRNSYS
simulation tool. This model is coupled with Mode Frontier, an optimization
tool, to carry out the assessment of the design
space for all combinations of considered scenarios (Table 1).
Performance of the design space is assessed withmultiple performance indicators such as overheating
hours, NPV of costs, CO2 emissions and their corresponding robustness.
Table 1. Future scenarios considered in this case study.
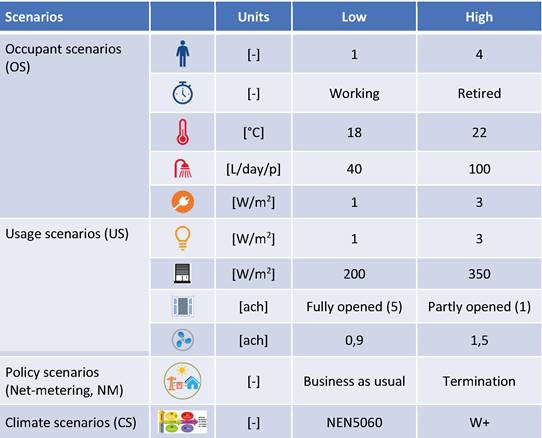
Table 2. Details of NZEB designs considered in this case study.
Step 3: Multi-criteria performance assessment
Figure 5 shows variation of overheating hours and corresponding regrets of five designs across the considered scenarios. Each box plot represents a design and the spread of the boxplot of a design results from the considered scenarios. It can be observed from Figure 5 that all designs results in similar overheating (length of box) in most of the scenarios, except for extreme scenarios. Therefore, it is difficult to choose a preferred design among these designs based on actual performance. However, by using overheating regret hours it is easy to distinguish between the performance robustness of these designs. For instance, design-1 has the least overheating regret hours among all designs as it has lower overheating hours for most of the scenarios than other designs. Similarly, design-2 and design-3 have comparable variations in overheating hours, but design-2 has lower overheating regret hours as it is more optimal than designs-3 for all scenarios. It is noteworthy that design-1 results in overheating of about 940 hours for extreme scenarios. However, regret of overheating hours of this design is close to zero which indicates that design-1 performs better than the other considered designs even for extreme scenarios. Therefore, design-1 is the most robust NZEB among the selected designs. It can also be observed that the risk of overheating increases with higher insulation levels. The design with a highly insulated and airtight building envelope (design-5) is more prone to overheating risks and is, thus, least robust to overheating.
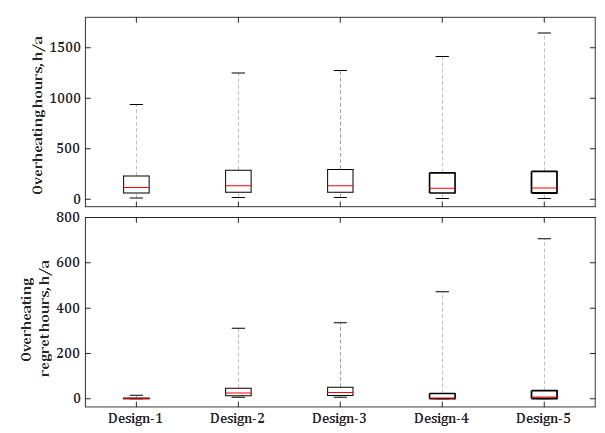
Figure 5. Variation of overheating hours and corresponding regrets of designs for all scenarios for the homeowner.
The performance of these designs depends on the considered scenarios. For instance, variations in overheating and corresponding regrets increase in all high scenarios, except for the net-metering scenarios, as observed in Figure 6. These variations are shown here by pooling all low and high values of each scenario separately. For instance, the spread of the box for the low occupant scenarios includes all scenario combinations that have low occupancy. It can be observed from Figure 6 that the climate scenarios are the most influential, as the reference climate causes the least overheating and climate change in future causes most overheating. It is inevitable that overheating increases with more number of occupants as observed in the case of the high occupant scenario. This increase in overheating is attributed to rise in heat gains due to the presence and activity of occupants. Usage scenarios also have a considerable influence on overheating. It was found that internal heat gains, window opening, shading and ventilation were particularly influential scenarios. Proper shading control and higher ventilation rates through either ventilation systems or by opening windows can reduce overheating significantly and improve a design’s robustness to overheating as observed in the low usage scenarios (see Figure 6). It is worth noting that high scenarios of occupants, usage and climate result in the maximum performance regret of overheating. Usage scenarios and climate scenarios are the most influential on a design’s robustness to overheating.
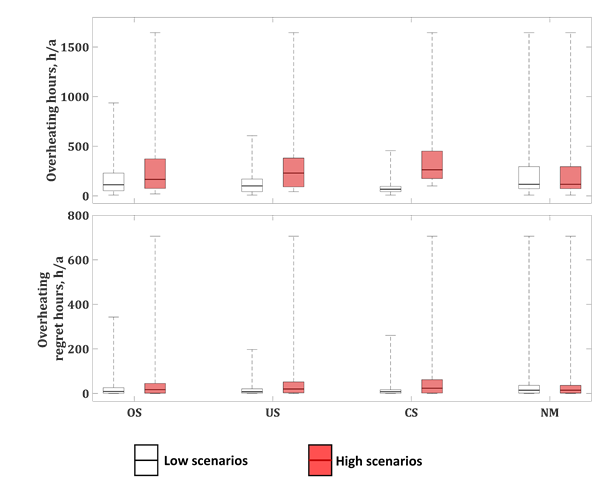
Figure 6. Variation of overheating and corresponding regrets for low and high scenarios. The white box plots represent low scenarios and red box plots represent high scenarios for the homeowner.
Figure 7 shows variation of NPV of costs and corresponding regrets of five NZEB designs across the considered scenarios. It can be observed that design-1 has large variations in costs across all considered scenarios. However, this design has zero regrets of costs for few scenarios, which indicates that design-1 is optimal for these scenarios. Similarly, design-2 and design-3 have comparable variations in costs, but design-3 has less regrets as it is more optimal than design-2 for all scenarios. Therefore, design-3 is more robust than design-2. Design-4 has the lowest maximum regrets of costs and is, thus, the most robust among the five designs. In contrast to overheating, designs with higher insulation levels and small RES systems have low NPV of costs and corresponding regrets. This contrast is attributed to operational costs among other factors. Operational costs are less dependent on the size of RES system, in the case of the termination of net-metering, as the excess energy exported to the grid does not lower operational costs. Therefore, design-1 with the larger RES system results in higher regrets of costs than the other designs. Contrariwise, when net-metering is present, the design with larger RES system (design-1) has lower regrets of costs compared to that of the design with a smaller RES system (design-5), as observed in Figure 7. For all scenarios, design-4, which has higher insulation levels than design-1 and a smaller RES system than design-5 has the lowest maximum performance regret of NPV of costs. Therefore, an optimal balance between insulation levels and size of RES system is important to achieve a cost optimal robust NZEB, which is design-4.
Net-metering is the most influential scenario on NPV of costs (see Figure 8). In the case of net-metering termination, there is a significant increase in the costs and corresponding regrets. It is intriguing that due to climate change the costs are lower in the future compared to the reference climate. This difference is attributed to reduction in heating energy demand for the climate change scenario. It is noteworthy that there is an increase in costs for bigger households, but regrets of NPV of costs are lower, which is probably due to an increase in renewable energy utilization.
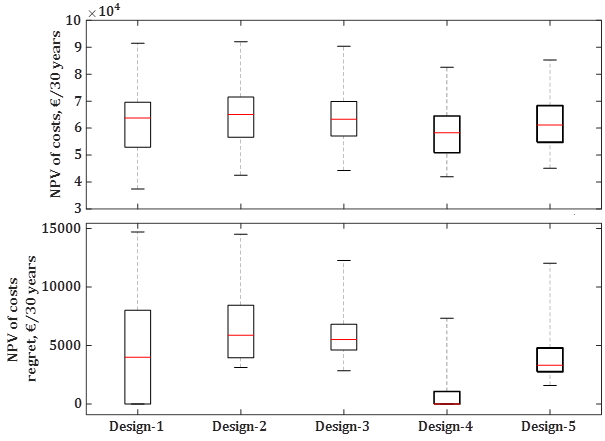
Figure 7. Variation of NPV of costs and corresponding regrets of designs for all scenarios for the homeowner.
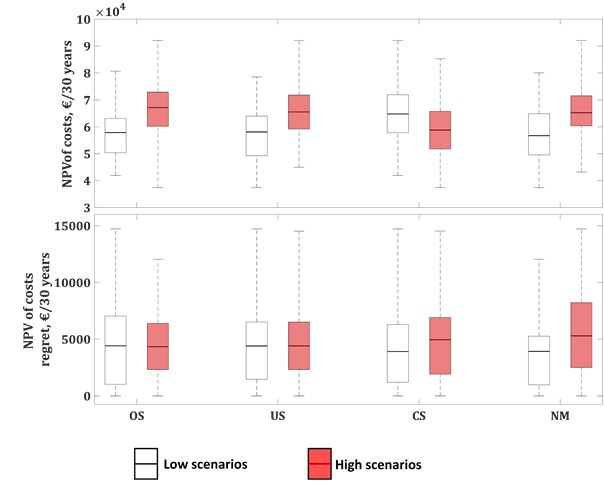
Figure 8. Variation of NPV of costs and corresponding regrets for different low and high scenarios for the homeowner. The white box plots represent low scenarios and red box plots represent high scenarios.
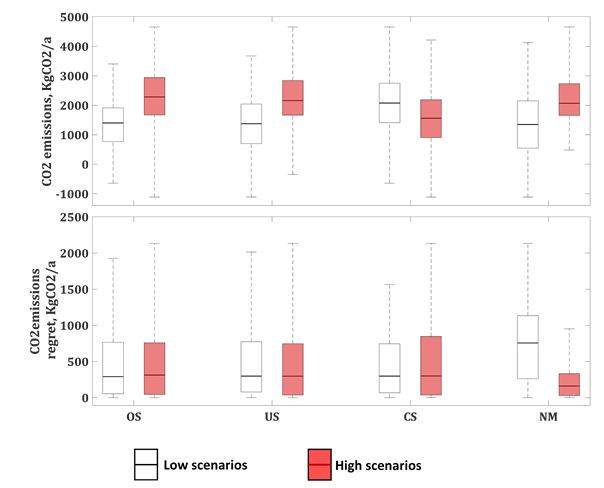
It can be observed from Figure 9 that design-1 has large variations of CO2 emissions, but has lower variations in CO2 emissions regrets compared to other designs. This is because design-1 performs better than other designs for most of the scenarios. However, design-2 has the lowest maximum regrets of CO2 emissions and is, thus, the most robust among the five designs. The designs with low insulation levels and larger RES systems (design-1 and design-2) are found to be more robust than designs with high levels of insulation and smaller RES systems (design-3 - design-5). CO2 emissions are higher for all high scenarios, except for climate scenarios (see Figure 10). This difference for climate scenarios is attributed to a reduction in heating energy demand due to increased temperatures. In contrast, CO2 emission regrets increase in the climate change scenarios. This increase in CO2 emission regrets is because of the large performance deviation between the designs in the climate change scenario and the reference climate. It is worth noting that termination of the net-metering policy results in higher CO2 emissions but in very low CO2 emission regrets. This reduction in CO2 emission regrets is attributed to deviation between the performances of the designs from the optimal performance, which is very low in the case of net-metering termination. In contrast, this deviation is higher for the net-metering scenarios. For instance, design-1 is optimal and the performance deviation of other designs from this optimal performance is higher in the case of termination of net-metering. On the other hand, design-2 is optimal for the net-metering scenario and the performance of other designs is not far from this optimal performance, and, thus, these other designs result in lower regrets. It is noteworthy that the designs with larger RES systems are optimal for these scenarios as the renewable energy utilization is higher for these designs.
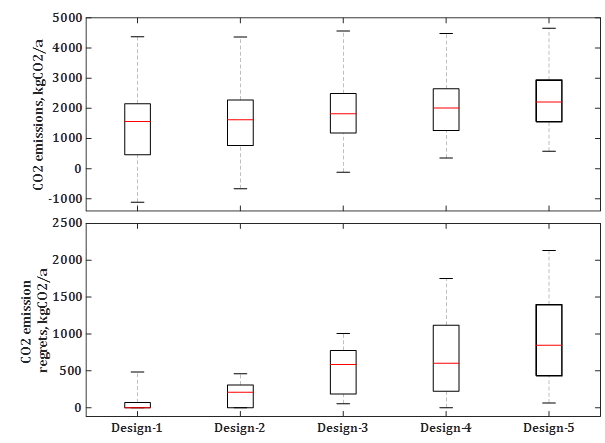
Figure 9. Variation of CO2 emissions and corresponding regrets of designs for all scenarios for the policymaker.
Figure 10. Variation of CO2 emissions and corresponding regrets for different low and high scenarios for the policymaker. The white box plots represent low scenarios and red box plots represent high scenarios.
Step 4: Multi-criteria decision-making
If a homeowner prioritizes costs and accepts certain overheating hours as a trade-off, then design-4 is the preferred robust NZEB design, as can be seen in Figure 7. Furthermore, design-4 has close to zero overheating regret hours for most of the scenarios. However, if a homeowner prefers to reduce overheating, then design-1 is the most preferred robust design as it has close to zero overheating regret hours (see Figure 5). That said, design-1 incurs an extra NPV of costs up to 8900€ as a result of the trade-off to reduce overheating regrets of about 456h/a compared to design-4. To reach a compromise, design-3 is the most preferred robust design, as it has lower maximum regret of NPV of costs compared to design-1 and lower maximum regret of overheating compared to design-4. However, the preferred robust design depends on required additional investment cost, but, since the difference in additional investment costs across the designs is a maximum of 3K€ (see Table 2), it is too small to have an impact on the design decision making.
Similarly, a policymaker would prefer design-2, as can be observed from Figure 9, as it has the lowest maximum CO2 emissions regret. However, for most of the scenarios, design-1 is more robust compared to design-2. The maximum regret of design-1 is slightly higher than design-2 which is caused by an extreme scenario. If the policymaker is willing to accept this risk, then design-1 is more preferred. To choose a robust design for both homeowner and policymaker, all the preferred performance indicators of both decision makers and their corresponding robustness should be taken into account. The preferred robust design for both homeowner and policymaker is design-1 as it is robust to overheating hours (see Figure 5) and CO2 emissions (see Figure 9) and also has zero regrets of costs for few scenarios (see Figure 7).
This methodology, as demonstrated, can be used by designers to aid decision makers in the design phase to select robust NZEB designs that deliver the preferred performance in future operation. Using this methodology, a decision maker can prefer a robust design by prioritizing a particular performance indicator and can trade-off the performance and robustness of other performance indicators. As demonstrated in the case study, it is easier to distinguish between the designs based on robustness than on actual performance. This visualization is instrumental in allowing stakeholders to make informed choices, especially when a design has to be selected from a large design space and multiple performance requirements are considered. This case study shows that buildings with higher insulation levels are prone to overheating and that achieving an optimal balance between insulation levels and size of energy system is essential to achieve a cost optimal robust NZEB for the homeowner. Buildings with low insulation levels and larger RES systems are found to be more robust for the policymaker.
[1] EPBD, Directive 2010/31/EU of the European
Parliament and of the Council of 19 May 2010 on the energy performance of
buildings (recast), Off. J. Eur. Union. (2010) 13–35. doi:10.3000/17252555.L_2010.153.eng.
[2] T. Maier, M. Krzaczek, J. Tejchman,
Comparison of physical performances of the ventilation systems in low-energy
residential houses, Energy Build. 41 (2009) 337–353.
doi:10.1016/j.enbuild.2008.10.007.
[3] P. De Wilde, The gap between predicted and
measured energy performance of buildings: A framework for investigation, Autom.
Constr. 41 (2014) 40–49. doi:10.1016/j.autcon.2014.02.009.
[4] G. Mavrotas, J.R. Figueira, E. Siskos,
Robustness analysis methodology for multi-objective combinatorial optimization
problems and application to project selection, Omega. 52 (2015) 142–155.
doi:10.1016/j.omega.2014.11.005.
[5] C.J. Hopfe, G.L.M. Augenbroe, J.L.M. Hensen,
Multi-criteria decision making under uncertainty in building performance
assessment, Build. Environ. 69 (2013) 81–90.
doi:10.1016/j.buildenv.2013.07.019.
[6] C. Struck, J.L.M. Hensen, Scenario Analysis
for the Robustness Assessment of Building Design Alternatives – a Dutch Case
Study, (2013) 939–944.
[7] S. Polasky, S.R. Carpenter, C. Folke, B.
Keeler, Decision-making under great uncertainty: Environmental management in an
era of global change, Trends Ecol. Evol. 26 (2011) 398–404. doi:10.1016/j.tree.2011.04.007.
[8] R. Kotireddy, P. Hoes, J.L.M. Hensen,
Optimal balance between energy demand and onsite energy generation for robust
net zero energy buildings considering future scenarios, Proc. IBPSA Conf. (2015).
[9] RVO, RVO BENG referentiegebouwen,
(2016). doi:http://www.rvo.nl/initiatieven/energiezuiniggebouwd/hoekwoning-m.
[10] RVO, Hernieuwbare
Energie in Bijna Energieneutrale Gebouwen (BENG), (2015).
[11] BPIE, Cost Optimality - Discussing methology
and challenges within the recast EPBD, (2010) 40.
[12] L. Savage, The Theory of Statistical Decision,
J. Am. Stat. Assoc. 46 (1951) 55–67.
[13] R. Kotireddy, P. Hoes, J.L.M. Hensen,
Simulation-based comparison of robustness assessment methods to identify robust
low energy building designs, in: Proc. IBPSA Conf. Sanfransisco, USA, 2017.
[14] L. Peeters, R. de Dear, J.L.M. Hensen, W.
D’haeseleer, Thermal comfort in residential buildings: Comfort values and
scales for building energy simulation, Appl. Energy. 86 (2009) 772–780.
doi:10.1016/j.apenergy.2008.07.011.
[15] G. Papachristos, Household electricity consumption and CO2 emissions in the Netherlands: A model-based analysis, Energy Build. 86 (2015) 403–414. doi:10.1016/j.enbuild.2014.09.077.
Follow us on social media accounts to stay up to date with REHVA actualities
0