


Stay Informed
Follow us on social media accounts to stay up to date with REHVA actualities
|
|
|
L. Kooi | A.K. Mishra | M.G.L.C. Loomans |
Department of the Built Environment, Unit
Building Physics and Services, Eindhoven University of Technology, Eindhoven,
the Netherlands | Department of the Built Environment, Unit
Building Physics and Services, Eindhoven University of Technology, Eindhoven,
the Netherlands | Department of the Built Environment, Unit Building Physics and Services,
Eindhoven University of Technology, Eindhoven, the Netherlands |
L. Pennings | J.L.M. Hensen | |
Strukton Worksphere, the
Netherlands | Department of the Built Environment, Unit
Building Physics and Services, Eindhoven University of Technology, Eindhoven,
the Netherlands |
Existing
guidelines on monitoring of Indoor Climate Quality (ICQ) do not adequately
address long term monitoring. A better understanding of the collection and
analysis of monitored data, extending over a long-time period is required. This
study aimed at addressing the aforementioned research gaps. The study took
place in two office buildings, during two periods each: February & May
(case I) and April & June (case II). Thermal environment data was obtained
across several locations in the room. Results showed that measurement of
temperature was most critical in the open-plan office floors. Local heat
sources had a significant influence on the measured temperatures. To collect
representative data with the help of building management system (BMS) sensors,
existence and fluctuation of local heat sources should be considered at the
start of the ICQ assessment. Based on this information, the minimal distance
between BMS sensor and workplace location can be determined. In the design
process, the field study protocol can be used as a tool to predict the number
of sensors and distance from occupants.
Recent
studies have put focus on the importance of monitoring buildings during their
operation and maintenance phases [1–4]. The body of data obtained through such
monitoring provides essential information about a building’s energy consumption
and Indoor Climate Quality (ICQ) and can be used to control and optimize its
performance [1–3,5]. The accuracy and applicability of the conclusions from the
gathered data depends on the quality of the data (reliability) gathered and
data interpretation (data-analysis) [6]. Compared to energy consumption and
service control, ICQ monitoring is less addressed. Current standards like ISO
7730 [7], NEN-EN 15251 [8], ANSI/ASHRAE standard 55 [9] and Dutch ISSO
guidelines also do not provide details for long-term ICQ monitoring [6,10–12].
Drawing uninformed conclusions during monitoring and analysis may affect the
comfort perception, well-being, and productivity of occupants [8,12–14] and
building energy use [6,8,15]. Reliability of the ICQ data is strongly dependent
on sensor location. Sensor location is usually chosen in accordance with
guidelines, as from ISSO publication 31 [16]. However, such guidelines are
cursory, making ICQ assessment at a detailed level a topic in need of
comprehensive investigation. For this reason, the current work investigates the
influence of the location of the building management sensor on its measurement
and recommendations were formulated for long-term monitoring needs.
Indoor
climate of two existing open-plan offices in the Netherlands were monitored,
during two periods each (Table 1). Both environments are
ventilated, cooled and heated by an induction system and regulated by one BMS
sensor located on the wall (at 1.5 m height from floor). The BMS sensor
records indoor temperature and relative humidity every five minutes. Data from
the BMS sensor is analysed with the help of a data platform [17]. In both case
studies is the data platform developed by the same company, to oversee
buildings remotely and to optimize their maintenance. In both locations,
occupants have the possibility to effect small changes to air temperature by
local thermostats and are able to avoid direct sunlight by using indoor
sunscreens. There was no outdoor sun protection.
Table 1.
General information about the case studies. (Measurement period 1 and 2 are
defined as M1 and M2).
Case | Year of construction | Location | Surface area [m²] | Max. # occupants | Parameters BMS sensor | M1 | M2 |
Case A | 2010 | Son | ~140 | 41 | -Exposed temp | Feb | May |
Case B | 1956 | ‘s-Hertogenbosch | ~620 | 68 | -Exposed temp -Relative humidity | Apr | Jun |
Indoor
climate data from different locations in the open-plan work environment was
collected and compared with the data from the data platform to assess
differences in ICQ over the whole floor. The measurement locations have been
given in Figure 1 and Figure 2. At
the start of the measurement period, the measurement equipment was calibrated
and the BMS sensors’ measurements were compared against the calibrated
equipment to avoid discrepancies.
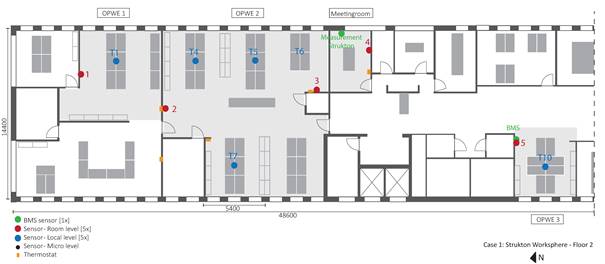
Figure 1.
Floor plan second floor of Case A. In the gray
accented areas, objective measurements were performed (Open-plan work
environments 1, 2 and 3 and Meetingroom).
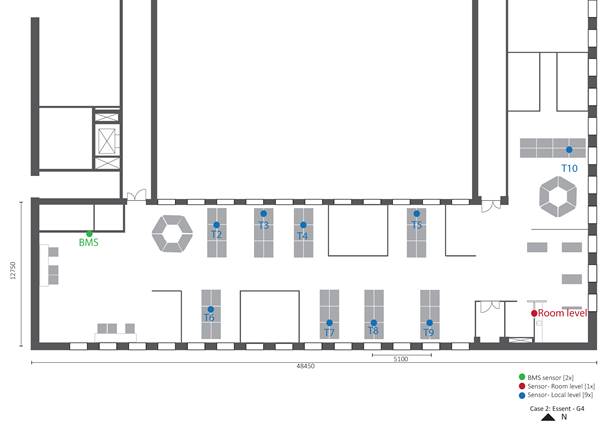
Figure 2.
Floor plan for observed area of Case B. The BMS sensor is located in the left corner.
An extra room sensor was placed on the right side of the floor. The sensors at
local level are illustrated in blue.
Objective
measurements were undertaken at three levels: room level, local level and micro
level (Figure 3). The room level gave insight to the overall
conditions of the room and was measured with the help of two kinds of sensors:
‘BMS sensor’ and ‘room sensor’. Room level sensors were placed according to the
Dutch guidelines [16,18]. At this level, air temperature, relative humidity and
CO2-concentration were determined every 2 minutes
using transmitters (Table 2). Since the recorded air
temperature may be affected by radiant sources and may not provide a measure of
solely the air temperature, we refer to the measured values as ‘exposed temperature’ (ET).
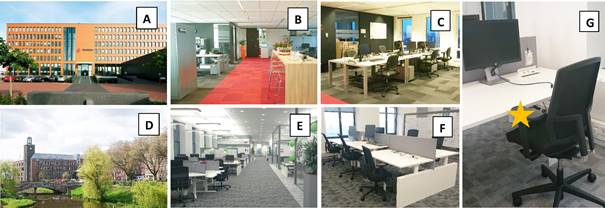
Figure 3.
Images from Case B (a-c) and Case A (d-f), depicting the buildings and the
different localities of monitoring: b) & e) room level, c) & f)
local/desk level. The micro environment for temperature measurements is
depicted in g) where the star marks sensor location.
Local level
thermal conditions around workstations were measured in the same way as the
room level. At this level, the sensors (GD47 transmitter) were placed near each
workplace group, at a height of 1.1 m above the floor. Micro level
measurements focused on individuals, i.e., the thermal condition around a
person. On each measurement day, four to six of the participants who had
volunteered to be a part of the study were selected to represent random
location on the floor-plan. IButtons (DS1921, Maxim)
were placed next to the chair of the participant, where they recorded ET every
minute. The best location for the iButton was
explored through a set of preliminary measurements to limit the influence of
the body heat.
Table 2. Overview of the measurement equipment.
Measurement | Device | Type | Accuracy | |
Room level & Local level | T/RH/CO2 sensor | Eltek GD47 Transmitter | Temp. |
|
RH |
| |||
CO2 |
| |||
Data logger | Grant SQ 1000 series | - |
| |
Micro level | iButton | Maxim DS1921 | Temp. |
|
The
collected data was collated using Matlab (R2016b).
IBM SPSS Statistics 23 was used for statistical analysis. Only data
corresponding to working hours (8:00 AM-06:00 PM) was processed. Preliminary
analysis showed the indoor conditions did not correlate with outdoor weather
conditions, and hence observations for both periods were analysed together. The
two buildings were examined separately. Statistically significant differences
were examined with the Mann-Whitney U test. Significance was tested at 5%
level. Correlations were determined by the ‘Pearson product
moment correlation’.
Data from room, local and micro level were compared
and linked to the BMS data. In both case studies, differences in CO2-concentration
and relative humidity between the room sensor and local sensor were relatively
small and no practically significant difference between the measured values
could be found. Based on these results it may be concluded that the original
BMS sensor location could provide representative data related to the CO2-concentration and relative humidity for the examined
open plan spaces.
However,
variation of ET through the open-plan work environments was significant. The
results have been plotted in cumulative frequency distribution (CFD) graphs (Figure 4).
Differences between sensors are smaller when data behaves in a similar pattern
and plotted lines had a similar temperature range. In the best case, the
difference between the BMS data and the rest of the monitoring levels are
limited, so that BMS data is representative of the local conditions.
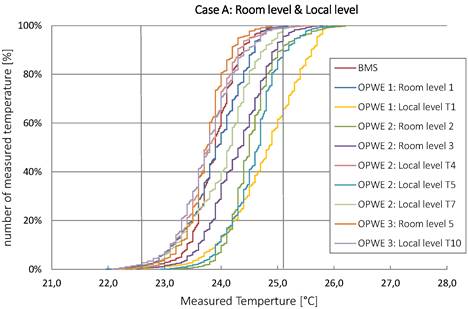
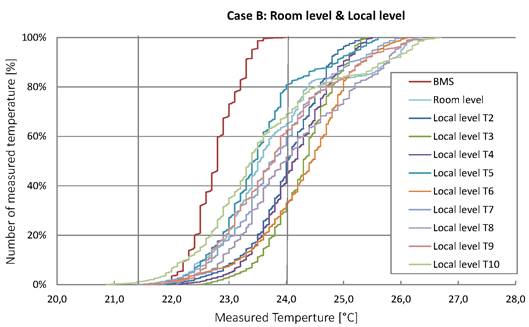
Figure 4.
CFD-graph from room level (top) and local level (bottom) of Case A & Case
B. The graph shows the distribution (smallest to largest) and frequency temperature
range of each sensor. The temperature range of the BMS sensor is illustrated
with the vertical lines.
For most
cases, the local ET exceeded BMS measurements by 1°C or
more. The only exception was for OPWE 3 at Case A (Figure 1). We
believe the differences in the ETs were mainly due to local heat sources, for
example, the occupants, computers, and solar radiation through windows.
Therefore, the distance between BMS sensor and workplaces is important when it
comes to reliability of the measurements. In both locations, the BMS sensors
were more than 3 m away from occupied workplaces. When distance between room
level and local level sensors were less than 3 m, the differences in
recorded ETs were minimal. For instance, in OPWE 3 of Case A, the BMS sensor
was within 2 m of the work stations. No significant difference could be
found between the ETs at local level and BMS. The impact of the distance
between sensors is clarified using correlations between the BMS, room, local
and micro sensors. Table 3 and Table 4 show
the correlations for both case studies. In Case B, larger distance between
sensors resulted in weaker correlations (Figure 5).
Better correlation may thus be achieved between local and BMS ETs by using a
larger number of BMS sensors, spread across the open plan workspace. Notice for
example in Table 3 that the room sensor position has a
stronger correlation with local & micro level than the BMS position. Thus,
a minimum number of BMS sensors are required in order to have a representative
indication of the ICQ.
For Case A,
because the floor has been divided into multiple spaces (OPWE 1, 2 & 3 and
Meeting room) the situation was different. Regardless of the distance between
sensors, the sensor located in a different space always had a weak correlation
with the BMs sensor (r < 0.306, p < 0.05) (Figure 6). To
collect representative thermal data in Case A, a BMS sensor would be required
for each space. Adding extra room sensors increases the strength of the
correlations in both cases, where the closest room sensor has the strongest
correlation with the relevant local and micro sensor. Overall, ET at room level
(BMS sensor and room sensors) was better correlated to ET at local level than
the temperature at mirco level.
Table 3.
Pearson product moment correlation BMS-Room-Local-Micro (Case B) for four local
situations, here p < 0.001. The distance between sensors has
influence at the strength of the correlation (T4 strongest correlation with the
BMS sensor, T10 weakest correlation). Moreover, a weaker correlation is found
on the south side of the floor plan, due to solar radiation (T6).
Table | BMS senor | Room sensor | Local sensor | |||
T4 | BMS ~ Local T4 | 0.847 | Room ~ Local T4 | 0.717 | ||
BMS ~ Micro T4 | 0.434 | Room ~ Micro T4 | 0.685 | Local T4 ~ Micro T4 | 0.755 | |
T6 | BMS ~ Local T6 | 0.687 | Room ~ Local T6 | 0.678 | ||
BMS ~ Micro T6 | 0.512 | Room ~ Micro T6 | 0.655 | Local T6 ~ Micro T6 | 0.624 | |
T8 | BMS ~ Local T8 | 0.657 | Room ~ Local T8 | 0.881 | ||
BMS ~Micro T8 | 0.634 | Room ~ Micro T8 | 0.704 | Local T8 ~ Micro T8 | 0.868 | |
T10 | BMS ~ Local T10 | 0.095 | Room ~ Local T10 | 0.891 | ||
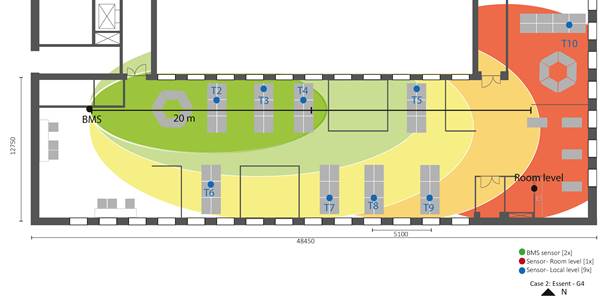
Figure 5.
The influence of distance between sensors and solar radiation for the
correlation between the BMS sensor and local sensors.
The
relation with micro level was more complex. Only 65% of the correlations (local
with micro) were of a high enough value (Table 3 & 4).
Due to the large differences in micro ET for each table and each person, no
reliable relationship or trend could be found. Accurate measurements at micro
level are dependent on several parameters. For instance, the activity of the
person sitting in the chair, the position of the chair and distance to local
heat sources can be important information to explain differences in micro
measurements.
Table 4.
Pearson product moment correlation BMS-Room-Local-Micro (Case A) for three
local situations. Here p < 0.001.
Table | BMS senor | Room sensor | Local sensor | |||
T1 | BMS ~ Local T1 | 0.306 | Room ~ Local T1 | 0.855 | ||
BMS ~ Micro T1 | 0.401 | Room ~ Micro T1 | 0.357 | Local T1 ~ Micro T1 | 0.352 | |
T5 | BMS ~ Local T5 | 0.267 | Room ~ Local T5 | 0.728 | ||
BMS ~ Micro T5 | 0.279 | Room ~ Micro T5 | 0.479 | Local T5 ~ Micro T5 | 0.492 | |
T10 | BMS ~ Local T10 | 0.955 | Room ~ Local T10 | 0.941 | ||
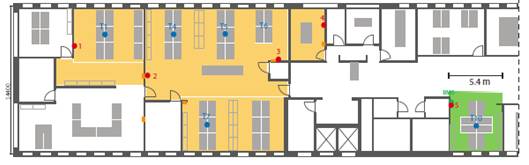
Figure 6.
The correlation is weak when sensors are not located in the same room
(regardless of the distance between sensors.
Though
quantitative conclusions from this study are case specific, certain qualitative
conclusions regarding objective data measurement for indoor climate quality
monitoring may be provided. In order to have a representative indication of the
ICQ, the maximum distance between sensors should be considered during design of
the monitoring system. The number of sensors depends on the floor plan design
specifically, obstacles and boundaries. The number of sensors can be optimized
by test measurements on different measurement levels.
The spacing
of sensors can also be affected by local heat sources as they can influence the
ET. If local heat sources, such as occupancy and solar radiation, are
relatively consistent, CO2-concentration, relative
humidity, and ET can be determined at room level with a distance of 3 m to
the workplaces, assuming the ventilation system is effective. Moreover, a
higher frequency for recording data would be recommended to register
fluctuations in ET. In Case A and Case B, local heat sources cannot be ignored
in the comfort analysis due to changing occupancy and lack of outdoor shading.
Hence, for these office spaces, BMS sensors need to be placed at a closer
distance (< 3 m) to workstations.
This study
provides results from field measurements that can aid decision making regarding
the position of BMS sensors and the collection of objective data in open-plan
offices. Results of the objective measurements show little differences in CO2-concentration and relative humidity between BMS, room
and local sensors. A larger difference is found for ETs. The existing BMS
sensors did not yield a representative indication for the complete floor space
when it came to ET. Local heat sources and distance between sensors have a
significant influence on the measured value of ET. These parameters need to be
considered during design of the monitoring system. Floor plan (enclosed spaces,
obstacles, and floor area) and the existence and fluctuation of local heat
sources influence sensor positioning requirements. The field study protocol as
described in this method is useful for determining
monitoring level and sensor separation.
As results
of this study are based on just two office buildings with an induction system
under specific weather conditions, it is recommended to further develop the
application of the method in more varied office settings, occupant
demographics, and outdoor weather conditions to further the conclusions and
recommendations formulated herein.
Cooperation
of all the occupants during the measurements is acknowledged gratefully. Our
thanks to Wout van Bommel
for the help and cooperation with the field measurements.
[1] A. Heller, M. Uhd,
P. Fischer-Nilesn, J.K. Frederiksen, H. Juhler-Verdoner, E. Hansen, B. Torntoft,
T. Kiar, H. Kronborg, F.
Petersen, J. Andreasen, N.J. Andersen, S. Kuehn, K.E. Eriksen, P. Sattrup, S. Konmgebro, J. Norgaard, Smart Buildings; Combining energy efficiency,
flexibility and comfort, 2015. https://stateofgreen.com/en/profiles/state-of-green/news/new-smart-buildings-white-paper-published.
[2] T. Ruponen,
Improving energy performance of buildings through exploitation of available
data, Aalto University, 2016.
[3] A. Mahdavi, M. Taheri, An ontology for
building monitoring, Build. Perform. Simul. 0 (2016) 1–10.
[4] D. Raimondo, S.P. Corgnati,
B.W. Olesen, M. Filippi, Indoor and Energy quality
assessment in buildings, University of Turin, 2012.
[5] P. Huovila, A. Lupisek, P.H. Lefebvre, P. Steskens,
Indoor Performance and Sustainability; Monitoring and evaluation, in: European
commission, 2010: pp. 557–564.
[6] D. Heinzerling, S.
Schiavon, T. Webster, E. Arens, Indoor environmental
quality assessment models: A literature review and a proposed weighting and
classification scheme, Build. Environ. 70 (2013) 210–222.
[7] ISO, ISO 7730, Ergonomics of the thermal
environment; Analytical determination and interpretation of thermal comfort
using calculation of the PMV and PPD indices and local thermal comfort
criteria, International Organization for Standardization, 2005.
[8] CEN, NEN-EN 15251; Indoor environmental
input parameters for design and assessment of energy performance of buildings
addressing indoor air quality, thermal environment, lighting and acoustics,
Brussels, 2007.
[9] ASHRAE - ANSI/ASHRAE Standard 55-2013,
Thermal environmental conditions for human occupancy, American Society of
Heating, Refrigerating and Air-Conditioning Engineers, 2013.
[10] P. De Wilde, The gap between predicted and
measured energy performance of buildings: A framework for investigation, Autom. Constr. 41 (2014) 40–49.
[11] G. Augenbroe, C.-S.
Park, Quantification methods of technical building performance, Build. Res.
Inf. 33 (2005) 159–172.
[12] J.H. Choi, V. Loftness,
A. Aziz, Post-occupancy evaluation of 20 office buildings as basis for future
IEQ standards and guidelines, Energy Build. 46 (2012) 167–175.
[13] P.M. Bluyssen, Towards new methods and ways to create healthy and
comfortable buildings, Build. Environ. 45 (2010) 808–818.
[14] A.K. Mishra, M.G.L.C. Loomans,
J.L.M. Hensen, Thermal comfort of heterogeneous and
dynamic indoor conditions — An overview, Build. Environ. 109 (2016)
82–100.
[15] A.I. Dounis, C. Caraiscos, Advanced control systems engineering for energy
and comfort management in a building environment-A review, Renew. Sustain.
Energy Rev. 13 (2009) 1246–1261.
[16] ISSO - publicatie
31, Meetpuntenenmeetmethodenvoorklimaatinstallaties, Kennisinstituutvoorinstallatietechniek,
1995.
[17] StruktonWorkspere, PULSE, (2015).
[18] B. Ankersmit, A.W. Brokerhof, W. Kragt, M.H.L. Stappers, N. Duggen, J. Jonge,
de, J. Schonewille, H.H.E.W. Eijdems,
M.H.J. Martens, H.L. Schellen, M. Otte,
J.M. Tegelaers, Meten van
het binnenklimaat; waarom, waar?,InstituurCollectie Nederland; Ministerie van Onderwijs, CultuurenWetenschap,
2010.
[19] ASHRAE, Performance Measurement Protocols for
Commercial Buildings, (2010) 1–162.
[20] K. Ackerly, G.S. Brager, E. Arens, Data Collection
Methods for Assessing Adaptive Comfort in Mixed-Mode Buildings and Personal
Comfort Systems, University of California, 2012.
Follow us on social media accounts to stay up to date with REHVA actualities
0