


Stay Informed
Follow us on social media accounts to stay up to date with REHVA actualities


A very low
pressure drop is mandatory for successful VC application.
If the air
driving force is buoyancy, typically design for less than 5 Pa.
If the air driving force is mechanical ventilation, design for less
than 100 Pa.
Driving
force by buoyancy equals:[1]
|
Dp:
pressure difference [Pa], DT: temperature difference [K], h: height [m]
This leads
to driving forces in the range of 5 Pa, rarely more. Wind pressure might
help with another 5 Pa, equalling the dynamic pressure at a wind speed of »3 m/s.
Driving
force by mechanical ventilation technically can be raised to some hundred Pa,
but economically and ecologically is limited by the call for high power
efficiency (COP), given by the ratio of Pthermal / Pelectrical
. A total pressure drop of 100 Pa will lead to a power efficiency (COP) of
»20, which is a reasonable benchmark,
compared to a mechanical chiller. EN16798-3 (table 14) defines the second best
category of Specific Fan Power (SFP) the SFP1 category which means lower than
500 W/(m³.s), equalling a pressure drop of 250 Pa. In Ventilative
Cooling this is still too much. VC applications have to be designed within the
non-existing category “SFP 0+”
with a specific fan power of lower than 200 W/(m³.s), equalling a pressure
drop of 100 Pa.[2]
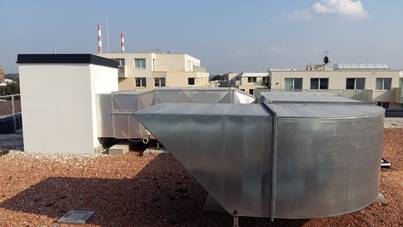
A well
performing example of a VC exhaust ventilation was monitored in a recent
Viennese social housing project. Outdoor Air inlet via automated staircase
windows. Ventilative Cooling of the central stairways. Extract Air led through
less than 10 m ducts and being exhausted by a central exhaust ventilator.
The monitoring proofed a Specific Fan Power (SFP) lower than 170 W/(m³.s),
equalling a total pressure drop of 85 Pa, resulting in COP = 24
at an extract air flow of 22.000 m³/h. [3]
|
|
Figure 1. Air inlet
window with chain actuator (left) Exhaust ventilator on roof (right).
ACH >
3 h-1 is mandatory, ACH > 5 h-1 is desirable to
achieve substantial heat removal and justify noteworthy investments.
In VC
applications, the nightly air change rate very often is the bottleneck. The
following picture shows the balance of temperature and energy flow in a
standard room within a characteristic Central European summer.
A massive wall, ceiling or floor may store up to 70 Wh/m² within one day. To release this heat by night ventilation, seven hour duration of specific heat flow of 10 W/m² is necessary. In an exemplary 24 m² room this leads to the need of at least ACH 8,0 h-1, better ACH 10,0 h-1. This is 10 to 20 times higher than ACH for hygienic aspects. Thus, unlink the function of Night Ventilation from the function of hygienic ventilation. Besides, trusting on windows. Even in case of single sided ventilation in still air only 3 K temperature difference at a fully opened window of 2 m height and 0,5 m width will already provide an air exchange of approx. »300 m³/h. [4]
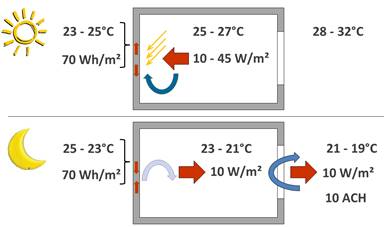
Figure 2. Scheme of
typical VC temperatures, loads and airchangerates.
If
mechanical, run the VC system only at a temperature difference potential of
2 K or higher. Do not shoulder the challenges of VC during periods of weak
performance (with lower temperature differences).
Automated
VC always consumes resources, such as energy and maintenance. Sometimes it
interferes with the expectations of occupants, e.g. in case of noise.
Note:
1.000 m³/h at DT of 1K
carry the thermal load of 340 W. If driven mechanically at “SFP 1” at
500 Wel/(m³.s) this will cause an electrical load of
140 W. Thus, running automated Ventilative cooling at low DT is only sensible in naturally
driven systems. Even then, 2 K seems to be a recommendable threshold.
Figure 3 shows short time monitoring results
from mechanical ventilative cooling in a Viennese office during a mild summer
period. Outdoor Air Temperature (green) undergoes the extract air temperature
(yellow) at 22:00. Ventilation runs from 22:00 to 06:00, which turns out to be
a good choice regarding the start, but could have been extended regarding the
end. [5]
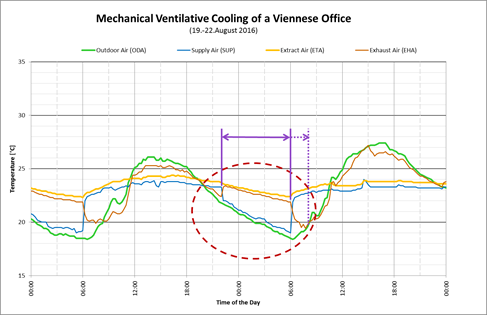
Figure 3. Temperature
profile of mechanical Ventilative Cooling system in an office.
There’s
ongoing discussion, if Ventilative Cooling still is a good option, as soon as
Air-conditioning is applied. And, furthermore, if Ventilative Cooling still is
a good option, when climate change or urban heat island effect raise the
ambient temperatures: The answer is two sided: Yes, it is, as long as
air-conditioning is limited to moderate set point temperatures, e.g. 26°C and
as long AC and VC are run strictly in alternative mode.
From one of
our short time case studies we extrapolated the following scenarios of hybrid
cooling: Figure 4(top) by green columns illustrates the days within a year with
Ventilative Cooling being appropriate to keep the indoor set point temperature
of 26°C. Sometimes VC won’t be sufficient. If so, AC has to take over. Figure 4(bottom) illustrated the same, but
against an outdoor temperature dataset with constantly plus 3 K. Figure 4 shows, that the periods of necessarily running the AC are rising during
summer, but cooling need also extends to early summer and late summer
when, VC will take over. In fact, both the number of VC-days and the sum of
thermal load being removed by VC stays constant.[6]
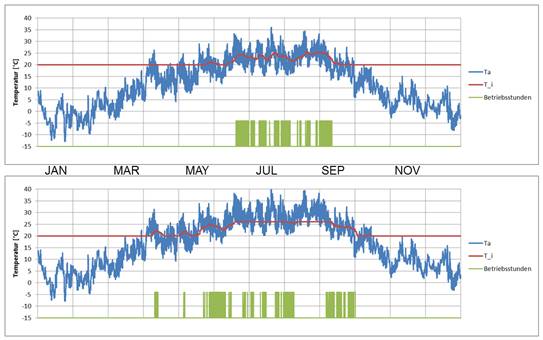
Figure 4. Days with climatic VC potential
before and after a 3K outdoor climate change.
There are
promising examples for enhancing the effect of ventilative cooling by
connecting adjacent rooms with deliberately high thermal conductivity.
This may be
a very cost effective solution. It’s comparably easy to effectively ventilate
staircases and hallways, while it is costly and technically challenging to
apply automated night ventilation to flats or to numerous single offices.
Figure 5 shows an example from a 1960’s
high-rise office building of Vienna’s Technical University which has recently
been refurbished to Plus-Energy-Standard, including buoyancy driven Night
Ventilation of the staircases and hallways. The offices and seminar rooms are
separated from the hallway by single-pane laminated safety glass. The overflow
orifice for night ventilation is situated above the lockable hallway door. [7]
![]()

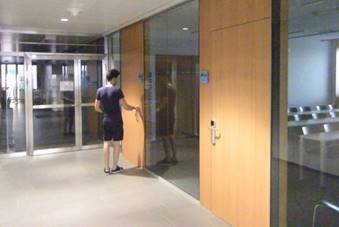
Figure 5. Glazed
partition walls with high U-values and overflow orifice.
Air
movement is a strong driver of thermal comfort. It is well suitable to passive
cooling.
Figure 6, taken from ISO 7730:2005
illustrates the medium airspeed necessary to elevate the comfort temperature
from 26°C for standard summer clothing (0,5 clo) and for standard sitting tasks
(1,2 met). Note: Airspeed of only 1 m/s without any technical cooling already
elevates the comfort temperature by 3 K.
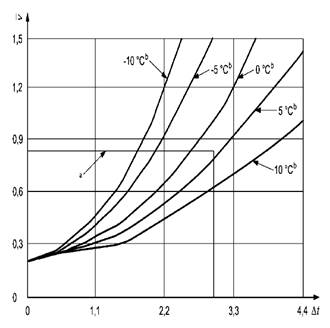
Figure 6. Mean air speed over elevation of
comfort temperature.
The
operability of Ventilative Cooling Components, especially of the airflow
guiding and airflow enhancing components, is a key success criteria.
The
following aspects have been identified as critical in an operational context: [8]
·
Safety
& security aspects dealing with injury, burglary and vandalism
· Thermal Performance limitations
·
Comfort
aspects dealing with noise, dust and humidity
·
Operational
aspects dealing with (mis)adjustments in the control systems
·
Economic
aspects dealing with investment and maintenance
Keep
operation strictly simple!
If VC is
manually controlled, design ventilation openings free from interference with
storage area and furniture, place opening handles very ergonomically, chose
robust and long lasting mechanisms, always include anti-slam devices which
prevent the ventilation openings slamming in case of draught.
If
mechanical, put very intuitive operating devices at very intuitive places, be
aware of stand by energy-consumption, operating noise levels, life cycles and
maintenance; and find smart answers to questions relating to injury and
vandalism.
Furthermore:
Ensure strict rain protection: better by architecture than by rain sensors.
Ensure burglary protection and consider needs for intimacy.
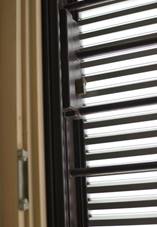
Figure 7 illustrates an example of
protection against rain and burglary by a fixed metal grill in front of the
window. But everyday operation of the window is handicapped by the exceptional
deep windowsill, which invites users to use it as a shelf board, blocking the
window.
|
|
|
Figure 7. Window for
manual night ventilation secured against rain burglary and fall but blocked by
books.
In our field
research we found many examples how to deal with the risk of getting injured by
automated ventilation openings, simple ones and sophisticated ones.
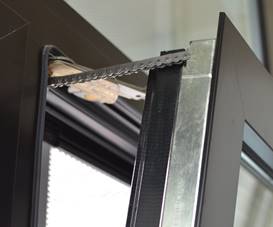
A high-tech
example is shown in Figure 8: A window which can be operated both
manually and automated. The handle is combined with an electro-mechanical
device that disconnects the chain actuator from the window-frame, allowing
manual operation. Furthermore, the window gaskets are equipped with internal
electronic sensors, ensuring an immediate interruption of the closing process
if dedecting an unexpected resistance. The windows are installed in a Viennese
school. The flipside of the coin is the higher costs for this level of
function, and the notable need for maintenance.
|
|
Figure 8. Automated
window, with optional manual operation and resistance sensitive gasket.
Another example showing
the challenges of protecting against injuries was found at HCU “Hafencity
University Hamburg”: Pictograms tell users not to interfere with the automated
bottom hung ventilation windows, mounted already at elevations of
> 2 m above floor level. Furthermore, protective grids secure venilation
flaps.
![]()


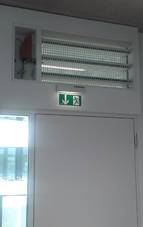
Figure 9. Ventilation flaps with additional
warning pictogram and protective grid against finger injury.
Ventilative
Cooling proofs to be a robust and highly energy efficient solution to support
summer comfort in buildings, not at just in NZEB’s. Ventilative Cooling
furthermore proofs being applicable in both cool and warm temperate climate. An
International VC Building Database has been elaborated within Annex 62, so
far documenting 99 buildings using Ventilative Cooling from 8 European
Countries.[9]
This paper
is based upon a conference contribution at AIVC 2017, Nottingham. Its
findings have been derived within IEA EBC Annex 62 Ventilative Cooling.
The authors express their thanks to their colleagues within Annex 62 and
to their national funding authorities: In Austria the Federal Ministry for
Transport, Innovation and Technology. In Denmark the EUDP (Energy Technology
Development and Demonstration Program) together with VELUX A/S, DOVISTA A/S and
VISILITY ApS.
Kolokotroni,
M., Heiselberg, P. (2015). Ventilative Cooling State-of-the-Art Review. Published via Internet: http://venticool.eu/annex-62-publications/deliverables/
Holzer, P. et al. (2015). Austrian Annex 62 Report Work Package 2. Currently unpublished.
Holzer, P. et al. (2016). Austrian Annex 62 Report Work
Package 3. Currently unpublished.
Holzer,
P. (2016). Presentation at IEA cross-linking workshop 20.10.2016. Published at https://nachhaltigwirtschaften.at/de/iea/technologieprogramme/ebc/iea-ebc-annex-62.php
Holzer,
P., Moherndl, P., Psomas, T., O’Sullivan, P. (2016). International Ventilative
Cooling Application Database. Published at http://venticool.eu/annex-62-publications/ventilative-cooling-application-database/
[1] Kolokotroni, M., Heiselberg, P.
(2015).
[2] Calculations based on an average
ventilator efficiency ratio of 50% and air temperature rising by 3 K.
[3] Holzer, P. et al. (2016)
[4] According to formula I.14 from ISO
13791:2012 ![]()
[5] Holzer, P. et al. (2016)
[6] Holzer (2016)
[7] Holzer, P. et al. (2016)
[8] Holzer, P. et al. (2015)
[9] Holzer, P., Moherndl, P., Psomas, T.,
O’Sullivan, P. (2016)
Follow us on social media accounts to stay up to date with REHVA actualities
0