
Stay Informed
Follow us on social media accounts to stay up to date with REHVA actualities
|
Enno Abel |
Professor emeritus, CIT Energy Management, Gothenburg, SwedenE-mail: enno.abel@chalmersindustriteknik.se |
In most cases the construction of new buildings does not replace existing buildings, it only increases the building stock. The year 2050, i.e., 30 years from today, about 60–70% of all buildings will be the ones existing today. These will then still dominate the total environmental impact from buildings in operation. Independent of how minimal the impact of new buildings might be, the environmental load from the whole building stock will be decreased only if most of the already existing stock is substantially improved. It is a real challenge to carry out this since the required measures might be costly, and concern millions of buildings with owners willing, or forced, to finance at least a substantial part. A large-scale improvement of the existing building stock can be brought about only if it is economically feasible for the individual property owners.
The environmental impact of a building in operation is almost entirely determined by its need of different forms of energy. Only by carrying out measures to decrease this need, the environmental impact of the building stock can be lowered. However, to bring about a real cut, every measure taken, as well as the measures taken together, must be really energy efficient. This means that the resources used must lead to the greatest possible energy saving and also, what is most important, the function of the building must be preserved or improved. To ensure that, it is advisable to form an optimized package of measures, which, when implemented will result in the greatest possible increase in energy efficiency.
The savings can always be expressed in economic terms as a decrease of annual energy cost. The pricing can also be based on primary energy or energy related CO₂ emissions, but for the property owner, it is the bill to be paid that matters. The investments needed can be linked to the saved energy by established economic methods. In every existing building one can usually identify quite a few more or less efficient energy saving measures. They can be ranked into a package after profitability by the internal rate of return IRR (interest rate). In a graph with investment cost on the x-axis and annual saving on the y-axis, lines from origin represent the IRR, the value given by the slope of the line. By the annual energy cost saved and the investment needed, the energy saving measures identified can be shown in the graph and arranged after their profitability measured by the IRR-value.
Figure 1 shows an example. It is an about 5.000 m² office building. According to the building owner, the profitability of the project should be at least 5%, as applied by this company generally on long term investments.
The energy saving measures might have different economic lifetimes. Insulation of roofs and walls and new windows may last 30 years or more. For ventilation units, lighting systems, measures in the heating and AC systems, it may be about only 15 years. This can be accounted for by adopting the IRR lines to the difference in lifetime of the measures.
In the case shown in Figure 1, the building owner accepted that the profitability demand should be valid for the whole package of measures. After being implemented, all measures together, resulted in about 50% annual energy savings. In Figure 1, only the part of the package that meets the required profitability of 5% is shown. Other identified measures, as insulation of walls, are not shown since they, if included, would result in a package interest rate, IRR, below 5%. Naturally, measures as PV panels, solar collectors, heat pumps, etc., can be included in the package.
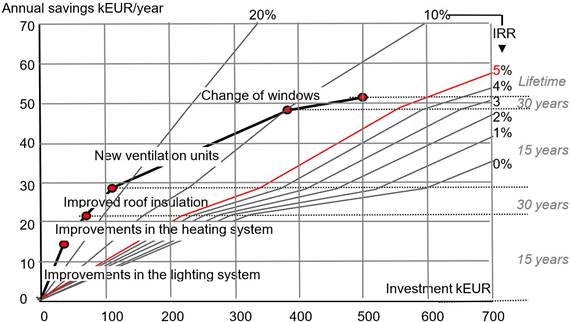
Figure 1. A package of energy saving measures in the IRR graph. The package did lead to 50% annual saving of energy.
The method accounted for above, is nowadays widely applied in Sweden in energy saving projects in non-residential buildings as offices, schools, hospitals, etc. The basic principle is that the rebuilding has to be profitable for the property owner. In Sweden long time investments in the building sector yield a return of 7–8%. It is quite obvious that, at least in Europe, in the future the energy prices will increase noticeably. The refund from energy savings will increase. About 5% return on energy savings is often accepted by dominating Swedish property owners.
A prerequisite is that the package shown in the IRR graph is reliable, i.e., the real savings and the real costs after the rebuilding process will be close to those estimated beforehand. The identification of measures to be included in the package must be unbiassed. The energy savings must be predicted for each measure and in many cases, it must be done by simulations. A problem when simulating energy need of buildings is that some input data may be uncertain. By way of example: how and when are rooms occupied, how are lights used, what is the air infiltration through the building envelope, due to door openings and window openings, etc. Nowadays there is available, at least for commercial buildings, quite comprehensive statistic data about the energy use. These can be used for “tuning-in” the uncertain input data. By this the results from simulations usually become quite well in accordance with the ones obtained after rebuilding.
The reliability of the cost estimation is of course important as well. Experience from realized projects indicate that the real costs often tend to become higher than the estimated ones. This ought to be considered. The build-up of the package is a somewhat demanding task. There are quite a few quite detailed reports and papers about the process [1]. In Sweden there is also a course available.
The development of the method began about 15 years ago in Sweden, and it has been applied also in other Nordic countries. The method goes under the name The Total Concept and you can read more here: http://totalconcept.se/.
[1] Wahlström Å., Maripuu M.L., Afshari A. (2016) “Market potential and business opportunities for major renovation of commercial buildings” Proceedings of the 12th REHVA World Conference. Clima 2016. Paper 460.
Maripuu M.L., Wahlsröm Å. (2017) “Major energy conservation with the Total Concept Method”. REHVA Journal. August 2017.
Follow us on social media accounts to stay up to date with REHVA actualities
0