


Stay Informed
Follow us on social media accounts to stay up to date with REHVA actualities
|
|
|
|
|
Vinayak Krishnan | Hailin Zheng | Marcel Loomans | Shalika Walker | Wim Zeiler |
Kropman Installatietechniek | Department of the Built Environment, Eindhoven University of Technology, Eindhoven, the Netherlands | Department of the Built Environment, Eindhoven University of Technology, Eindhoven, the Netherlands | Kropman Installatietechniek | Department of the Built Environment, Eindhoven University of Technology, Eindhoven, the Netherlands |
Many schools in the Netherlands have insufficient ventilation [1]. At this moment, one of the pieces of advice by the Dutch government [2] for improving school ventilation is appropriate airing (i.e., opening doors and windows) based on the activities in poorly ventilated classrooms. If one can understand what exactly is happening in a classroom in terms of IAQ on a real-time basis, then appropriate interventions like these can be implemented to improve ventilation. Moreover, due to variable demand during the day in schools, demand-controlled ventilation helps to reduce energy consumption. Therefore, monitoring classroom IAQ is crucial for appropriately applying IAQ-improving interventions and effectively controlling the ventilation for a more energy-efficient system.
The Dutch government has also recognized this need and has decided to supply low-cost CO₂ sensor units for all school classrooms in the Netherlands [3] and make their presence obligatory. This is a good first step; however, how reliable are market available IAQ parameter measuring LCMs when applied on a large scale?
With this question, a study was conducted at the Eindhoven University of Technology (TU/e) with the following aims:
· To test the performance of market-available LCMs capable of measuring CO₂ & PM as compared to research-grade instruments (RGIs).
· To identify the advantages and limitations of LCMs when applied to monitor and control classroom ventilation, based on the results of the performance assessment.
This study was part of the RVO TKI Urban Energy and Eindhoven Engine project Efficient Comfortable School Indoor Air Quality (ECoS-IAQ).
The LCMs were tested in a climate chamber setting (see Figure 1). The LCMs performance was compared to research-grade instruments (RGIs) using statistical metrics defined in the United States Environmental protection agency (U.S. EPA) guideline [4]. Later an overall performance assessment of the LCMs was conducted using rating criteria. For details on the method refer to [1],[5].
In total 16 LCMs (two units per brand) measuring multiple IAQ parameters were tested in this study. 7 out of 16 LCMs have not been tested in previous scientific literature yet [5]. In this article we focus on LCMs measuring CO₂ and/or PM. A GRIMM aerosol spectrometer (Model 11-D) was used as an RGI for PM and an SBA-5 CO₂ gas analyser was used as a reference for CO₂.
The study [5] tested LCMs performance for typical day care centre activities, which are similar to schools. However, the LCMs could not detect accurately the low concentrations of PM released. Therefore, in this study the focus has been on selecting activities which generate enough pollutants that can be detected by the LCMs. Three types of PM events were conducted which included, ultrasonic humidifier, candle burning and vacuum cleaning. Two types of CO₂ release events were conducted which included CO₂ dosing and human occupancy. Two different climatic conditions were considered for each event. These are hot and humid (T= » 26°C, RH= » 70%) and cold and dry (T= » 20°C, RH= » 40%), which are the indoor conditions commonly observed in the Netherlands. A total of 11 events for CO₂ and PM pollutants were conducted.
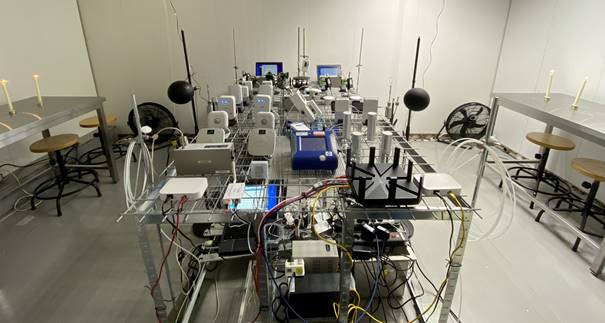
Figure 1. The Climate Chamber setup for the candle burning experiment is shown. The sensors are placed in the middle on a wire mesh table, and the pollutant sources are placed on the two tables around the sensors
The four aspects as per [4] that were used to check the LCMs performance are as follows:
Precision: This is to check how repeatable the measurements are when comparing the two units of the same brand. This is checked by comparing the coefficient of variation (CV) values for the LCMs. The lower the CV value, the better the equipment's precision.
Bias: This metric estimates the systematic disagreement between the LCM and the RGI. Based on the research [4], the linear regression model is recommended to fit LCM data to RGI data. This regression can help determine the slope (m) and the intercept (c) computed with the LCM data plotted on the y-axis and the RGI data plotted on the x-axis. The closer the slope is to 1 and the intercept is to 0, the lower the LCM's bias.
Linearity: This metric explains how much the LCM results can explain the RGI measurements. This was quantified using the R² value. The higher the R², the better the fit of the data points to the linear regression line.
Error: This is a measure to quantify the disagreement in the values between the LCM and the RGI for a specific event. This was quantified using the root mean squared error (RMSE) and normalized root mean squared error (NRMSE). The lower these values, the lower the total error between the LCM and the RGI in an event.
Table 1. Grading criteria defined for each parameter of the LCMs for evaluating Precision (CV), Linearity (R²), and Error (NRMSE & RMSE). The grade ranges from 5 (very good) to 1 (very poor).
Parameter | Ranking grade | 5 | 4 | 3 | 2 | 1 |
(Very good) | (Good) | (Moderate) | (Poor) | (Very poor) | ||
CO₂ | CV (%) | CV≤2.5% | 2.5<CV≤5% | 5%<CV≤7.5% | 7.5%<CV≤10% | CV>10% |
R² (-) | R²≥0.95 | 0.95>R²≥0.9 | 0.9>R²≥0.85 | 0.85>R²≥0.8 | R²>0.8 | |
NRMSE (%) | NRMSE≤10% | 10%<NRMSE≤20% | 20%<NRMSE≤30% | 30%<NRMSE≤40% | NRMSE>40% | |
PM | CV (%) | CV≤5% | 5%<CV≤10% | 10%<CV≤20% | 20%<CV≤30% | CV>30% |
R² (-) | R²≥0.95 | 0.95>R²≥0.9 | 0.9>R²≥0.85 | 0.85>R²≥0.8 | R²>0.8 | |
NRMSE (%) | NRMSE≤15% | 15%<NRMSE≤30% | 30%<NRMSE≤45% | 45%<NRMSE≤60% | NRMSE>60% |
It should be mentioned that each performance assessment metric was computed for each event. The metrics computed are plotted in a box plot, with each point representing a metric outcome for one event. This gives an idea of the spread of the data. Also, the limiting values are plotted to check the LCMs performance. The equations used to compute the metrics can be found in [1]. In the box plots the LCMs are indicated with the numbers as per the LCMs list in [1]. The grading criteria for the LCMs are shown in Table 1. These grading criteria incorporate three main aspects: precision, linearity, and error. The bias is not considered as it is already part of the error. Each LCM can be rated based on the parameter it can measure using these rating criteria.
In Figure 2, Figure 3, Figure 4, and Figure 6, the CV, R², slope, and RMSE values for each event are plotted in a box plot for CO₂, and PM2.5. The limiting values as per [4] are also indicated with a blue dashed line in the plot. The red dashed line indicates the ideal value. Although there were 3 types of PM sizes analysed in the study, only PM2.5 results are shown. The LCMs performance of other PM sizes have been found to be similar [1].
Precision: Based on the results shown in Figure 2, it can be concluded that the precision is within acceptable limits for almost all LCMs for both CO₂ and PM2.5. This also means that different LCMs of the same type will have reasonably consistent readings.
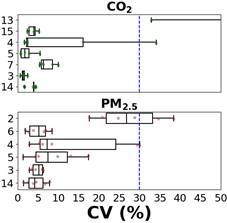
Figure 2. CV values for CO₂, and PM2.5, are plotted in a box plot with each point denoting one event. The blue dashed line indicates the limiting value as per [4].
Linearity: Based on the results shown in Figure 3, it can be concluded that all the LCMs and the RGIs readings have a linear relationship with each other. The linear regression is a good fit for the data.
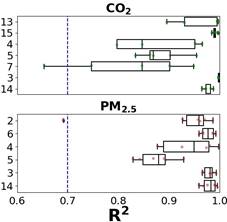
Figure 3. R² values for CO₂, and PM2.5, are plotted in a box plot with each point denoting one event. The blue dashed line indicates the limiting value as per [4].
Bias: From Figure 4 it can be observed that the slope values are within limits for CO₂ LCMs. From Figure 5 it can be observed that the intercept for CO₂ can be quite variable depending on the LCM. Therefore, the bias for CO₂ LCMs can range from acceptable to significant. For almost all LCMs which measure PM2.5, the bias values are significant, refer Figure 4 and Figure 5. Particular attention must be placed on correcting the bias of the LCMs.
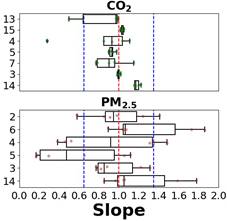
Figure 4. Slope values for CO₂, and PM2.5, are plotted in a box plot with each point denoting one event. The blue dashed line indicates the limiting value as per [4] and red dashed line the ideal value.
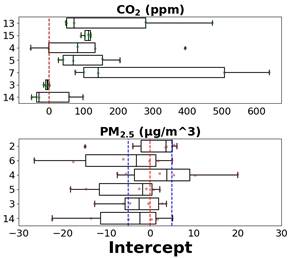
Figure 5. Intercept values for CO₂, and PM2.5, are plotted in a box plot with each point denoting one event. The blue dashed line indicates the limiting value as per [4] (only for PM) and red dashed line the ideal value.
Error: Based on the results shown in Figure 6, it can be observed that the RMSE values are significantly high for almost all LCMs and both parameters. Interestingly, the average RMSE for CO₂ varied between 32.5 ppm and 415.4 ppm (except for LCM 13 as it was way too erroneous compared to the other LCMs), and for PM2.5 almost all values were above the limits. Most manufacturers quote accuracy below these values; hence, every LCM’s accuracy must be questioned and verified.
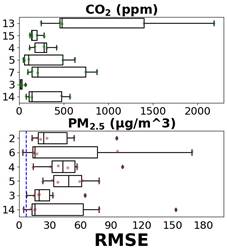
Figure 6. RMSE values for CO₂, and PM2.5, are plotted in a box plot with each point denoting one event. The blue dashed line indicates the limiting value as per [4].
Table 2. Ranking for the CO₂ LCMs in the experiment based on the rating criteria mentioned in Table 1.
LCM number | CO₂ | Average rating | Rank | ||
CV | R² | NRM-SE | |||
13 | 1 | 5 | 1 | 2.33 | 5 |
15 | 4 | 5 | 4 | 4.33 | 2 |
4 | 1 | 1 | 3 | 1.67 | 7 |
5 | 5 | 3 | 4 | 4.00 | 3 |
7 | 3 | 2 | 2 | 2.33 | 5 |
3 | 5 | 5 | 5 | 5.00 | 1 |
14 | 4 | 5 | 3 | 4.00 | 3 |
The LCMs used in the experiment can be compared using the rating criteria presented in Table 1. When comparing LCMs that measured CO₂, LCM 3 performed the best; refer to Table 2. Additionally, when comparing LCMs that measured PM2.5, again, LCM 3 and also LCM 14 performed the best; refer to Table 3. LCM 3 was also the best performing LCM when comparing criteria across multiple parameters like PM2.5, CO₂, TVOC, T, and RH in the study presented in [5]. Therefore, the results are consistent.
Table 3. Ranking for the PM2.5 LCMs in the experiment based on the rating criteria mentioned in Table 1.
LCM number | PM2.5 | Average rating | Rank | ||
CV | R² | NRM-SE | |||
2 | 4 | 5 | 2 | 3.67 | 3 |
6 | 2 | 4 | 3 | 3.00 | 4 |
4 | 3 | 2 | 2 | 2.33 | 6 |
5 | 4 | 3 | 1 | 2.67 | 5 |
3 | 5 | 5 | 3 | 4.33 | 1 |
14 | 5 | 5 | 3 | 4.33 | 1 |
The main observations in terms of LCMs application from this study are:
Based on the spread in data for all the boxplots for the different metrics, it can be concluded that the LCM performance can be significantly dependent on the event itself. This indicates the activity dependence on the performance of the LCMs, which was also noted in [5]. Additionally, the systematic error or bias is significant, and is generally time dependent. Therefore, all LCMs must be regularly calibrated for the specific environment in which they will be installed. Despite the errors, all LCMs can follow the trends for the parameters based on the classroom activities and can be directly applied to detect events on a large scale and possibly initiate interventions to improve the ventilation. For this study, it was found that the LCM 3 performs the best overall. The metrics used and the grading criteria can be replicated from this study for other studies to evaluate LCMs in the future.
As per the results, the main concern for CO₂ LCMs is the accuracy and variability across different activities. As an example, in the Netherlands, Frisse Scholen Classes [6] are defined in increments of 200 ppm. This increment is lower than the accuracy encountered by some LCMs, refer to Figure 6. This raises questions about the ability of these LCMs to distinguish between these classes. The accuracy quoted by the manufacturer and the actual performance was also noted to be different (lower) in most cases.
Regarding PM, it was observed that the LCMs readings could have a significant error and activity dependence compared to CO₂. The accuracy quoted by the manufacturer must be questioned, and from the results, it seems they are not yet mature enough to predict accurate absolute values for varying environmental conditions. For PM LCMs especially, the LCM must be calibrated for the specific pollutant generated in the application for which they will be used. However, it is expected to be a complex procedure because the types of particles generated in any indoor environment can vary a lot. It is also to be noted that currently available LCM technology cannot monitor particles less than 0.25 µm [5], which are considered the most dangerous for human health.
The LCMs measuring PM and CO₂ can detect variations in measured parameters in a classroom. However, the absolute accuracy of the LCMs needs to be questioned in practice. It was also observed that the performance depended on the environment and the pollutants they were exposed to, especially for PM. In most cases, for the CO₂ measurement results, the accuracy was lower than quoted by the manufacturer. The PM measurement results indicate that the current low-cost PM technology is not yet able to measure accurately in varying environmental conditions. However, overall, the LCMs could follow the trend of the exposed pollutants.
It is recommended to check how significantly can correcting the bias help in reducing the total errors. The frequency of this bias correction or calibration needs to be also checked. Also, since the calibration needs to be conducted on a large scale, a feasible and effective calibration method must be developed. Additionally, this study could be used as a start for creating a standardized performance test for selecting LCMs in the future. E.g., within the Brains 4 Buildings project (brains4buildings.org). This project is aimed at data driven Fault detection and Diagnosis.
This study was financially supported by RVO TKI as well as Eindhoven Engine. Furthermore, we would like to thank Ph.D. candidate Srinivasan Gopalan, Ph.D. candidate Karzan Mohammed, and EngD trainee Petros Zimianitis who were involved in the processing and analysis of the data.
[1] Krishnan, V. 2022. Methodical School Ventilation Design to improve Efficiency, Comfort, and Health: Design Concepts for Air Handling units and Performance assessment for Low-cost sensors. PDEng report, Eindhoven University of Technology Available: https://research.tue.nl/files/216623288/2022_08_30_Krishnan_V._SBC.pdf.
[2] Landelijk Centrum Hygiëne en Veiligheid, Binnen- en buitenmilieu voor basisscholen. May 2016 https://www.rivm.nl/sites/default/files/2018-11/Binnen-%20en%20buitenmilieu%20voor%20basisscholen%20-%20mei%202016.pdf.
[3] “gezamenlijk-actieplan-voor-snelle-verbetering-van-ventilatie-op-scholen @ www.rijksoverheid.nl.” [Online]. Available: https://www.rijksoverheid.nl/actueel/nieuws/2022/02/03/gezamenlijk-actieplan-voor-snelle-verbetering-van-ventilatie-op-scholen.
[4] R. Duvall et al. 2021. Performance Testing Protocols, Metrics, and Target Values for Ozone Air Sensors: Use in Ambient, Outdoor, Fixed Site, Non-Regulatory and Informational Monitoring Applications. p. EPA/600/R-20/279, 2021, [Online]. Available: https://cfpub.epa.gov/si/si_public_record_Report.cfm?Lab=CEMM&dirEntryId=350784&Lab=CE%MM.
[5] Zheng, H., Krishnan, V., Walker, S., Loomans, M., & Zeiler, W. 2022. Laboratory evaluation of low-cost air quality monitors and single sensors for monitoring typical indoor emission events in Dutch daycare centers. Environment International, 166, 107372.https://doi.org/10.1016/j.envint.2022.107372.
[6] Netherlands Enterprise Agency. 2021. Program of requirements – fresh schools, [Online]. Available: https://www.rvo.nl/sites/default/files/2021/06/PvE-Frisse-Scholen-2021.pdf.
Follow us on social media accounts to stay up to date with REHVA actualities
0