


Stay Informed
Follow us on social media accounts to stay up to date with REHVA actualities

Copyright ©2022 by the authors. This conference paper is published under a CC-BY-4.0 license. |
|
|
|
Lasitha Chamari | Ekaterina Petrova | Pieter Pauwels |
Department of the Built Environment, Eindhoven University of Technology, Eindhoven, the Netherlandsl.c.rathnayaka.mudiyanselage@tue.nl | ||
A building Management System (BMS) is used to centralize, automate, and manage HVAC, lighting, security, water, and energy subsystems. Internet of Things (IoT) devices are also extensively used in many new buildings [1], giving rise to a large volume of time series data about energy usage, ambient conditions (temperature, humidity, illuminance), as well as machine and equipment related parameters such as vibration, faults, alarms, etc. This data is useful in many applications such as reporting, monitoring, dashboards, fault detection, energy forecasting, etc., and also enables virtual representations of physical buildings, known today as "Digital Twins" [2]. Other than the time series data, Building Information Models (BIM) [3] are also essential components of the Architecture, Engineering and Construction (AEC) industry. A BIM model is a digital representation of a building that contains semantic information about the objects [4]. A properly developed and managed BIM model includes geometry, spatial location, and a broad representation of metadata about the properties of the building, its subsystems, devices, Mechanical, Electrical and Plumbing (MEP) equipment, etc. [5]. While time series data provides numerical values and patterns, BIM data provides the contextualization and semantic links between the systems of a building.
With the ever-increasing demand for smart building applications (such as Digital Twins) and real-time monitoring, there is a need to develop applications that combine the data available across multiple decentralized systems such as BIM and BMS. As a result, data integration becomes increasingly important. However, there is no straightforward way to integrate data across domains and systems, e.g., integrate a Honeywell BMS with a BIM model developed in Autodesk Revit. Such integration is not straightforward, because it relies on different modelling approaches, languages, and protocols, which makes it is incompatible by definition.
Therefore, a significant body of research in the AEC industry focuses on how to exchange and integrate heterogeneous data [2]. Many efforts revolve around Industry Foundation Classes (IFC), which is a vendor-neutral data model for the exchange of AEC data [2] relying on the EXPRESS schema language. IFC is an open international standard for BIM data that is exchanged and shared among software applications used by the various participants in the construction and facility management sectors[6]. However, not all aspects of the built environment can be modelled in IFC. For example, a crucial part of the operational phase of a building is the dynamic sensor data, which cannot be easily represented using IFC. Even though the IFC standard describes common systems such as Heating, Ventilation & Air Conditioning (HVAC), lighting, and sensor devices, they are not capable of representing the context of the devices contained within [7].
Semantic technologies and linked data have shown promising results in integrating heterogeneous sources. IFC itself is also available as ifcOWL ontology [8]. Linked data models are built using formal ontologies and thereby allow extending and linking with other domain-specific ontologies, exchanging heterogeneous information [9], and deriving new information based on the semantic graph [7]. Linked Building Data (LBD) is an initiative with a focus on making building data web-ready [10], where a number of vocabularies and ontologies, such as BOT, PRODUCT, and PROPS, have been developed using a linked data approach [11]. Many other ontologies, such as SSN [12], RealEstateCore [13], Haystack [14], Brick [15], etc., have also emerged to formally represent different domains such as IoT sensors, business administration, BMS, etc., in the built environment. Semantic graphs, also referred to as knowledge graphs, are a representation of the built environment instantiated using such ontologies. These graphs can be queried using various query languages such as SPARQL [8], which allows information in the graph to be linked to other data sources and applications.
Despite the availability of such technologies for data integration, their adaptation to buildings is quite slow. Data is often maintained in isolated silos, and there is little interaction between different datasets. For example, BIM models developed in the design phase often remain disconnected from the operational data. Most of the sensors and devices are also not included in the BIM models at the design stage. Again, although the spatial information is already available in the BIM model, this information is duplicated in the BMS due to the lack of interoperability. Therefore, despite the number of systems or amount of data being collected, it is difficult to interpret information across domains due to little interaction between islands of data [16]. Available data, their formats, naming conventions, and standards also differ significantly among each building and system vendor [17].
According to the literature [13, 14], a common use case is integrating sensor data into the BIM model using commercial BIM authoring tools like Revit or Navisworks. Although they may serve as appropriate tools for visualizing sensor data in a 2D or 3D environment, such approaches rely on vendor-specific software and do not provide reusable components for other applications. Alternative approaches rely on integrating datasets, including building geometry, the relationship between spaces, sensors and actuators, and time series data into a single semantic graph in Resource Description Framework (RDF) using Semantic Web approaches [20]. Sensor data is further retrieved for visualization in charts and colour-coded maps in 2D plans. Other studies [16, 17] suggest that retaining sensor data in a database that is optimized to store time series data is more efficient. Visualizing BIM models on the web has provided a vendor-neutral platform for collaboration and exchange of data, as well as means to integrate data across domains [10]. As such, a web-based server is proposed in [10], which allows users to upload BIM models in IFC format and visualize it in a graphical user interface. Attaching Linked Building Data (as graphs) to the project allows querying the BIM model based on the graph. However, implementations integrating systems, BIM, sensor data, and semantic graphs in a decentralized manner are still in their infancy.
This paper presents the first outcome of the effort to integrate heterogeneous systems in a building using web technologies. We demonstrate how to integrate BIM models and time series data, two distinct systems in the built environment, in a distributed manner. The proposed approach uses an IFC file to create the initial graph, followed by another graph to represent the semantics of BMS sensors. This graph is used to integrate BIM and time series data. Each data stream remains in its optimum environment, and the connections are made via an Application Programming Interface (API) as opposed to file-based transfers. The demonstrated application is, therefore, entirely web based. The developed platform can be used to collectively view and query the building data in its entirety, browsing the BIM model and visualizing sensor data.
The TU/e Atlas case study building is a 12-storey renovated university building consisting of offices, study, and lecture rooms. It was renovated in 2019 and now contains a BMS, Energy Management System (EMS), and a Lighting Management System. The 4th to 11th floors of the building are considered a Living Lab and are used for research regarding Indoor Environmental Quality, energy efficiency, lighting, and Digital Twin implementations.
The campus building has a Honeywell BMS. A data dump from the BMS containing occupancy, temperature, and CO₂ data is used for this study. They constitute 1,314,720 data points per month. Measurements are stored on an hourly basis, and the extracted data from the BMS is stored in spreadsheets (Table 1). The table columns contain the timestamps and the sensor IDs. Sensor IDs and their descriptions are also available in a separate mapping table as shown in Table 2. In here, sensor location is included in the description. For example, sensor 11NR008TE-001TRL is in room no.128 of the 8th floor.
Table 1. BMS data extraction.
Timestamp | 11NR008TE-001TRL | 11NR008TE-003TRL |
28-02-2021 00:02:00 | 22.1 | 21.1 |
28-02-2021 01:02:00 | 22.0 | 20.9 |
28-02-2021 02:02:00 | 21.9 | 20.8 |
28-02-2021 03:02:00 | 21.7 | 21.2 |
Table 2. BMS data point mapping table.
Item name | Description |
11NR008TE-001TRL | Room temperature 8_128 |
11NR008QT-040CO₂ | *CO₂ measurement 8_323 |
11NR008LT-001PIRTM | Presence 8_128 |
The BIM model used for this study represents the 8th and 9th floors of the case study building. It is developed in Autodesk Revit and includes space-related information (room name, room number, and the floor) and equipment-related information (sensors and lighting fixtures).
This section describes the integration of the time series data and the BIM model. An overview of the underlying data conversion and storage infrastructure is shown in Figure 1. We demonstrate the implementation using graph snippets, and the full implementation of the RDF graph, BIM model, IFC file and XKT file is available in the ISBE-TUe/atlas-building-graphrepository.
Several metadata representations that are useful in different phases of the building’s lifecycle are available. IFC is an industry-wide standard data schema for BIM and covers many aspects of the design and construction phases of a building [2]. Geometry, building elements, and product properties are represented in IFC. The IFCtoLBD converter [23] is the tool used to generate RDF triples using an IFC STEP file. It makes use of the BOT, RDFS, and PROPS ontologies. The tool presented in [23] is used in this study to generate the RDF model of the building. Part of the IFC file containing information about the room “test 1 area” is shown in Figure 2. In IFC, there is a Globally Unique Identifier (GUID) for every element and '0KLkXPBfvES9D1y7EjijkE' is the compressed GUID of the space.
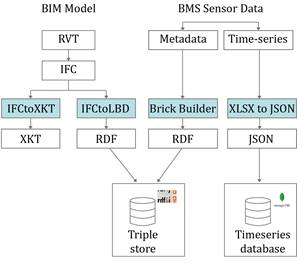
Figure 1. Data conversion and storage infrastructure.
1. #1266= IFCSPACE('0KLkXPBfvES9D1y7EjijkE',#42,'9',$,$,#1245,#1263,'test 1 area',.ELEMENT.,.SPACE.,$); |
Figure 2. Part of the IFC file containing IFCSPACE info.
The above IFC file, when converted to RDF, is shown in Figure 3. “Space_1266” is a bot:Space, in which the number 1266 is related to the line number of the IFC file. The room can be uniquely identified by its compressed GUID represented using props:hasCompressedGuid relationship.
1. inst:space_1266 a bot:Space ; 2. bot:containsElement inst:lightFixture_241729, 3. inst:lightFixture_241879, 4. inst:sensor_239793 ; 5. props:hasCompressedGuid "0KLkXPBfvES9D1y7EjijkE"^^xsd:string ; 6. bot:hasGuid "1456e859-2e9e-4e70-9341-f073adb2db8e"^^xsd:string ; |
Figure 3. Part of the graph generated by the IFCtoLBD converter.
The Revit model of the building used for the study does not contain the BMS sensors; therefore, they are not available in the above graph. However, a mapping table was available, as shown in Table 2, which was used to find sensor metadata. The type of sensor and its location is available in this table. This study relies on the Brick Ontology to represent the BMS sensor data points. The RDF graph is created using the Brick-builder [24] tool. A sample of the resulting graph with the relationships is shown in Figure 4.
1. inst:11NR008QT-301CO₂ a brick:CO₂_Sensor ; 2. rdfs:label "*CO₂_MEASUREMENT_8_140"^^xsd:string ; 3. brick:hasLocation inst:space_1266 . |
Figure 4. Relationships defined among columns of the CSV file.
The first RDF graph (Figure 3) semantically describes the context of the building, and the second graph (Figure 4) describes BMS sensors. These two graphs are stored in the RDF4J database [25] as two separate graphs. An instance of the resulting visual graph is shown in Figure 5.
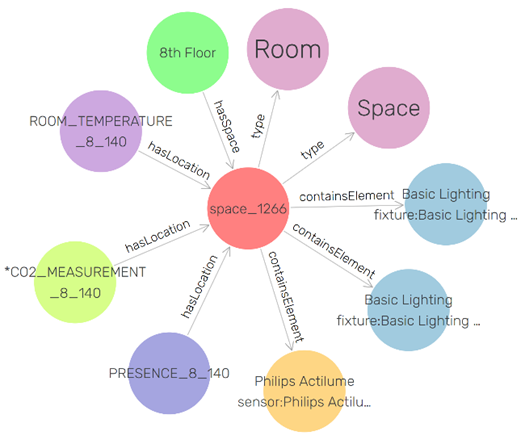
Figure 5. Graph representation of space_1266 using GraphDB.
Timeseries data fits well in a time series database; therefore, MongoDB Timeseries Collection is used to store the timeseries data. Time series collection has the advantage of improved query efficiency and reduced disk usage for time series data, compared to normal document collections [26]. The ideal situation would be to integrate an already available API of the BMS time series database to retrieve time series data. However, access to such API for the Atlas building was not available so the time series data had to be duplicated in our own database.
BIM-SIM is the web application developed to support the above tasks. The front end is built using React, a JavaScript framework. One intended application functionality is to view the building geometry in 3D using a web browser. The proposed approach utilizes xeokit, an open-source JavaScript 3D graphics Software Development Kit (SDK) from xeolabs [27] [28] to render the 3D file in the browser. The IFC model can be transformed into XKT format, using several open-source command-line tools described in [29]. Figure 6 shows the XKT file of the BIM model loaded in the web app.
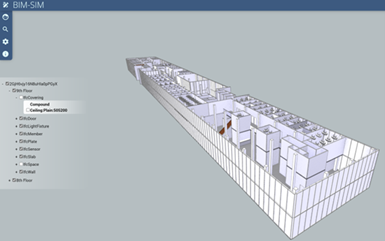
Figure 6. XKT file loaded in the web app.
When a particular space is selected from the 3D model, the front end application picks the element’s GUID, which is used to call the API, where a SPARQL query is executed to find all sensors in that space. A SPARQL query is sent in the request body in a POST request to the RDF4J server. Then the “Info window” is populated by the sensors in that space. These sensors are extracted from the RDF graph using the query shown in Figure 7.
1. PREFIX brick: <https://brickschema.org/schema/Brick#> 2. PREFIX inst: <http://linkedbuildingdata.net/ifc/resources20201208_005325/> 3. PREFIX props: <https://w3id.org/props#> 4. PREFIX rdf: <http://www.w3.org/1999/02/22-rdf-syntax-ns#> 5. SELECT * WHERE { 6. ?space props:hasCompressedGuid '0KLkXPBfvES9D1y7EjijkE' . 7. ?sensors brick:hasLocation ?space . 8. ?sensors rdf:type ?sensor_type . 9. } |
Figure 7. SPARQL query that runs in the API and retrieves the sensors in a given space.
This query results in three sensors contained in that space as shown in Table 3.
Table 3. SPARQL query results.
| space | sensors | sensor_type |
1 | inst:space_1266 | inst:11NR008LT-301PIRTM | brick:Occupancy_Sensor |
2 | inst:space_1266 | inst:11NR008QT-301CO₂ | brick:CO₂_Sensor |
3 | inst:space_1266 | inst:11NR008TE-301TRL | brick:Temperature_Sensor |
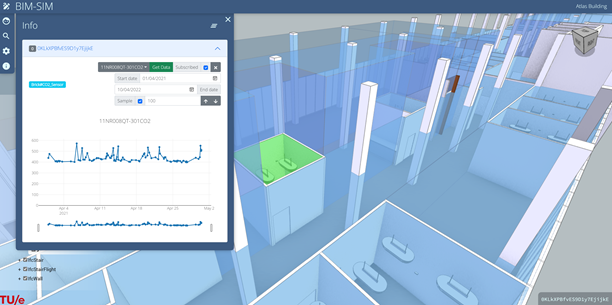
Figure 8. Info window populated with sensors from the SPARQL query.
Then, selecting a particular sensor from the list calls the API with the sensor ID, which sends a query to the MongoDB database to retrieve historical data that belongs to the sensor ID. Then, the returned time series data is displayed in a chart as shown in Figure 8. When displaying sensor data, its metadata is also displayed. In this example, it is limited to the type of sensor (Brick CO₂ Sensor), but this can be extended to display the location and other relationships as well, when such are available.
This paper provides a vendor-neutral method for integrating time series data with a BIM model. The BIM model is used as the primary information source to develop the knowledge graph of the building. Second, BMS sensor semantics is introduced as another graph, using the Brick ontology. The IFC file is also used as the 3D model of the building, but it is converted to the XKT format, which is suitable for web-based visualization where the file size is reduced, but the geometry information is preserved. The developed web application provides the opportunity to interact with the knowledge graph, the 3D model, and the BMS sensor data. This integration is achieved by leveraging Semantic Web technologies, an open-source 3D graphics SDK, an API, and state-of-art web tools. This application can further be extended and improved, as discussed below.
The conversion of IFC to XKT [29] is adequately fast for the simple model used in this study. However, the conversion time and the completeness of the converted file have not been investigated in this study. This aspect can be further investigated in future extensions of the study.
In addition to the utilised historical data, an IoT sensor network is being developed to collect and display real-time temperature, humidity and illumination data. Integrating the real-time data with the web application is possible using the MQTT JavaScript client with WebSocket, which is currently under implementation.
Although this study shows the implementation of an interactive monitoring application, other similar applications such as reporting on energy usage and indoor climate are also possible via the same resources. Most importantly, this platform needs to be extended to introduce data driven applications such as Fault Detection and Diagnostics (FDD), which can be implemented on top of the existing BMS infrastructure. The application shows potential for utilizing the BIM and time series integration to link the FDD results to the BIM model to visualize and locate faults in real time. Although basic semantics (location, type) have been used to describe BMS sensor data, the data model can be extended to include other metadata describing standardized semantic descriptions of the physical, logical, and virtual assets in buildings and their relationships, as required by data driven applications. However, while generating the semantic graph for the prototype implementation was a relatively easy task, the generation of a rich semantic graph with many systems can be a manual and time-consuming task. Recent developments to automate the generation of semantic graphs [30] can be used to improve the efficiency and effectiveness of this step.
In this study, the time series data is duplicated to our own database due to the lack of access to the actual BMS database by the time of writing this article. However, the API of existing BMS databases can be ideally used to access time series data. In that relation, adhering to the privacy, security and ethical data usage guidelines shall always be strictly followed when using building data, especially if the data contains sensitive information.
This project received funding from the Dutch Ministry of Economic Affairs and Climate Policy and Ministry of the Interior and Kingdom Relations under the MOOI program.
This article is based on the article “A web-based approach to BMS, BIM and IoT integration”, presented earlier this year at the CLIMA2022 conference as published in https://proceedings.open.tudelft.nl/clima2022/article/view/228
Please find the complete list of references in the original article available at https://doi.org/10.34641/clima.2022.228
Follow us on social media accounts to stay up to date with REHVA actualities
0