


Stay Informed
Follow us on social media accounts to stay up to date with REHVA actualities
|
|
|
Shunsuke Kimura | Michio Moriwaki | Manabu Yoshimi |
Technology and Innovation Centre, Daikin Industries, Ltd., Osaka, Japan | Daikin Comfort Technologies Manufacturing L.P., Texas, USA | Technology and Innovation Centre, Daikin Industries, Ltd., Osaka, Japan |
|
|
|
Shohei Yamada | Takeshi Hikawa | Shinichi Kasahara |
Technology and Innovation Centre, Daikin Industries, Ltd., Osaka, Japan | Technology and Innovation Centre, Daikin Industries, Ltd., Osaka, Japan | Technology and Innovation Centre, Daikin Industries, Ltd., Osaka, JapanCorresponding author: Shinichi Kasahara |
The F-Gas Regulation, which came into force in Europe in 2006, was revised in 2015 [1] and penalties were implemented in many countries, which has energised the development of leakage detection systems. In recent years, the development of big data analysis technology has led to numerous proposals of machine learning based refrigerant leakage detection systems.
According to Hosseini et. al. [2], 82 papers have been published worldwide on machine learning based air conditioner fault detection systems between 2016 and 2020, 10 of which are on leakage detection. Out of these 10 papers on leakage detection, 6 papers are on VRF.
However, most of these papers were validated using simulations or experimental data obtained in laboratories, and only few of them were validated using actual on-site operating data. Therefore, a leakage detection system for VRF equipment during cooling/heating operation that uses machine learning operated on a remote monitoring system was developed, and its detection accuracy was validated using a large amount of on-site data [3-4]. Also, a leakage detection system for chillers was developed applying this technology, which has been launched in Europe. This paper presents a summary of these developed leakage detection system.
The leakage detection system estimates the refrigerant charge amount from the operating data acquired from chiller and VRF equipment,and automatically detects leakages. Figure 1 shows an overview of the developed system.
The leakage detection system calculates the RLI (Refrigerant Leak Index), an index strongly correlated with the refrigerant charge amount, from the operating data and detects leakages based on changes in this value.
The RLI used in chiller and VRF cooling operations is a dimensionless value defined as the ratio of the area of the liquid region to the area of the saturated region on the T-S diagram, as shown in Figure 1. As the refrigerant charge amount decreases due to leaks, the RLI also decreases.
During the heating operations, the degree of superheat of the compressor discharge temperature (DSH) is used instead of the above RLI. When the refrigerant amount decreases due to leaks, the discharge temperature rises and so does the DSH.
The RLI and DSH changes not only due to the refrigerant amount, but also due to external disturbances such as outside temperature and compressor speed. Therefore, even though there is no refrigerant leak, the RLI may drop due to the disturbances and the detection algorithm may misjudge it as a leak.
Toprevent this, the disturbances from RLI is removed and the index ΔRLI, which represents only the variation of the refrigerant charge amount, is calculated. As shown in Figure 1, ΔRLI is the difference between the actual RLI calculated directly from the operating data and the predicted RLI under normal conditions. This predicted RLI is calculated by a prediction model created using machine learning (ML) from past normal operating data. The disturbances for DSH, which is an index for heating, is removed in the same way as above, and ΔDSH is calculated as an index of the changes in only the refrigerant charge amount.
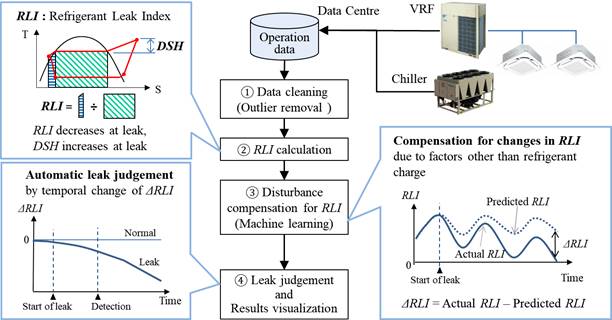
Figure 1. Overview of the leakage detection system.
Since VRFs have enough operating data stored in the data centre, it is possible to create an RLI prediction model for normal conditions using these as training data. However, the stored data contain both normal data and anomalous data. Therefore, in the process of data cleaning, only normal data were extracted from the stored data as training data. The extraction was carried out in the following two stages.
First, the data of equipment without failure records and equipment with completed failure repairs were extracted. Next, the mean value of RLI, an index of refrigerant charge amount, was then calculated for each extracted equipment. The relative frequency distribution of these values is close to the black line of normal distribution curve shown in Figure 2.
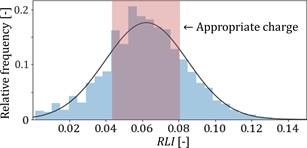
Figure 2. Distribution of RLI.
This distribution is caused by the refrigerant charging process during installation and the refrigerant recovery and recharging process before and after maintenances such as component replacement.
The equipment with a value near the centre of the distribution curve (the red area in the figure) is the equipment charged with the appropriate amount of refrigerant, and its operating data is determined to be available for training.
Using the training data, a prediction model of normal RLI was created by LightGBM [5]. The explanatory variables used in the model were outdoor temperature, compressor speed, compressor current, and opening of the expansion valve for subcooling heat exchanger control. The normal DSH prediction model for heating was also created in the same way: the explanatory variables were outdoor temperature, compressor speed, total capacity of indoor unit in operation and opening of the expansion valve for subcooling heat exchanger control.
The leaks found in the first process and the data during the failure period were labelled according to the failure and used as the anomaly data for the validation of leakage detection accuracy.
The prediction model for the chiller was created in a different way from that for the VRF. For chillers, there was almost no stored data for RLI calculation. Therefore, a chiller was installed in a climate chamber, and tests were carried out under various conditions simulating actual operating conditions to obtain training data.
The four test conditions to be varied were outdoor temperature, compressor load ratio, leaving water temperature (LWT) and refrigerant charge amount as leak condition.
If the conditions are set to cover the entire variation range of all parameters uniformly, the number of test man-hours will be huge. Therefore, to create an accurate prediction model while reducing the number of test man-hours, the test conditions were chosen from the frequently occurring operating conditions from the on-site data.
Considering both characteristics, the combinations of test conditions set within the variation range of outdoor temperature and compressor load ratio are shown in Figure 3. In the 27 conditions set, priority is given to the ESEER (European Seasonal Energy Efficiency Ratio) condition and the area below the ESEER condition (1), which has a high frequency of occurrence in air-conditioning applications, and to the area (2), which has a high frequency of occurrence in process temperature control applications.
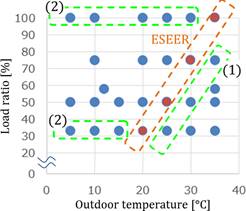
Figure 3. Combination of outdoor temperature and compressor load ratio set for the test.
For the LWT data, four conditions of 5, 7, 11 and 13°C were chosen, focusing on the areas with the highest frequency of occurrence.
The data obtained from the tests carried out based on the above test conditions were used as training data, and a normal RLI prediction model was developed using random forest regression. The six explanatory variables are outdoor temperature, compressor load ratio, LWT, main expansion valve opening, economizer expansion valve opening and compressor current.
The training data for the prediction model are randomly selected from 70% of the data with 100% refrigerant charge amount. The remaining data with 100% refrigerant charge amount and the data with 120, 90, 85 and 80% refrigerant charge amount were used as the test data for the validation of leakage detection accuracy.
The automatic leakage detection logic outputs judgementresults of leakage based on the decrease in ΔRLI. Figure 4 shows an overview of the logic for the automatic judgement of refrigerant leakage.
The detection logic consists of a moving window with N terms, a planar mapping section, an anomaly calculation section and a judgement section. The planar mapping section maps the points whose coordinates are two adjacent points ΔRLI(t-1) and ΔRLI(t) onto the plane whose axes are ΔRLI(t-1) and ΔRLI(t) at any given time.
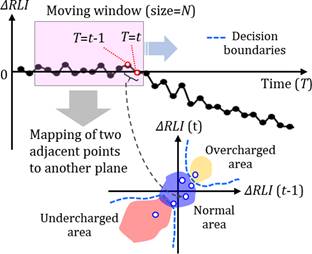
Figure 4. Overview of the automatic leakage detection logic.
The mapping plane is pre-classified into normal, undercharged, and overcharged areas based on the decision boundaries plotted by machine learning. The undercharged area is in the third quadrant and the overcharged area is in the first quadrant. The anomaly calculation section calculates the anomaly score defined by the following equation (1) when the N-1 points created from the N data in the moving window have been mapped to another plane.
Anomaly score = | Number of points in undercharged region |
| (1) |
N − 1 |
|
When this value exceeds a certain threshold, it is judged that there is a leak. If the distribution of points is mapped in the undercharged area from the beginning of operation, it is judged to be undercharged initially. If the distribution of points is mapped in the overcharged area from the beginning of operation, it is judged to be overcharged initially.
In the case of heating, the leakage index is ΔDSH, which increases opposite to ΔRLI during leakage, thus the undercharged area is distributed on the first quadrant.
The responses of ΔRLI and ΔDSH in VRF equipment were evaluated. Figure 5 shows the leak detection results; the upper plot is for cooling operation of equipment where 15% of the refrigerant charge amount was recovered to simulate a leak: the lower plot is for heating operation of leaking equipment.
In both figure, the red line represents the actual RLI and DSH calculated directly from the operating data, the blue line represents the RLI and DSH predicted by the normal prediction model and the grey line at the bottom represents their differences ΔRLI and ΔDSH, the red areas labelled "Leak" are the period during which the detection logic judged as a leak.
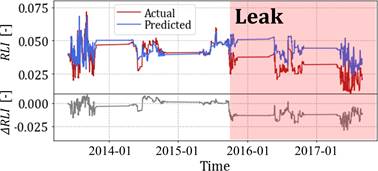
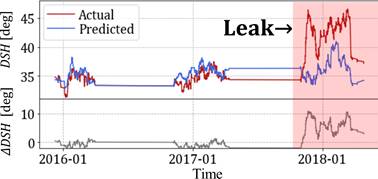
Figure 5. RLI and DSH responses at leaking equipment for cooling and heating operation.
In normal operation period, the actual values for both cooling and heating are close to the predicted values and the differences, ΔRLI and ΔDSH are almost 0. On the other hand, during leak period, the actual values for both cooling and heating differ significantly from the predicted values. Thus, the ΔRLI and ΔDSH values are sufficient for the automatic detection logic to detect the leak correctly.
Next, the leakage detection was carried out for several test data obtained from the stored data and the accuracy of the detection was evaluated from the confusion matrix of the detection results. The confusion matrix is a combination of the correct and incorrect judgment results for the actual equipment state (normal or leaking), and its definition is given in Table 1. The judgment performance was evaluated by two indices, accuracy and false discovery rate (FDR), as shown below.
Table 1. Definition of confusion matrix.
| Predicted | ||
Normal | Leak | ||
Actual | Normal | TN | FP |
Leak | FN | TP | |
Accuracy = | TP+ TN |
| (2) |
TP + TN + FP + FN |
|
False discovery rate (FDR) = | FP |
| (3) |
TP + FP |
|
The accuracy is the ratio of correct predictions among the total number of test cases. The FDR is the proportion of normal equipment misclassified as leaks among the equipment classified as leaks.
When assuming the actual operation of a refrigerant leakage detection system, it is important to keep the FDR as low as possible. This is because misjudgement of normal equipment as leaking equipment not only increases operating costs due to the unnecessary dispatch of service personnel, but also leads to a loss of user confidence in the detection system. Considering these factors, the target accuracy and FDR of the current fault diagnosis by remote monitoring is set to be 80% or higher and 10% or lower, respectively.
Table 2. Confusion matrix of leakage detection evaluation results for cooling and heating.
|
|
| Predicted | |
|
|
| Normal | Leak |
Actual | Normal | Cooling | 93.7% (119) | 6.3% (8) |
Heating | 98.8% (82) | 1.2% (1) | ||
Leak | Cooling | 14.9% (7) | 85.1% (40) | |
Heating | 21.5% (6) | 78.5% (22) | ||
Table 2 show the confusion matrices for cooling and heating. Each element of the confusion matrix in the table shows the incidence rate of normal and leakage detection against the actual number of normal and leak equipment. The number in () is the number of detections.
The accuracy and the FDR calculated from equations (2) and (3) are shown in Table 3. The accuracy of 80% or higher and the FDR of 10% or lower were achieved in both cooling and heating. The incidence rates in Table 2 were used for the calculations. The reason is that if there is a large difference between the number of normal equipment and the number of leaking equipment, the judgment result is affected by it. By using the incidence rates, this effect can be eliminated.
Table 3. Accuracy and FDR in cooling and heating operation.
| Operation mode | |
Cooling | Heating | |
Accuracy | 89.4% | 88.7% |
FDR | 6.9% | 1.5% |
Finally, the sensitivity of leakage detection was evaluated by obtaining estimates of the leakage amount at the time when the automatic detection logic judged a leak for true positive (TP) equipment. In this paper, the definition of refrigerant leak rate is the ratio of leaked refrigerant amount to the initial charge amount, as commonly used in refrigerant regulations. To estimate the leakage amount at the time of the detection, the conversion coefficient of the changed refrigerant charge amount (% of total refrigerant amount) and RLI and DSH were determined first. To do this, the data of equipment for which the leakage amount could be identified from the repair records etc. were used. The leakage amount was calculated by multiplying the change in RLI and DSH by the conversion coefficient. The relative frequency distribution of the estimated leakage amounts and the dotted line approximating it with a normal distribution are shown in Figure 6. From the mean μ and standard deviation σ of the normal distribution, the mean detection sensitivities were defined as μ and the worst detection sensitivity as μ + 3σ, resulting in the sensitivities shown in Figure 6. Since the current detection logic for VRF has a detection sensitivity of more than 50%, this method improves the detection sensitivity by 30% over the conventional method.
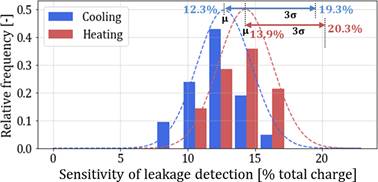
Figure 6. Sensitivity of leakage detection in cooling and heating operation.
The responses of ΔRLI in chiller equipment were evaluated. Figure 7 shows the leak detection result for cooling operation of leaking equipment. The legend is the same as in Figure 5. The detection result was as good as for the VRFs.In this case, the detection was obtained immediately after the leakage occurred and the leakage point was repaired in only 10 days.
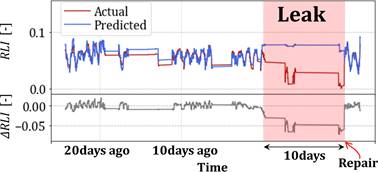
Figure 7. RLI responses at leaking equipment for cooling operation.
For chillers, there are few stored data on leaking equipment, the evaluation in a confusion matrix was done with the test data in the climate chamber.
Table 4 shows a confusion matrix of the results obtained by performing the same evaluation as above on the test data for various operating conditions varying outdoor temperature, compressor load ratio, LWT and refrigerant charge amount. The breakdown of test conditions is 56 conditions of normal data with 100% refrigerant charge amount, and 52 conditions of leak data with 85% and 80% refrigerant charge amount. 86.5% of the accuracy and 0% of the FDR are calculated by the same method as VRF.
Table 4. Confusion matrix of leakage detection results.
| Predicted | ||
Normal | Leak | ||
Actual | Normal | 56 | 0 |
Leak | 14 | 38 | |
An indirect refrigerant leakage detection system based on machine learning was developed and its performance was validated on VRFs and chillers. The detection sensitivity was normally distributed according to the operating conditions and equipment characteristics and was able to detect leaks of 15% of the initial refrigerant charge amount on average and 20% at worst. There is room for improvement in accuracy by modifying the machine learning model and the training data. The next target is to improve the accuracy to detect 10% of leaks in the future.
Please find the full list of references in the original article at: https://proceedings.open.tudelft.nl/clima2022/article/view/373
Follow us on social media accounts to stay up to date with REHVA actualities
0