

Stay Informed
Follow us on social media accounts to stay up to date with REHVA actualities
|
|
Ken DooleyTechnology Director, | Davor StjeljaConsultant, |
The current method of analysing the environmental impact of existing buildings is to normalise consumption by building size. This is done for energy, water and carbon dioxide and building size is typically defined by net internal area. The simple reason for doing this is that buildings of different sizes can be compared with one another. This practice is reinforced by national building regulations which aim to reduce consumption in buildings and the legal requirements regarding energy efficiency commonly present their target criteria in the format of energy per unit area such as kWh/m². The problem with this is that the influence of the occupancy patters are being overlooked when we only consider the amount of energy consumed and the building size.
For example the Finnish national energy efficiency regulations for buildings has defined the maximum amount of energy that new buildings can consume and this is presented in the format of energy per square meter [1]. In order to simplify the comparison for different buildings, the regulation assumes that the buildings are occupied in a standard manner. If office buildings are taken as an example, then the predefined occupancy pattern is 5 days a week from 07:00–18:00 and during these hours it is assumed that 65% of the staff are present. It can clearly be seen here that the influence of the building’s individual occupancy patterns are being overlooked. However, there is growing call to normalize buildings with patterns of use and with occupancy patterns in particular [2,3,4,5]. The most comprehensive approaches have called for energy to be normalized by the combination of area and total person hours per year where total person hours per year is the sum of all of the time that each building user spent in the building during the year in question [2,4]. Furthermore, this intention has been included in European Standard EN15643-1 which advocates that patterns of use should be used in the sustainability assessment of buildings [6]. At present, the legal requirements for energy efficiency are only imposed on buildings when they are being designed or renovated and at this point the energy consumption and patterns of use that are used are estimated and not measured values. There is no legal pressure to conform any post-occupancy energy consumption requirements.
It has been widely discussed that office buildings are only partially occupied during opening hours. The British Council for Offices stated as recently as 2013 that occupancy levels are typically between 60-70% [7]. This means that on average in office buildings 30-40% of the desks are empty during working hours. In addition, there is a wide variation between occupation densities from 7 m² of floor area per person to as much as 19 m² per person for private offices [8]. According to the British Council for Offices the mean occupation density is 10.9 m² per occupied workspace [7]. It is important at this point in the discussion, to note that consumption should be normalised by measured post-occupancy patterns and not the occupancy patterns used in design. Energy consumption has in the past been presented in the form of energy per person where the number of people has been defined by the number of desks in the building or number of staff that the building has been designed for. However, these design numbers are not suitable due to the low occupancy levels of buildings during their use. Also, Dooley [4] points out that energy per person does account for occupation density but does not account for working hours per day which also influences consumption. Thus, energy normalised by the combination of area and total person hours per year is a more suitable metric than energy per person.
Patterns of use have a strong influence on the environmental impact of the existing building stock. If office buildings are on average 30-40% empty during working hours then energy is being consumed by the unused area even if it is empty. It is being heated in winter, cooled in summer, ventilated and background lit all year round. Also, the embodied carbon emissions of the materials used to construct the building are not being optimised if a large portion of the building is consistently unused. Underutilised buildings can contribute to urban sprawl as new buildings are being built on the edge of cities while many spaces that are already constructed are unused. This is similar to how AirBnB has optimized the use of homes and this has resulted in less new hotels being built. Increasing the use of our existing buildings will make the built environment more resource efficient and will reduce the need for new buildings to be built. It also makes sound financial sense to optimise space use as according to a report published in 2014 by Finnish space efficiency experts, Rapal, the average annual cost per annum of a workstation in Helsinki is € 9225 [9]. The report also notes that Helsinki has only the 15th most expensive occupancy costs in the world and thus the cost per workstation is even higher in a number of other cities.
Public bodies are now beginning to see this error and are starting to increase the use of their buildings. In 2014, it was reported that spaces in government buildings in Seoul, South Korea, were being opened and offered for use by the public. At the time of that publication 970 empty spaces, such as conference rooms and auditoriums had already been used in 22,931 cases [10]. This is part of wider plan in Seoul to promote sharing of unused resources in order to achieve a more practical and sustainable way of living. At this point it should be clarified that the aim for efficient use of space should not compromise the comfort or productivity of the building users and it has been shown by many researchers that it is possible to provide quality and productive indoor workspace environments at high occupancy densities [11,12,13,14,15].
The European Commission plans to reduce greenhouse gas emissions by at least 80% by 2050, compared to 1990, with the intention of keeping climate change below two degrees Celsius [16]. In order to achieve this, the building sector must be considered. Previous research has stated that the building sector consumes approximately 39% of the total energy consumption and emits approximately 35% of the total CO2 emissions in Europe and thus it is an important sector when aiming to reduce global greenhouse gas emissions [17]. This article focuses on office buildings which is the largest commercial building sector in terms of floor space and energy use in most countries [18]. The aim of the article is to uncover: can measured occupancy data assist the implementation of resource efficiency and energy efficiency strategies in existing buildings?
In order to collect empirical data on energy consumption and usage patterns, two video cameras were installed in an office building in Helsinki, Finland. The dome video cameras were chosen as they were compatible with a commercial people counting software which is typically used in retail buildings to monitor the number of visitors over a period of time. The studied area was a portion of the third floor of a three floor office building. Its floor area was approximately 650 m² and it mainly comprised of a large open office area, three meeting rooms, a small kitchenette and a break area. The case study area can be seen enclosed by a red box in Figure 1. This area was chosen as it was the only part of the building that had less than three entrance and exit routes and this greatly simplified the installation and the analysis of the camera data. The analysis of a whole floor could not be done as it was not possible to study people movement at the main entrance to each floor. The reason for this was that the camera software could not function correctly if the cameras were installed inside the door as at this point there was movement in two perpendicular directions (in/out of the door and movement up/down the adjacent corridor). In addition to this, there was a fire zone in the stair core outside the entrance to each floor which meant that this location was not suitable for camera installations. Figure 2 shows a camera installed in the ceiling of the case study building and Figure 3 shows an image from the people counting software which displays a real-time view from one of the cameras and the most recent results from that camera.
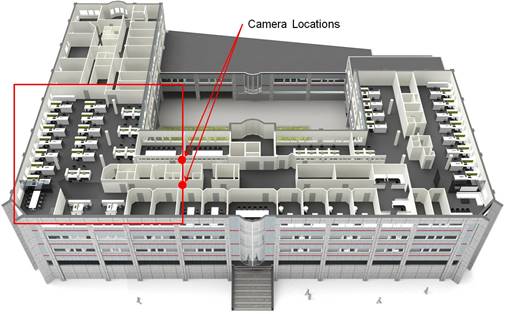
Figure 1. The Camera Locations and the Studied Area within the Case Study Office Building.
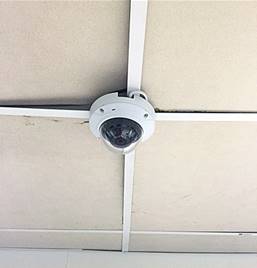
Figure 2. An Installed Camera in the Case Study Building.
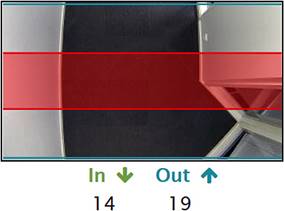
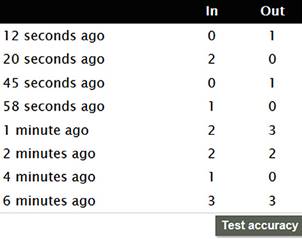
Figure 3. An Image from the People Counting Software.
The study was carried out for the whole month of May 2016. May was suitable from an energy consumption point of view as it is falls outside the hottest and coldest periods of the year. May was also suitable from an occupancy point of view as it was not affected by the Finnish summer holiday period which generally occurs from June to August. Thus the results for May should be a suitable representation of the whole year. Cameras were installed as the existing building systems were not considered adequate to count the number of building users accurately. A time card system is in place for the building users to clock in and out but it is not used by all employees and it is not used by visitors. RFID cards are used to open the doors to each floor in the building but this system could not be used to count people because of a tailgating problem. Tailgating is when where many people enter or leave the building after one person has unlocked the door with their card. The cameras were installed in the ceiling and pointed straight down so that the faces of the people passing beneath them could not be seen. This meant that privacy was less of an issue when compared to other security camera systems which are pointed directly at people as they approach. This is an important point as it has been claimed by previous researchers that privacy is the main factor that prevents vision based occupancy monitoring from being widely implemented [19].
The purpose of the software is to count the number of people passing in real-time and also to calculate their direction of travel. The output file of each camera reports the number of people that travel in each direction for each 15 minute interval. The data from the cameras was then combined to calculate the number of people that occupied the case study area for each for each 15 minute interval of the month in question. The case study building is open for 16 hours each day from 06:00 - 22:00 and the counting software was reset to zero at midnight every night. One simple way of detecting error within the results of the counting software was to view the occupancy after 22:00. If the software reported that there was someone still occupying the studied area after 22:00 then it had failed to correctly detect all of the people that had left the studied area during the day and if the combined count was negative after 22:00 then it had failed to correctly detect all of the people that had entered the studied area during the day.
The energy consumption of the case study area during the month of May 2016 has been calculated by using the measured energy consumption for the whole building and proportioning this by area. The building is occupied by only one company and all areas have a similar function and utilisation rate and thus this was considered the best approach in the absence of sub-metering for the case study area. In addition to this, energy simulations were made to further understand the results of the occupancy measurements. The annual energy consumption of the building was calculated in order to examine the energy consumption of the case study open office with three alternative floor areas where each floor area relates to different workplace arrangement strategy. A full dynamic energy simulation was created using the programme IES Virtual Environment.
During the study it was observed that the results continuously reported a positive number of occupants after 22:00 and thus the software was not correctly detecting all of the people that had left the studied area during the day. In order to account for this error, the footage of one full day was observed for both cameras and a manual count was carried out. The comparison of the counting software and the manual count showed that the error was relatively evenly distributed over the whole day. It was observed that the error was caused by a counting error at the times of the day when large groups of people enter or leave the space simultaneously such as the beginning of the day, at the beginning and end of lunchtime or in the evening. Based on this, following method for error correction was developed. Time periods with higher number of simultaneous passengers are presumed to have higher probability of counting error and therefore higher correction is applied to these periods, while for periods with lower number of simultaneous passengers, lower correction is presumed respectively. This not only removes the error but it also preserves occupancy profile.
The measured peak occupancy of the open office area is particularly interesting with regard to the size of the area and required number of desks. The peak was measured on Tuesday the 10th of May and the occupancy curve for that day may be seen in Figure 4. The open office area does not operate on a one desk per person policy and instead a desk sharing workplace arrangement strategy has been introduced to the area. In total there are 66 employees and the number of desks is 54. The result is an average desk allocation density of 8.85 m². When the peak day is used to compare the measured occupancy with the design occupancy we see that the peak measured occupancy of 44 people is 18.5% lower than the number of desks and that the measured occupancy is 33% lower than the total number of staff. It was also observed that the utilisation for all 5 weekdays is similar as may be seen by Figure 5.
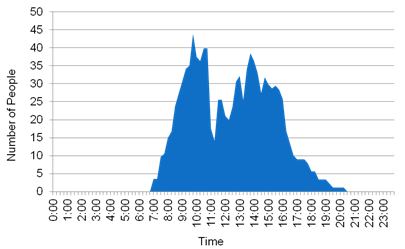
Figure 4. The Peak Occupancy Rate of the Open Office Area.
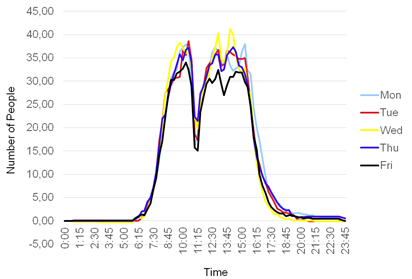
Figure 5. The Average Occupancy Rate for Each Weekday of the Case Study Area.
The collected data also enables the measured occupancy to be compared with the energy consumption of the case study building and this in turn enables the logic of the building management system (BMS) schedules and the overall control strategy of the building’s energy consuming systems to be interrogated. By comparing the occupancy curve and the energy consumption curve we can see when energy was consumed and this can be compared to the level of occupancy. This is demonstrated by Figure 6. It is important to note that the Figure 6 shows the percentage that each hour contributes to the total energy consumption for the peak occupancy day. The Figure 6 also shows the percentage that each hour contributes to the total person hours for that day. For example, it can be seen that 27.4% of the energy is consumed from midnight to 07:00 and 21:00 to midnight when the area is unoccupied and 34.1% of the energy is consumed from midnight to 07:00 and 19:00 to midnight when the occupancy rate is less than 1% of the total person hours per day.
The breakdown of the energy consumption suggests that the heating consumption is relatively steady over the course of the whole day and this can be explained by a background heating demand in the night-time and a moderate load in the day-time as the internal gains from people, equipment and lighting assist the heating of the building. The electricity consumption has been subdivided into lighting, small power, ventilation and cooling and the comparison of these consumptons with the level of occupany may be seen in Figure 7.
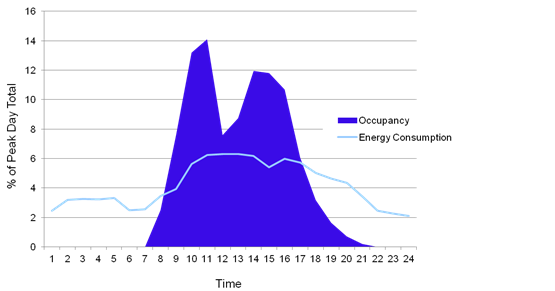
Figure 6. The Proportion of Total (Heating and Electricity) Energy Consumption and the Occupancy Rate for Each Hour of the Peak Occupancy Day.
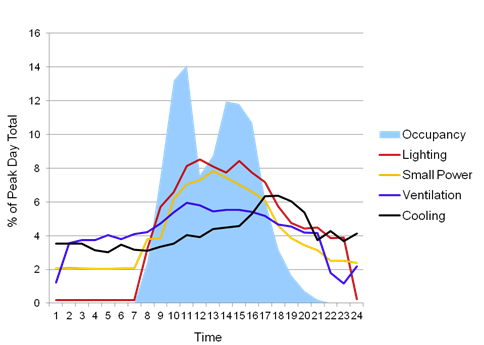
Figure 7. The Proportion of the Electrical Energy Consumption and the Occupancy Rate for Each Hour of the Peak Occupancy Day.
From the evidence provided by Figure 7 it can be deduced that the lighting control systems are suitably configured in the morning (00:00-07:00) but less so in the night-time (21:00-00:00). Also there is surprisingly high small power load, ventilation and cooling load outside of the buildings operational hours (06:00-22:00). It is typical to heat buildings at night-time but it can be expected that the electrical loads are easier to switch off outside the operational hours. Furthermore, if we apply the same comparison to the electrical consumption that was done to the energy consumption above we see that: 23.7% of the electrical energy is consumed from midnight to 07:00 and 21:00 to midnight when the area is unoccupied and 31.6% of the electrical energy is consumed from midnight to 07:00 and 19:00 to midnight when the occupancy rate is less than 1% of the total person hours per day.
The desk sharing workplace arrangement strategy of the open office area provided enough desks for 54 of the 66 staff and as a result the office space can assumed to be 18% smaller than if a desk had been provided for each employee. A dynamic energy simulation was used to compare the energy consumption implications of optimising the number of desks in office areas. In all, the energy consumption of three alternative open office areas were simulated. The first office area was 644 m² and represented the scenario where each member of staff was allocated a desk and the second office area was 527 m² and represented the studied open office area with 54 desks. The final simulation concerned an office area of 429 m² which represented the scenario where the number of desks matched the measured peak occupancy of the open office area which was 44 people. The energy consumption of all three areas can be seen in Table 1.
The results show that optimising the size of the occupied area has a substantial impact on energy consumption. The current policy of providing 54 desks for 66 people has reduced the energy consumption by 14% compared to the calculated energy consumption of the traditional one desk per person strategy. However, our calculations show that the energy consumption could be reduced by a further 16% if the number of desks were to match the measured peak occupancy.
Table 1. The Energy Simulation Results for the Open Office Area.
Simulation | Number of Employees | Number of Desks | Area | Annual Energy Consumption | |||
# | # | # | (%) | (m²) | (%) | (MWh) | % |
1 | 66 | 66 | 100 | 644 | 100 | 85.6 | 100 |
2 | 66 | 54 | 82 | 527 | 82 | 73.2 | 86 |
3 | 66 | 44 | 67 | 429 | 67 | 59.6 | 70 |
The original objective of this study was to explore if occupancy data can assist the implementation of resource efficiency and energy efficiency strategies in existing buildings. It is acknowledged that the data is difficult to obtain, however, it was demonstrated that usage patterns are an important factor in understanding the energy consumption of a building.
It has been shown that daily occupancy curves add valuable information regarding the control strategies of the energy using systems in office buildings. The case study building is open from 06:00-22:00 and it is important to understand if the building is occupied for the whole day. It is clear that the building is very likely to be occupied from 09:00-17:00 but without occupancy data it is impossible to accurately know the occupancy rates at the beginning and end of the day. The schedules of the energy consuming systems can be optimised based on the collected data. It is common place for the energy consuming systems to have schedules but maybe the spaces could have schedules too. New workplace arrangement strategies are emerging all the time and they are being driven by the rise of remote working and new hot desking strategies such as coworking. In offices that practice desk sharing it can be assumed that all employees have laptops and can sit at any desk. With this in mind one future area of research shall be to examine the benefits of gradually shutting down the building. For example instead of having the whole building open from 06:00-22:00, two of the three floors could be shut down from 18:00 onwards as at this time the occupancy rate is less than 10% of the peak occupancy.
The peak occupancy rate of the individual building areas is also a valuable piece of information and in a building with desk sharing it can be used to calculate the minimum number of workplaces that should be available. The fact that only providing 44 desks for 66 employees reduces the energy consumption by 30% shows that the amount of area that is reserved is a key driver in the energy consumption of offices. Resource efficient workplace arrangement strategies that focus on space optimisation reduce costs associated with rent and energy and also reduce the environmental impact of buildings through energy reduction and through the reduced need for new buildings.
Another emerging strategy is to rent out unused spaces in commercial buildings to the public via sharing economy websites which essentially act as the AirBnB of commercial buildings. There are already a number of these websites such as Eventup, Splacer, Venuetastic, Venuu, and Flextila. Occupancy data can show the building managers when their spaces are empty and thus are available to be offered online.
One clear limitation of this study was that the area in which occupancy was measured was a small portion of the case study building. If the occupancy of the whole building could have been measured then the energy consumption of the studied area could have been more accurately calculated. The small case study area also contributed to the weekend occupancy being difficult to measure. It was observed that the daily energy consumption at the weekend is approximately 30% of typical weekday total and it is estimated that the peak occupancy is less than 5% but the occupancy could not be accurately calculated. Further studies are required to understand the strategies that could be employed in order to reduce the environmental impact of the weekend days as the building must be able to operate as normal but that occupancy rates are very low.
This research has been supported by the NewTREND research project (www.newtrend-project.eu) which has been funded by the European Commission’s Horizon 2020 research framework programme.
[1] Finnish Ministry of the Environment, 2012. Energy Efficiency of Buildings: Regulations and guidelines.
[2] Cole, R.J., 2001. Lessons learned, future directions and issues for GBC. Building Research & Information 29(5), 355–373.
[3] Sekki, T., Airaksinen, M. and Saari, A., 2015. Impact of building usage and occupancy on energy consumption in Finnish daycare and school buildings. Energy and Buildings, 105, 247–257.
[4] Dooley, K., 2011, “New Ways of Working: Linking Energy Consumption to People”, paper presented at the 6th World Sustainable Building Conference, Helsinki, Finland, 18-21 October.
[5] Huovila, A., Tyni, A. and Dooley, K., 2013. “Building occupancy as an aspect of energy efficiency”, paper presented at Sustainable Building 13 Conference, Dubai, UAE, December 8-10.
[6] European Committee for Standardization, 2011. EN 15643-2:2011: Framework for the assessment of environmental performance.
[7] British Council for Offices, 2013. Occupier Density Study.
[8] Korolija, I., Marjanovic-Halburd, L., Zhang, Y. and Hanby, V.I., 2013. UK office buildings archetypal model as methodological approach in development of regression models for predicting building energy consumption from heating and cooling demands. Energy and Buildings, 60, 152–162.
[9] Rapal, Space efficiency and space satisfaction in the Helsinki region [online]. Retrieved from: http://rapal.fi/wp-content/uploads/2014/10/Space-efficiency-and-satisfaction-in-the-Helsinki-region.pdf [Retrieved on 22 September 2015].
[10] Creative Commons Korea, 2014. Share Hub Annual Report.
[11] Brunia, S., De Been, I., van der Voordt, T.J.M., 2016. Accommodating new ways of working: lessons from best practices and worst cases. Journal of Corporate Real Estate, 18(1), 30–47.
[12] Harris, R., 2016. New organisations and new workplaces: Implications for workplace design and management. Journal of Corporate Real Estate, 18(1), 4–16.
[13] Kim, J., Candido, C., Thomas, L. and de Dear, R., 2016. Desk ownership in the workplace: The effect of non-territorial working on employee workplace satisfaction, perceived productivity and health. Building and Environment, 103, 203–214.
[14] Petrulaitiene, V., Jylhä, T., 2015. The perceived value of workplace concepts for organisations. Journal of Corporate Real Estate, 17(4), 260–281.
[15] Ekstrand, M., Damman, S., 2016. Front and backstage in the workplace: An explorative case study on activity based working and employee perceptions of control over work-related demands. Journal of Facilities Management, 14(2), 188–202.
[16] European Commission, 2011. A Roadmap for moving to a competitive low carbon economy in 2050.
[17] Dascalaki, E. G., Droutsa, K., Gaglia, A. G., Kontoyiannidis, S. and Balaras, C. A., 2010. Data collection and analysis of the building stock and its energy performance – An example for Hellenic buildings. Energy and Buildings, 42, 1231–1237.
[18] Nguyen, T.A. and Aiello, M., 2013. Energy intelligent buildings based on user activity: A survey. Energy and Buildings, 56, 244–257.
[19] Li, N., Calis, G. and Becerik-Gerber, B., 2012. Measuring and monitoring occupancy with an RFID based system for demand-driven HVAC operations. Automation in Construction, 24, 89–99.
Follow us on social media accounts to stay up to date with REHVA actualities
0