


Stay Informed
Follow us on social media accounts to stay up to date with REHVA actualities
|
|
|
|
|
Alessandro Nocente1* | Berit Time1 | Tore Kvande2 | Hans Martin Mathisen2 | Arild Gustavsen2 |
1 SINTEF AS, Trondheim, Norway2 Norwegian University of Science and Technology (NTNU), Trondheim, Norway*corresponding author: alessandro.nocente@sintef.no | ||||
The laboratory/test building ZEB Laboratory [1] is located in Trondheim at the NTNU Gløshaugen campus. It is a 4-storey office building with a total area of 2000 m². The ZEB Laboratory was designed and realised with the aim to be a pilot building used to facilitate the diffusion of new environmentally friendly building components, solutions, and processes and as an arena for national and international research cooperation.
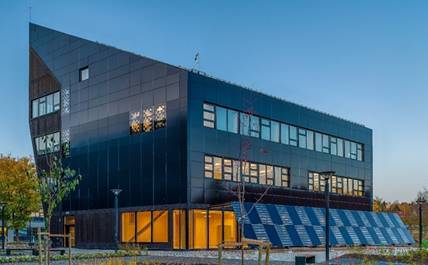
Figure 1. The ZEB Laboratory: Southern and Western façade. [© Photo: M. Herzog / www.visualis-images.com]
Norway, through the work of the ZEB Research Centre [2], defined five levels of nearly zero energy building as encouraged by the EU Commission [3]. The ZEB Laboratory was built according to the ZEB-COM level. This means that the in loco production of renewable energy (hence the reduction of potential emission) must compensate the CO₂ generated by the construction and the use of the building in its planned lifetime, and the CO₂ embodied in the materials. The construction process, the building envelope, building service systems, and materials and components used are selected to ensure very low construction, operational and embodies emissions as well as a highly energy efficient building [4]. The renewable energy production is entirely achieved by Building Integrated Photovoltaic panels (BIPV).
BIPV panels constitute most of the building external envelope, as seen in Figure 1. The roof, the South façade and the pergola are entirely covered, the East, West and North façade are partially covered. This choice is not only due to the orientation of the building, but rather to the characteristics of the surroundings and their capacity to cast shadow.
The interest towards the use of vertically mounted PV has increased in the last years. They seem to be particularly promising for Northern climates. At these latitudes, in fact, vertical panels can gather solar radiation when the sun is low on the horizon while gravity helps to keep surfaces free from ice and snow. In addition, vertical panels can better capture scattered or reflected radiation that in some condition during the year can be preeminent.
Table 1. Overview of the installed PV panels.
Surface | Panels [pcs.] | Area [m²] | Installed Power [kWp] | Type |
Roof | 280 | 456 | 98 | Sunpower 350 |
North | 30 | 53 | 11 | Sunpower 375 |
South | 132 | 144 | 22 | Solarlab |
West | 73 | 80 | 12 | Solarlab |
East | 144 | 156 | 25 | Solarlab |
Pergola (mono) | 21 | 37 | 8 | Sunpower 375 |
Pergola (bi) | 21 | 37 | 5 | Solitek |
Total | 701 | 963 | 184 |
|
Table 1 gives an overview of the whole installed solar power system in the ZEB Laboratory. A total of 701 monocrystalline panels of different type and shape are installed for a total power of 184 kWp. All the panels are connected in strings and to three inverter units. According to calculations performed in the design phase, the expected yearly PV production is estimated to be 156 MWh.
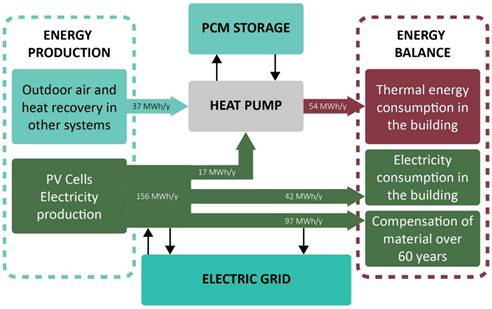
Figure 2. The overall energy balance of the ZEB Laboratory. [5]
The graph in Figure 2 illustrates the yearly power balance as predicted by simulations during the design phase. As written above, the renewable energy production relies entirely on the PV. The production by the PV covers the heating demand by sustaining a twin heat pump system, and the electricity consumption in the building. The remaining energy is transferred to the local electricity grid, and it should compensate, in terms of equivalent tons of CO₂, the CO₂ emission related to the construction process and the CO₂ embodied in the materials.
The ZEB Laboratory was finished in 2020 and delivered at the beginning of 2021. After that, it went through a commissioning phase. The building is used as office space by NTNU and SINTEF and it has started to gather solar power and to acquire data. The data infrastructure was tested in the autumn, and in the winter started logging the first results.
Winter results are particularly interesting since they constitute the “worst case scenario” and this is especially true for the Nordic climates. The winter season at Trondheim´s latitude offers few hours of daylight, and during these few hours the sun is low on the horizon.
The chosen period of investigation is one month from December 15th to January 14th.
In Trondheim (63°26′N 10°24′E) the day length during the chosen period varies from 4h20 around the solstice to 5h30 (Jan 14th). The sun elevation above the horizon is low, it spans from 3.3° to circa 5.5°. On January 14th the Sun rises at 141° South-East and sets at 219° South-West. To the low elevation and the short azimuth angle are to be added cloud coverage and snow coverage. The panels installed with an inclination can be covered by snow for a certain time. In the considered period, thanks to daily photographic observation (Figure 3), we could determine that snow covered totally or mostly the PV surface on the roof from Dec 23rd to Jan 11th. On the other hand, the presence of snow increases the albedo of the surroundings thus increasing the production of vertically mounted BIPV.
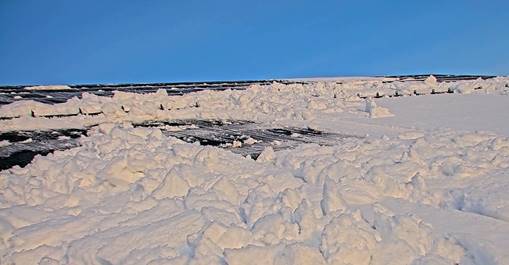
Figure 3. Example of daily photographic inspection to evaluate snow coverage on the roof (December 15th to January 14th).
Although the worst-case scenario, data reported in Figure 4 shows how the system can still produce a certain amount of renewable energy, for a total 232 kWh in one month.
The contribution of each surface is reported in Table 2. The table presents the percentage of installed power on each surface, the production, and the percentage of production during the investigated period.
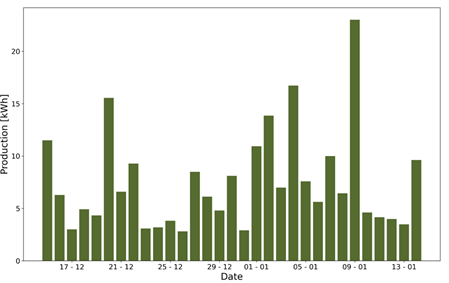
Figure 4. Daily PV production of the whole PV system during the investigated period.
Table 2. Absolute and relative production of the PV surfaces in the ZEB Laboratory during the investigated period.
Surface | Percentage of installed power [%] | Production [kWh] | Percentage of the production [%] |
Roof | 53.5% | 95.8 | 41.3% |
North | 6% | 2.6 | 1.1% |
South | 12% | 47.1 | 20.3% |
West | 7% | 20.6 | 8.9% |
East | 14% | 52.3 | 22.5% |
Pergola (mono) | 4.5% | 2.6 | 1% |
Pergola (bi) | 3% | 0.9 | 0.39% |
Total | − | 231.8 | − |
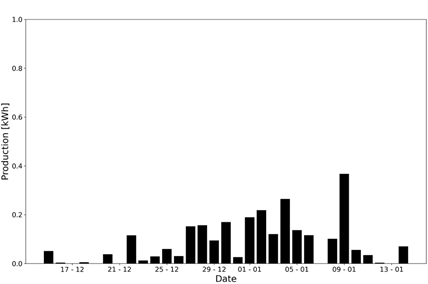
Figure 5. Daily PV production of the North facade during the investigated period.
It is interesting to look at the production of the North façade, here reported in Figure 5.
Although the available solar radiation is very low, and the PV panels of the North façade are those which are in the worst position, still they managed to produce circa 2.6 kWh during the whole period, a value comparable with the production of the monocrystalline elements of the pergola which have a slightly inferior installed power but are oriented towards South.
The first thing that can be observed is that the roof produced 41.3% of the energy despite constituting more than a half of the installed power. On the contrary the South and East façade produced in proportion more than expected from the share of installed power. This is due to the low elevation of the sun. By comparing the daily production data, it is also possible to relate this difference to the period of snow coverage.
This paper presented some preliminary results of the PV production on the ZEB Laboratory. The data acquisition will continue, and a larger amount of data will allow for a validation of the simulations performed in the design phase. During the winter an additional set of sensors was added to the ZEB Laboratory. This mainly consists of a pyranometer per façade and two weather stations: one on the roof and one at ground level. They allow for a better analysis of the solar resources, which in this paper was only based on the energy produced without comparing it to the actual solar energy available.
The BIPV installations are part of a ventilated wooden façade structure. The correct ventilation of the structure is needed to keep the correct hygrothermal conditions. These conditions influence the temperature of the panels and consequently, since the efficiency of the solar panels depends on the temperature, on the power production and the reach of the ZEB-COM [2] ambition. On the other hand, PV panels with open joints introduce a challenge with regards to the rain tightness for Norwegian climate. These topics are under study both experimentally and by means of numerical models.
This paper was written within the Research Centre on Zero Emission Neighbourhoods in Smart Cities (FME ZEN). The authors gratefully acknowledge the support from the ZEN partners and the Research Council of Norway. The authors wish to thank Odne Oksavik and Thomas Elvrum Lassen for their work within the data infrastructure.
[1] NTNU-Sintef ZEB Laboratory https://zeblab.no/.
[2] Hestnes A G, Lien A G, Gustavsen A, Matusiak B S, Risholt B D, Jelle B P and Tolstad O 2017 Zero Emission Buildings, ed NTNU SINTEF.
[3] Recast E 2010 Directive 2010/31/EU of the European Parliament and of the Council of 19 May 2010 on the energy performance of buildings (recast) Off. J. Eur. Union 18 2010.
[4] Time, B, Engebø, A, Christiensen, M, Dalby, O & Kvande, T: The design process for achievement of an office living laboratory with a ZEB standard. https://doi.org/10.1088/1755-1315/352/1/012053. IOP Conference Series: Earth and Environmental Science Volume 352.
[5] Nocente, A., Time, B., Mathisen, H. M., Kvande, T., & Gustavsen, A. (2021, November). The ZEB Laboratory: the development of a research tool for future climate adapted zero emission buildings. In Journal of Physics: Conference Series (Vol. 2069, No. 1, p. 012109). IOP Publishing.
Follow us on social media accounts to stay up to date with REHVA actualities
0