


Stay Informed
Follow us on social media accounts to stay up to date with REHVA actualities
|
|
|
|
Ralf GritzkiInstitute of Power Engineering, TU Dresden, 01062 Dresden, Germany | Jens NaumannRettig ICC Crimmitschau, Germany | Claudia KandziaInstitute of Power Engineering, TU Dresden, 01062 Dresden, Germany | Clemens FelsmannInstitute of Power Engineering, TU Dresden, 01062 Dresden, Germany |
This
article deals with the comparison of the heating-up times of four different
floor heating systems: a standard wet system and three renovation systems with
lower installation height. The renovation systems are the wet system K and two
dry systems C and T. The dry-system T is characterized by a special heat
conduction plate and the system C by the absence of an insulation layer. By
using a transient coupled CFD simulation, the processes of heat conduction,
heat radiation as well as the convective heat transport due to the air- and
water flows are calculated.
The four
systems show a different dynamic of the heating-up times. Table 1
gives an overview about the layers of the four systems.
Table 1. Layer of the floor heating systems
from top down.
Wet system | Wet system | Dry system | Dry system |
Tiles, 10 mm | Tiles, 10 mm | Tiles, 10 mm | Tiles, 10 mm |
Heating screed, 65 mm Heating pipe, 17x2 mm | Heating screed, 21 mm Heating pipe, 16x2 mm | Load distribution, 5 mm, λ = 0.2 W/(mK) Heat conduction plate, aluminium, 0.25 mm heating pipe, 14x2 mm | Heating screed, 21 mm Heating pipe, 10x1 mm |
Insulation material, 30 mm, λ = 0.04 W/(mK) | Insulation material, 6 mm, λ = 0.04 W/(mK) | Insulation material, 17 mm, λ = 0.04 W/(mK) | No insolation material |
Screed 45 mm | Screed 45 mm | Screed 45 mm | Screed 45 mm |
|
|
|
|
Figure 1 shows the layer of the floor
heating system by the example of the T dry system. One can see very well, how
the heating pipes are surrounded by the heat conduction plates. This heat
conduction plates with a thickness of 0.25 mm are modelled fully three dimensional
in the simulation model.
The four
different systems are simulated in a test cabin made of 200 mm thick
aerated concrete walls with a base area of 3 m x 3 m and an
interior height of 2.75 m without openings, see Figure 2. Related to the floor area of 9 m2 a laying distance
between the pipes of 150 mm leads to a pipe length of about 57.7 m
and a laying distance of 125 mm results in a pipe length of 69.2 m.
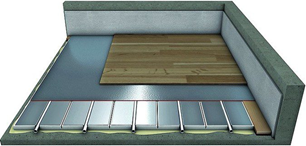
Figure 1. floor heating system T with heat conduction plates; reference: www.bba-online.de.
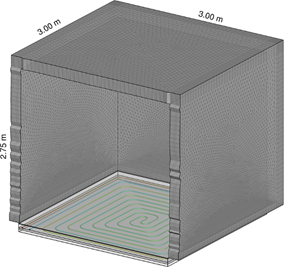
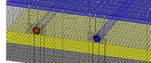
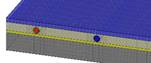
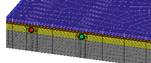
Figure 2. Geometry of the test cabin and
meshing of the wall layers and laying patterns of the floor heating.
Transient,
coupled simulations of the test cabin, underfloor heating system, water flow
and room air flow are done for all four systems. For the evaluation, the
surface temperatures and their local distribution as well as the water
temperatures are evaluated in detail as a step response when switching on the
underfloor heating system. Furthermore, the enthalpy flows between the water
inlet and outlet and the (convective and radiative) heat flows from the floor
are evaluated.
The
numerical model considers the following aspects:
·
three-dimensional
non-isothermal water flow inside the pipes
·
three-dimensional
thermal conduction within the inner walls of the pipes as well as within all
other layers in the respective floor structure
·
three-dimensional
heat conduction within the side walls of aerated concrete
·
non-isothermal
turbulent simulation of the air flow in the test cabin taking
into account the radiation heat exchange within the test cabin
The initial
condition is a uniform temperature of all zones of 15 °C at the start time
and a constant fluid in the test cabin as well as in the floor heating tube.
For the
water inlet the mass flow rate into the heating pipes is set to 0.025 kg/s
with a supply temperature of 35 °C. There is no heat loss assumed below
the lower screed layer and on all sides of the floor structure. The
calculations are done over a period of six hours of simulated real time. This
period is chosen to ensure that in each of the four systems the desired mean
surface temperature of the floor area of 24 °C is reached. The calculated
flow velocities are less than 0.1 m/s in the tubes.
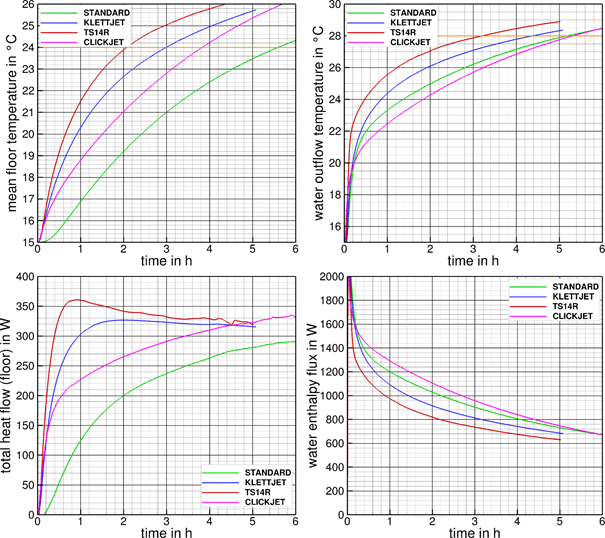
Figure 3. Step responses; from top left to bottom right: time profile of medium surface temperatures of the floor, time profile
of mean return temperatures of the water, time profile of total heat flows of
the floor, time profile of resulting enthalpy fluxes of the water; in each case
for all four systems.
Figure 3, on the left in the upper part,
shows the mean surface temperature profiles of the four different systems. The
right side represents the corresponding profiles of the water return
temperatures. In addition, the total thermal heat flows (convection and
radiation) emitted by the respective floor as well as the resulting enthalpy
fluxes transferred from the water to the respective floor structure are shown
in the diagrams in the lower part of Figure 3.
The
different dynamics of all four investigated systems can be clearly seen from
the diagrams. Due to the much larger thermal mass of the heating screed, the STANDARD
system has the biggest inertia, which results in a slower heating of the tiles
and thus also a slower increase in the heat dissipation of the floor heating as
a whole. The K system is more dynamic than C due to its insulating layer
preventing heat to be transferred into the building structure rather than to
the room. Due to the insulating layer, the heat flow into the screed below it
is significantly lower than in the C-system. This is also shown by the overall
higher enthalpy flux which C-system’s water gives to the surrounding floor
layers (see Figure 3, bottom right). In this case,
however, a higher heat flow through the tube walls occurs due to the smaller
internal diameter of the tube and the associated higher velocity of the water.
The good thermal insulation downwards as well as the very good heat distribution
upwards over the heat conducting plates lead to a very high dynamic in the
system T. The required average floor temperature is reached three times faster
than with the system STANDARD. The T-system has been identified as a fast
reacting underfloor heating system where the highest overall heat output of the
floor is observed with the lowest enthalpy flux of the water during the heating
phase. The energy transfer from the water to the chamber is therefore the
fastest in this system.
The
described facts can also be found in the representation of the temperature
distributions of the different configurations, see Figure 4. If more energy has to be distributed in the floor, the system becomes
slower.
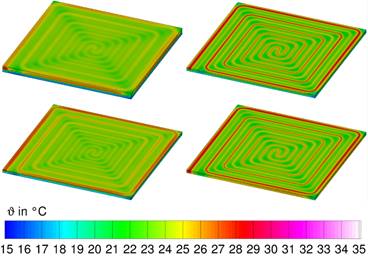
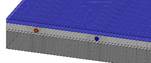
Figure 4. Surface temperatures of the whole
underfloor heating system, after reaching a mean surface temperature of
24 °C, view from above; from top left to bottom
right: the STANDARD-system and the systems K, T, C.
If a
parquet floor is modelled instead of the floor tiles, all systems react much
slower due to the lower heat conduction of the wood layer. The differences
between the floor heating systems analysed are smaller. However, this wooden
surface layer leads to an equalization of the surface temperatures. The ripple
of the temperature profiles is significantly lower in all four systems than in
the case of the floor construction with tiles.
Follow us on social media accounts to stay up to date with REHVA actualities
0