


Stay Informed
Follow us on social media accounts to stay up to date with REHVA actualities
|
|
|
Azin Velashjerdi Farahani | Juha Jokisalo | Sami Lestinen |
|
|
|
|
|
|
Natalia Korhonen | Kirsti Jylhä | Risto Kosonen |
|
|
|
1 Department of Mechanical Engineering, Aalto University, Espoo, Finland2 Weather and Climate Change Impact Research, Finnish Meteorological Institute, Helsinki, Finland3 Smart City Center of Excellence, TalTech, Tallinn, Estonia4 College of Urban Construction, Nanjing Tech University, Nanjing, Chinaristo.kosonen@aalto.fi | ||
Climate change is mostly about the gradual increase in ambient temperature which is more serious in the northern areas [1]. Increasing temperature has an adverse impact on health [2]. Additionally, since the selection of outdoor design conditions is an important factor in determining the building cooling loads, changes in HVAC design should be considered due to climate change [3, 4]. In this paper, we investigate the dimensioning cooling power demand of office buildings in the current and future climate using the new cooling design days for Finland.
The example building considered in this study is a six-story office building located in Helsinki. The geometry of the building is shown in Figure 1. The heated net floor area of the building is 5 744 m². It is assumed that the example building is located in a neighborhood, where it is surrounded by similar buildings.Figure 2 shows the neighborhood.
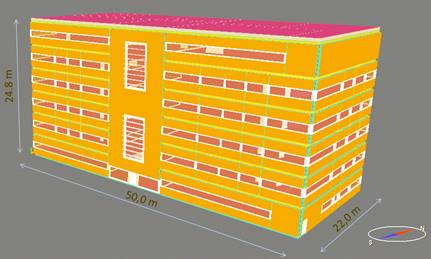
Figure 1. The geometry of the example building.
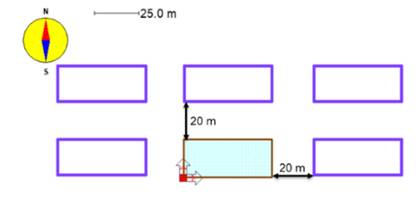
Figure 2. The surroundings of the example building.
The U-value of the external walls is 0.17 W/m²K. The window U-value is 1 W/m²K, g-value is 0.3 and direct solar transmittance (ST) is 0.35. The window to wall ratio is 50%. It is assumed that the building is occupied 7–18 weekdays. The occupancy density is 1 person per 20 m². Manually controlled blinds between the outer panes are used when solar radiation exceeds 100 W/m² on the window. The presence of the occupants corresponds with the activity in office rooms and meeting rooms.
The total annual electricity consumption of office appliances and indoor lighting are 22.4 kWh/m² and 18.6 kWh/m² per floor area. The space cooling setpoint is 24°C in all the spaces. The supply air temperature is 14°C in the rooms. Ventilation is controlled by CO₂ concentration and temperature in the all-air system and by just the CO₂ concentration of the room in the air-water system (Table 1).
The space cooling in the air-water system is provided by radiant cooling panels on the ceiling. The difference between the average room air temperature and average water temperature difference at design condition is 8°C.
Table 1. Ventilation and cooling systems input data.
System | Ventilation | Space cooling | |
Main AHU | Basic AHU | ||
All-air | VAV: CO₂ and temperature control | CAV, 0.15 ℓ/s,m² | _ |
Air-water | VAV: CO₂ control · Office rooms: min 1 ℓ/s,m² (if CO₂ < 600 ppm) max 2 ℓ/s,m²(if CO₂ > 900 ppm) · Meeting rooms: min 1 ℓ/s,m² (if CO₂ < 600 ppm) max 4 ℓ/s,m²(if CO₂ > 900 ppm) | Radiant cooling panels | |
The new cooling design day for Finland has been chosen using SFS-EN ISO 15927-2 standard [5]. The design climate imposing a cooling load likely to be exceeded on 1% of the days (1% risk level) was determined for the current climate and for three future scenarios; 2030 under Representative Concentration Pathway RCP 4.5, 2050 RCP 4.5, and 2050 RCP 8.5. Figure 3 and Figure 4 show the outdoor temperature and enthalpy in the current and future design days. The maximum outdoor temperature varies from 30°C to 33°C. The maximum enthalpy is 65 kJ/kg on the current design day, and it increases up to 72 kJ/kg on the design day of 2050 under the RCP 8.5 scenario.
The all-air system (VAV) and the air-water system (ventilation and radiant panels) are simulated using the current and future climate design days and with the test reference year of TRY2012 (June-August) Vantaa. TRY2012 describes the current 30-year average climatic conditions of Southern Finland [6]. The simulation is done using the validated dynamic building simulation tool IDA ICE 4.8.
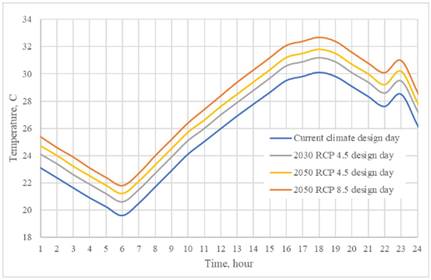
Figure 3. Outdoor temperature on the design days of Vantaa with 1% risk level.
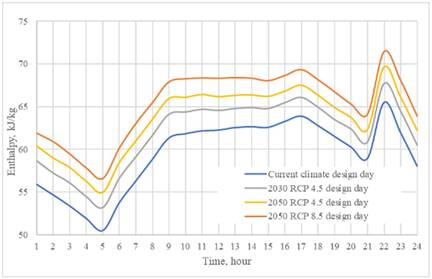
Figure 4. Enthalpy on the design days of Vantaa with 1% risk level.
The required radiant cooling panel power for each room with the air-water system and the required airflow rates with the all-air system simulated using the current climate design day are shown in Table 2.
Table 2. The system sizing for air-water and all-air system with the current design day.
Rooms | Air-water system | All-air system | |
Power/room area (W/m²) | Airflow rates | ||
Meeting rooms | Min. power | 10.5 | VAV (CO₂, Temperature control) |
Max. power | 34.3 | ||
Office room | Min. power | 12.3 | VAV (CO₂, Temperature control) |
Max. power | 31.2 | ||
The peak cooling power demand for the all-air system is higher than the air-water system by 18% with the current design day (Table 3). Additionally, the peak total cooling power demand of the air-water system increases by 5%, 8.6%, and 13% for 2030 RCP4.5, 2050 RCP 4.5, and 2050 RCP 8.5 (Table 3). For the all-air systems, these rises are 6.7%, 11.5%, and 17.2%, respectively.
The peak cooling power happens in August 2012 in both systems. In the first week of August, the enthalpy of outdoor air reaches about 70 kJ/kg. This explains the rise in cooling power demand in comparison to the current climate design day.
Table 3. Peak cooling power demand (kW).
System | Current climate | 2030 RCP 4.5 | 2050 RCP 4.5 | 2050 RCP 8.5 | Summer (Jun-Aug) TRY 2012 | |
Air-water system | Radiant panel | 51.1 | 51.5 | 51.7 | 52.0 | 47.2 |
AHU cooling | 253.9 | 269.7 | 281.0 | 294.8 | 306.1 | |
Total cooling power | 294.1 | 308.7 | 319.4 | 332.3 | 311.4 | |
Difference compared to the current climate design day (%) | − | 5.0 | 8.6 | 13.0 | 5.9 | |
all-air system | Total cooling power | 348.1 | 371.5 | 388.2 | 408.0 | 329.7 |
Difference compared to the current climate design day (%) | − | 6.7 | 11.5 | 17.2 | −5.3 | |
Figure 5 and Figure 6 show the duration curves of indoor air temperature for both systems on the current and future design days in the warmest office and the warmest meeting room. The office is warmer with the all-air system than the air-water system. While in the meeting room, the indoor air temperature is lower with the all-air system. However, the temperature is always below 25°C which was the target temperature of indoor temperature conditions [7], for all the weather conditions and the rise in the peak cooling power demand of the chiller can compensate for the rise of outdoor temperature in the future scenarios and the indoor temperature will be below the target value for future climate scenarios.
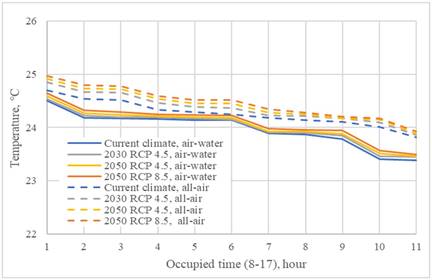
Figure 5. Indoor air temperature in the warmest single office.
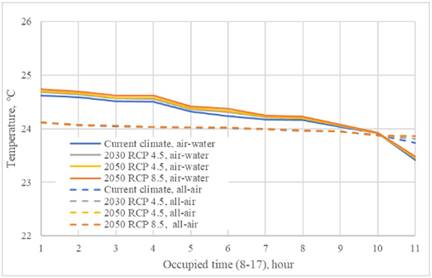
Figure 6. Indoor air temperature in the warmest meeting room.
The simulated all-air system has higher airflow rates in some rooms compared to the air-water system with radiant cooling panels on the ceiling. This leads to higher peak cooling power in the chiller (18% in the current climate design day) than in the air-water system. The peak cooling power demand increases in the future design days and this increased level is higher for the all-air system. However, the indoor temperature conditions results showed that with the rise in future dimensioning power due to the outdoor temperature increase in future scenarios, the indoor temperature will be below the target value for future climate scenarios.
This study is part of the following projects: HEATCLIM (Heat and health in the changing climate, Grant Numbers. 329306, 329307) funded by the Academy of Finland within the CLIHE (Climate change and health) programme, FINEST Twins funded by European Union (Horizon 2020 programme, Grant No. 856602) and the Estonian government, SUREFIT (Sustainable solutions for affordable retrofit of domestic buildings) funded by European Union (Horizon 2020 programme, Grant No. 894511).
[1] S. Russo, J. Sillmann, and E. M. Fischer, “Top ten European heatwaves since 1950 and their occurrence in the coming decades,” Environmental Research Letters, vol. 10, no. 12, 2015, https://doi.org/10.1088/1748-9326/10/12/124003.
[2] D. Meierrieks, “Weather shocks, climate change and human health,” World Development, vol. 138, p. 105228, 2021, https://doi.org/10.1016/j.worlddev.2020.105228.
[3] T. de Rubeis, S. Falasca, G. Curci, D. Paoletti, and D. Ambrosini, “Sensitivity of heating performance of an energy self-sufficient building to climate zone, climate change and HVAC system solutions,” Sustainable Cities and Society, vol. 61, no. May, p. 102300, 2020, https://doi.org/10.1016/j.scs.2020.102300.
[4] A. T. Nguyen, D. Rockwood, M. K. Doan, and T. K. Dung Le, “Performance assessment of contemporary energy-optimized office buildings under the impact of climate change,” Journal of Building Engineering, vol. 35, p. 102089, Mar. 2021, https://doi.org/10.1016/j.jobe.2020.102089.
[5] “Hygrothermal performance of buildings. Calculation and presentation of climatic data. Part 2: Hourly data for design cooling load (ISO 15927-2:2009),” 2009.
[6] T. Kalamees et al., “Development of weighting factors for climate variables for selecting the energy reference year according to the en ISO 15927-4 standard,” Energy and Buildings, vol. 47, pp. 53–60, 2012, https://doi.org/10.1016/j.enbuild.2011.11.031.
[7] M. Ahola, J. Säteri, and L. Sariola, “Revised Finnish classification of indoor climate 2018,” 2019. doi: https://doi.org/10.1051/e3sconf/201911102017.
Follow us on social media accounts to stay up to date with REHVA actualities
0