
Stay Informed
Follow us on social media accounts to stay up to date with REHVA actualities
| Christoph KaupProf.
Dr.-Ing.Honorary professor at the
Environmental Campus Birkenfeld, Trier University of Applied Sciences, for
energy efficiency and heat recovery. Managing Partner of HOWATHERM
Klimatechnik GmbH.Email:
c.kaup@umwelt-campus.de |
AHU | Air handling unit |
ΔP | Differential pressure loss [Pa] |
I | Investments [€] |
K | annual differential costs [€/a] |
L | Runtime [h/a] |
NTU | Number of Transfer units [./.] |
Φ | Temperature transfer coefficient or heat recovery efficiency [%] |
HR | Heat recovery |
s | Standard deviation |
w | Flow velocity at the narrowest cross section in [m/s] |
W | Thermal energy [kWh/a] |
Heat recovery systems have been used for years to reduce the required primary thermal energy demand in HVAC units and systems non-residential buildings.
Despite this positive development, the question arises more and more frequently as to whether these provisions of the Eco-design regulation EU 1253/2014[1]actually represent an optimum of the HR system in the microeconomic or national macroeconomic sense.
In order to answer this question, a total of approx. 4,800 air handling unit (AHU) designs from 2014 up to and including the first half of 2018 were evaluated according to economic aspects. These are actual designs that were carried out with TÜV-certified design software on the basis of specific tenders in a broad range of projects. Each device is therefore based on a real project with actual performance requirements that are in line with the market and therefore representative for the market of AHU´s used in non-residential buildings.
Each HVAC unit with HR was subjected to a quasi-dynamic economic efficiency calculation using a batch generator (software bot). Two usage cases were thereby investigated. On the one hand, a design with initial values, i.e. predefined basic conditions that are to apply equally to all designs, and on the other hand, a design with file values, i. e. the data that was already selected in the concrete design for the respective project during the original design.
When performing a consideration with initial values, the designs were also only evaluated for an identical location, while file values took into account the actual location that was already selected at that stage of the project.
Three locations were selected to take into account the general conditions (starting values) in Europe. In addition to Mannheim as a central European location, Lisbon was selected as the southern location and Helsinki as the northern location.
The annual differential costs were determined as the basis for the economic valuation. These result from the monetary recovery of heat in the winter, and the recovery of cold in summer. The expenses resulting from the electrical energy requirement, maintenance costs, debt service, etc. were deducted from this amount. The results for the recovered heat are shown in Table 1.
While in Lisbon heat is recovered on average W = 28,665 kWh/a for a run time of around L = 2,350 h/a, in Helsinki this is W = 117,478 kWh/a for the same run time (see Figure 1).
Table 1 Average thermal work of the examined designs.
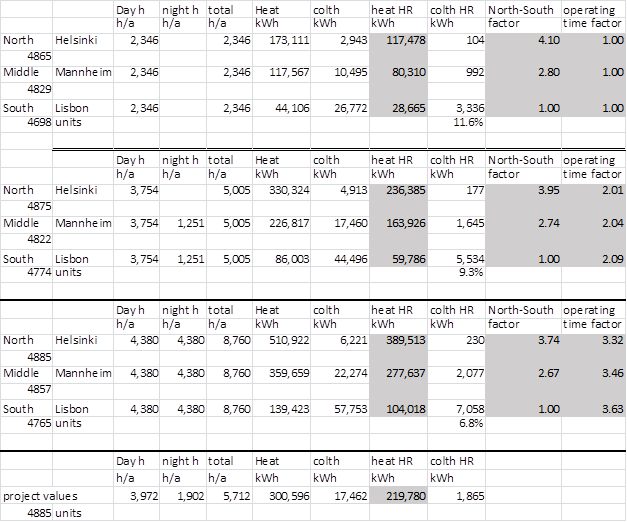
If the plants examined are operated around the clock, the HR in Lisbon W = 104,018 kWh/a and in Helsinki W = 389,513 kWh/a. This corresponds to about a factor of four between northern and southern Europe. In Mannheim, around 2.7 times the heat could be recovered compared to the south. It also becomes apparent that approximately 3.5 times as much energy can be recovered in a 24-hour operation as in the 9-hour operation (L = 2,350 h/a).
The average temperature transfer rate of all designs was Φ = 71.9% with a standard deviation of s = 5.8 percentage points during the period under study.
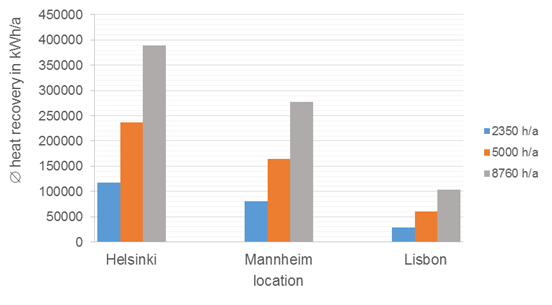
Figure 1.Average heat recovery of the plants in kWh/a
By contrast, the recovery of sensitive cold is very low (see Figure 2) and even in Lisbon there is a maximum of 11.6% heat energy (see Figure 1). In Helsinki, the share of cold recovery is irrelevant, as it only accounts for 0.1% of the heat energy.
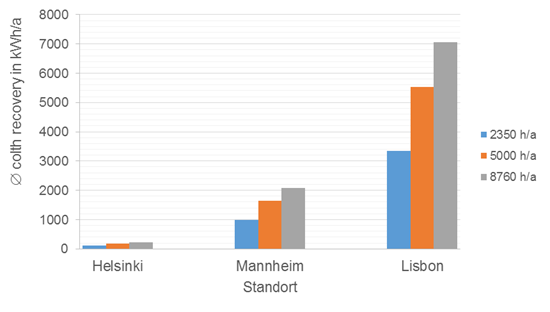
Figure 2. Average cold recovery of the plants in kWh/a.
Based on the actual project data (mostly in Germany), the average run time of the plants was L = 5,712 h/a with an average recovery of W = 219,780 kWh/a.
If the monetary effect of the HR is calculated, the results are shown in Table 2. This was calculated with a price of 0.08 €/kWh for heat, an electricity price of 0.17 €/kWh, and a price of 0.05 €/kWh for cooling energy. An imputed interest rate of 3%/a was applied. The rate of price increase was 2%/a. The useful life of the HR was selected with 15 years. The utilisation of the HR unit during daytime hours is assumed to be 100% of the target air volume, and at night hours 50%. The investment costs of the HR systems in the study are averaged at I = €25,100.
Table 2. Monetary results (differential costs average values) of the economic efficiency calculation.
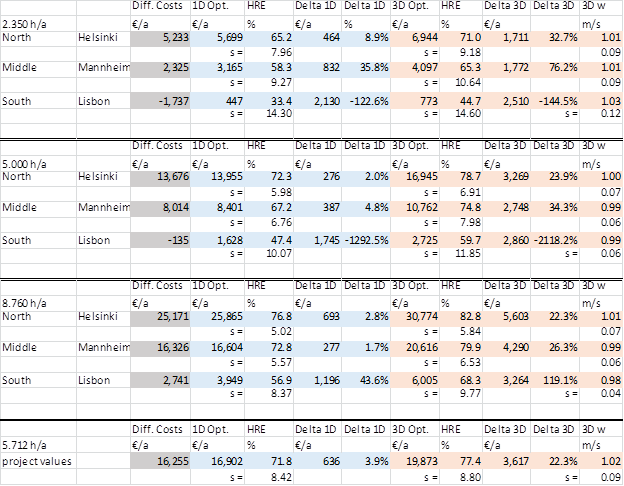
In a 9-hour operation (around L = 2,350 h/a), the plants examined in Lisbon would generate an average loss of K = −1,737 €/a at an efficiency of 71.9%. Overall, 93.7% of all investments in Southern Europe would be uneconomical (negative differential costs per year), while a profit of K = 5,233 €/a would be generated in Northern Europe for the same term. In Helsinki, therefore, only 2.1% of specific installations would generate project-specific losses.
In the 24-hour operation, an average profit of K = 2,741 €/a would even be generated in Lisbon. However, even with this run time, 7.4% of the examined plants would still generate a loss. In Helsinki, however, it would be possible to generate a profit of K = 25,171 €/a with the same investments (see also Figure 3). Under these conditions, none of the plants examined would be uneconomical at this location.
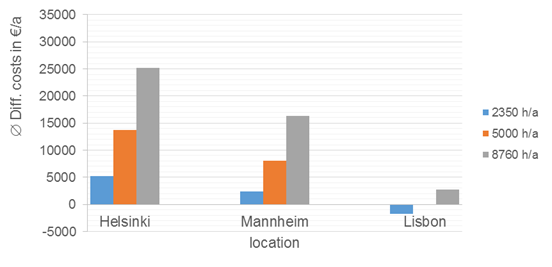
Figure 3. Annual differential costs under design conditions.
If all plants were economically optimized at a constant design speed, a higher profit would be generated, which could avoid a loss on average for all plants.
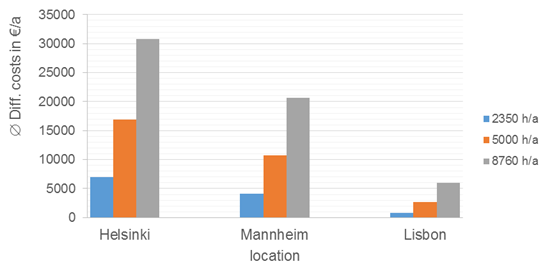
Figure 4. Annual differential costs after 3D optimization.
However, the systems with average transmission degrees from Φ = 33.4% in Lisbon to Φ = 65.2% in Helsinki would then have to be produced, i. e. with significantly lower transmission rates than the actual, resulting average and undifferentiated Φ = 71.9% of the systems investigated in this field study. In Mannheim, the optimum transmission degree under these conditions would be Φ = 58.3%.
With a run time of L = 5,000 h/a, transmission degrees of Φ = 47.4% in Lisbon and Φ = 72.3% in Helsinki would be required. Mannheim then requires a transmission degree of Φ = 67.2% at unchanged flow velocity.
Even during the 24-hour operation (L = 8,760 h/a), transmission degrees of Φ = 56.9% (Lisbon) and Φ = 76.8% (Helsinki), as well as Φ = 72.8% (Mannheim) would make sense. A 2.8% higher profit could be generated in Helsinki, while a 43.6% higher profit could be achieved in Lisbon.
If a multidimensional optimization is carried out at a flow velocity of about w = 1 m/s, significantly higher gains could be achieved (see Figure 4). For a 9-hour operation in Mannheim, for example, the annual differential costs could be increased to € 4,097/a (+ 76.2%) with an average of K = € 2,325/a.
A significant increase in yields would also be possible in 24-hour operation, which could be +22.3% in Helsinki (K = 25,171 €/a to K = 30,774 €/a) and +119.1% in Lisbon (K = 2,741 €/a to K = 6,005 €/a) (see Table 2).
However, even in this case, the optimal transmission degree is not identical in the different locations. While in Lisbon max. Φ = 68.3% makes sense, in Helsinki this is Φ = 82.8%. In Mannheim, the maximum transmission degree under these conditions is Φ = 79.9%. In the 9-hour operation, the maximum meaningful transmission degrees are reduced to a maximum of Φ = 71.0% in Helsinki, Φ = 65.3% in Mannheim and Φ = 44.7% in Lisbon. However, all transmission degrees can only be used sensibly if the flow velocity for design is around w = 1 m/s in order to minimize pressure losses.
In Germany, in contrast to the chosen framework conditions, +22.3% higher yield could be achieved in accordance with the project-specific, individual values (cf. Table 2 bottom line). The higher value is due to the fact that higher specific energy prices were expected in the specific projects.
If the EU1253/2014 reference values, which are to enter into force from 2020 as part of the revision of the Ecodesign regulation are applied today, the result will be as follows (see Table 3 and Table 4).
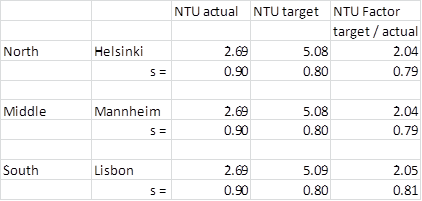
On average, the HR would have to be twice as large in its transmission units as it has been in recent years.
Table 3. Necessary change of the heat exchanger index Number of transfer units (NTU) under reference conditions.
In Helsinki, a 9-hour operation could no longer generate a profit of K = 5,233 €/a compared to the situation in recent years, with a yield of only of K = 2,609 €/a (see Table 4).
In Lisbon, instead of the loss of K = −1,797 €/a already incurred today, a significantly higher loss of K = −5,566 €/a would be the result. And in Mannheim a loss of K = −789 €/a would result instead of an average profit of K = 2,325 €/a. Even with a 24-hour operation (L = 8,760 h/a), the plants examined in Lisbon would cause an average loss of K = −1,905 €/a.
Table 4. Monetary results of the economic efficiency calculation under reference conditions.
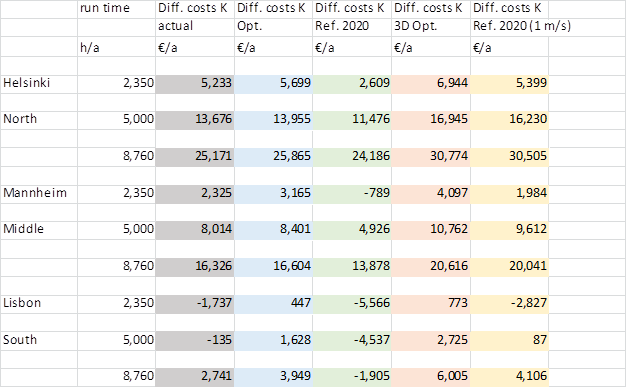
Even under the current conditions, an average profit of K = 2,741 €/a would still be possible in Lisbon. By comparison, the same investments in Helsinki would generate an average profit of K = 25,171 €/a (in Mannheim K = 16,326 €/a).
Figure 5 and Figure 6 also show the annual savings for the Helsinki and Lisbon locations with different run times. Even at an optimal flow velocity of about w = 1 m/s, the reference values of the EU1253/2014 would cause lower yields. Although the average transmission degrees would be between Φ = 83% and Φ = 84%, all yields would be lower than in the multi-dimensionally calculated optimum. Figure 7 shows the corresponding result for Mannheim.
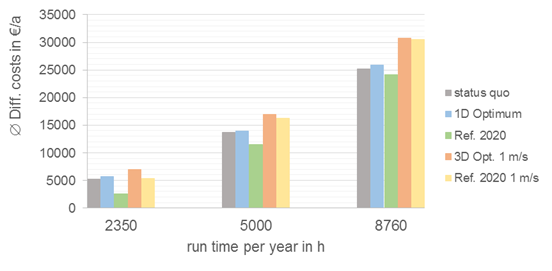
Figure 5. Annual differential costs under various conditions for Helsinki.
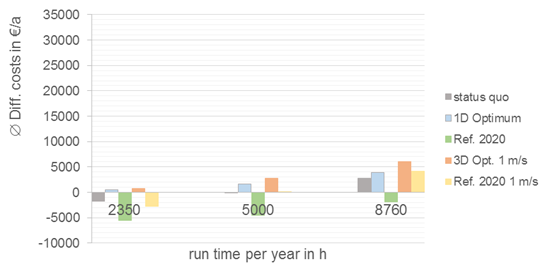
Figure 6. Annual differential costs for Lisbon under different conditions.
Even in Helsinki, 24-hour operation would reduce the yields from K = 30,744 €/a to K = 30,505 €/a, i. e. by −0.9%. In Lisbon, on the other hand, a 9-hour operation (L = 2,350 h/a) would turn the remaining small profit of K = 773 €/a into a significant loss of K = −2,877 €/a.
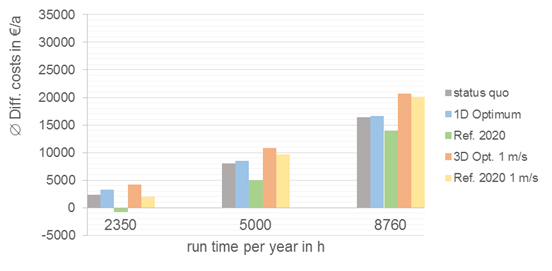
Figure 7. Annual differential costs for Mannheim under various conditions.
It should be noted that the HR has successfully established itself in Europe. However, if the EU 1253/2014 reference values are actually converted into applicable law as of 2020, the recovered heat output will increase by around 15%, but the amount of equipment required will increase by a factor of around 2.
This development is not economic, as the average yields of the HR will fall across Europe. This has been clearly demonstrated by the field study at the individual case level at around 4,800 plants examined.
Yields will fall significantly in all cases. In the quintessence of the findings, the application of the reference values in Europe from 2020 will not make any investment in Europe more economical than it is today.
It is to be hoped that the European Commission will also recognise and correct this design error in the regulation. It makes sense that the revision of the regulation must at least take into account both the location of installation of the HR and its run time.
If the results of the field study are reduced to the transmission degree, the following values could be useful for minimum transmission rates and maximum pressure losses at the HR (see Table 5).
Table 5. Possible transmission degrees of the HR and their average annual differential costs.
3D-Optimum | Ø Diff.- costs | ΔP average | ||
| % | €/a | Pa | |
Helsinki | 2,350 h/a | 71 | 6,944 | 61 |
North | 5,000 h/a | 79 | 16,945 | 91 |
| 8,760 h/a | 83 | 30,774 | 119 |
| % | €/a | Pa | |
Mannheim | 2,350 h/a | 65 | 4,097 | 47 |
Middle | 5,000 h/a | 75 | 10,762 | 71 |
| 8,760 h/a | 80 | 20,616 | 96 |
| % | €/a | Pa | |
Lisbon | 2,350 h/a | 45 | 773 | 21 |
South | 5,000 h/a | 60 | 2,725 | 35 |
| 8,760 h/a | 68 | 6,005 | 51 |
The air velocity in the device should then be about w = 1 m/s. Lower air speeds are hardly sensible any more, as the systems should also to operate at partial load. At an air velocity of w = 1 m/s a partial load operation up to about w = 0.4 m/s would be possible.
[1]Commission Regulation (EU) No 1253/2014 from
July 7, 2014 regarding the implementation of the Directive 2009/125/EC of the
European Parliament and the Council regarding the requirements for the
environmentally compatible design of ventilation systems. Published on
25.11.2014.
Follow us on social media accounts to stay up to date with REHVA actualities
0