


Stay Informed
Follow us on social media accounts to stay up to date with REHVA actualities
|
|
|
Dmytro Ivanko | Yiyu Ding | Natasa Nord |
Department of Energy and Process Technology, Norwegian University of Science and Technology, Norwaydmytro.ivanko@ntnu.no | Department of Energy and Process Technology, Norwegian University of Science and Technology, Norwayyiyu.ding@ntnu.no | Department of Energy and Process Technology, Norwegian University of Science and Technology, Norwaynatasa.nord@ntnu.no |
COVID-19 is a potentially fatal coronavirus disease that may cause severe problems with the human respiratory system [1]. Since the beginning of 2020, this disease has begun to spread rapidly around the world [2]. In March 2020, the World Health Organization (WHO) declared that COVID-19 outbreak is a global pandemic. Social distancing and personal hygiene are proved to be the primary measures that may help to prevent the spread of COVID-19 [3]. Therefore, to avoid people gatherings and crowds, most countries have imposed a partial or full lockdown of educational institutions and commercial and industrial companies. Such drastic changes in the behavior of energy users have a significant impact on energy demand and lead to substantial problems in the energy sector.
The effect of restrictions on energy demand in the EU countries is investigated in [4]. The EU countries have individually approached the restrictions associated with the COVID pandemic. The analysis of energy use showed that countries that imposed stricter restrictions experienced a higher reduction in energy demand. Currently the existing research and analysis have been focusing on the residential buildings, while research on non-residential buildings is lacking. For the educational institutions, office buildings, and other commercial buildings that experienced the lockdown, it is usually assumed that the demand profiles for weekdays during the pandemic are similar to weekends of the reference week in 2019 [4]. However, the data-based evidence for energy use profiles in these types of buildings is missing.
This paper presents heat use in buildings in Norway during the period of the COVID-19 pandemic. The study focused on the analysis of heat use in schools and kindergartens. Firstly, the study compared profiles in buildings during the COVID-lockdown and the post-lockdown period with the profiles obtained before the pandemic. Secondly, the study developed the three scenarios for heat use in buildings in conditions of the pandemic lockdown. The following scenarios were considered: 1) Scenario 1 − Modelling based on behavior in a normal year (i.e. the previous year), 2) Scenario 2 − Modelling based on heat use in night hours, 3) Scenario 3 − Modelling based on the current settings that were used in the buildings during COVID-lockdown. The proposed scenarios represented the different settings for the heating systems and might give important information for further efficient utilization of heating systems in buildings.
Three different scenarios of heat use in buildings during the lockdown were developed. A brief description for each scenario is given below.
When a building is operating in a regular regime, not affected by unexpected changes in occupancy, the outdoor temperature may be treated as the main factor that explains the variation of heat use in buildings [5]. The model that expresses the relationship between the heat use in an observed building and the outdoor temperature is called the Energy Signature Curve (ESC) [6]. Usually, the ESC contains two sub-models divided by the change point temperature (CPT). Piecewise regression is a method that can be used to build the ESC model. Due to the diverse schedules of work, in working days at hours when the main activities are held, the heat use in educational buildings is much higher comparing to the rest of the time. For this reason, to plan the heat use in a regular regime, we developed the separate ESC models for each hour of the weekdays and weekends. To formulate heat use in Scenario 1, the outdoor temperature data for the typical cold and warm meteorological years (TMY) were applied as an input to the ESC models.
Scenario 2 considered better operation settings for the heating system during the lockdown. In this scenario, it is assumed that during the lockdown, the buildings’ heat use should be kept at the level of night heat use under the normal pre-pandemic conditions. In the educational institutions, the lowest heat use can be usually observed at the night time from 1:00 o’clock to 5:00 o’clock in working days, when there are no people in buildings and the heating system is working with the minimum energy load required to maintain the lowest acceptable temperatures. To express the possible reduction of heat use in the buildings, the ESC model based only on nighttime heat use was developed.
Scenario 3 explained the building heat use if the actual setting for the heating system during the COVID-lockdown in Norway would be continuously used to the typical year. Scenario 3 was developed based on the average monthly heat use that was observed before and during the COVID-19 pandemic.
Educational institutions located in Trondheim, Norway, were analyzed in this study.
The information of the heat use in eight kindergartens and 12 schools were obtained from the energy monitoring platform of the Trondheim municipality. Among these schools, nine schools are for junior pupils, two schools are secondary schools, and one is the mixed school. The areas of kindergartens are within 779–2 086 m², and the area of the schools are within 3 206–8 449 m². All the buildings in the analysis are using district heating system (DH) as the main heating supply carrier.
To compare buildings of different characteristics, the average heat use per heating area (per m²) was used as a physical indicator. Data obtained from the nearest meteorological station located in Trondheim were used [7].
This section is divided into two subsections. The analyses of heat use profiles before and during the COVID-19 restrictions is given first. The three scenarios for heat use in the educational institutions are given afterwards.
Norway is among the countries that had imposed strict restrictions when the COVID-19 pandemic began to spread in early 2020. One of these restrictions was the temporary lockdown of educational institutions. Following the recommendations of the government, schools and kindergartens were closed from March 13th to April 23rd, 2020.
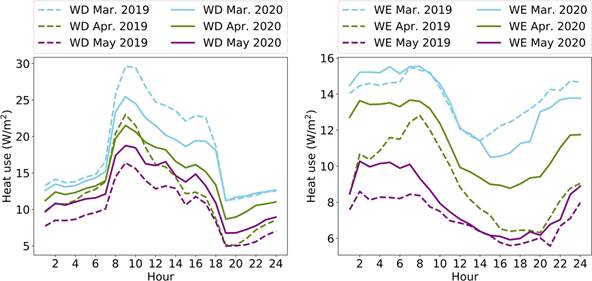
The average outdoor temperature in March 2019 was 0°C, and in March 2020 it was 1.7°C. In April 2019, the average outdoor temperature was 7.2°C, and in April 2020 it was 3.9°C. Whereas in May 2019 it was 7.9°C, and in May 2020 it was 6.4°C. Although the outdoor temperature influence heat use [8], it was decided to compare the real profiles rather than the temperature adjusted values in this work. This enables us to focus on real data without making any biased suggestions.
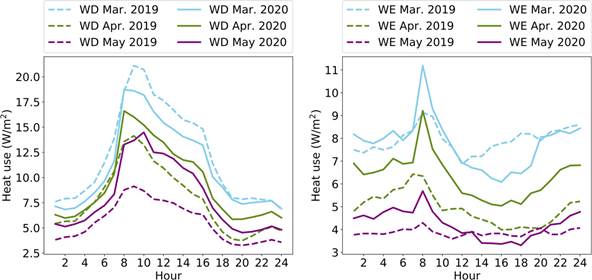
Since weekdays and weekends have different patterns of heat use, their profiles were considered separately. The average daily heat use profiles for kindergartens and schools of 2019 and 2020 are shown in Figure 1 and Figure 2, respectively. In Figure 1 and Figure 2, WD denotes working day and WE denotes weekend, and the dashed lines stand for 2019 and the solid lines for 2020. Please note that in our investigation, March and April included only days when the lockdown was imposed. From Figure 1 and Figure 2, it may be observed that the shape of the heat use profiles before and during the pandemic in educational institutions remained almost the same. The profiles show that for kindergartens, this working schedule did not change during the COVID-lockdown in 2020. For schools, there was a slight change of the peak load that was shifted backwards by an hour in March and April 2020 and forward by an hour in May 2020.
| |
a) | b) |
Figure 1. Heat use profiles for kindergartens, where: a) profiles for weekdays, b) profiles for weekends. | |
| |
a) | b) |
Figure 2. Heat use profiles for schools, where: a) profiles for weekdays, b) profiles for weekends. | |
This part presents the results for the three scenarios for the operation of the heating system in educational institutions during the pandemic. All the scenarios were developed by employing the real statistical data obtained from the schools and kindergartens. Figure 3 and Figure 4 show the results for the three scenarios for a typical year for the observed building types. Please note that Scenario 3 was based on a monthly model and is therefore indicating months that have the highest variation of the heat use between the typical cold and warm year. Among these months January, October, and December were the most noticeable ones.
Scenario 3 was created using the monthly average values, and therefore, it was not as accurate as Scenarios 1 and 2 with the hourly values. However, when considering the average monthly values, Scenario 3 would require higher heat use than Scenario 2, because it did not follow the advantageous energy-saving setting of the heating system.
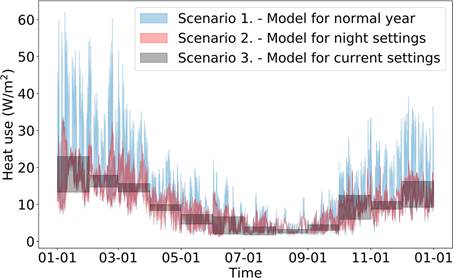
Figure 3. Three scenarios for the heat use in kindergartens.
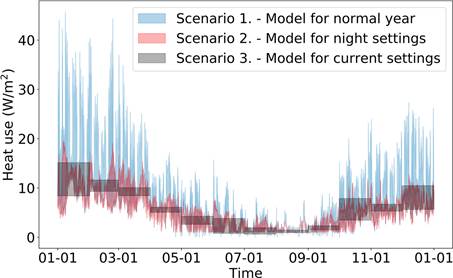
Figure 4. Three scenarios for the heat use in schools.
The above analyses showed that the application of the night setting for the whole day, see Scenario 2, might reduce the daily heat use up to 54% compared to the settings when the heating system was working in the normal conditions, see Scenario 1. For kindergartens, the daily heat use might be reduced up to 261 Wh/m² and for schools − 236 Wh/m². If the specific annual heat use is considered, for kindergartens, it might be reduced for 20.2 kWh/m² and for schools for 17.7 kWh/m². This fact indicates that there is a significant unrealized potential for energy conservation during lockdown. By applying the proper setting of the heating system during a pandemic is expected to reduce energy use and save money.
The COVID-lockdown in the educational institutions in Norway lasted for about two months. The comparison of the heat use profiles in this work was performed only for March, April, and May. This work focused on developing different heat use scenarios during a pandemic. These scenarios were adjusted to the outdoor temperatures of the typical cold and warm meteorological years.
Understanding the changes in energy use triggered by the pandemic is essential for further energy planning, avoiding excessive energy use, and ensuring the proper operation of buildings. This article highlights the issue of the analysis of the heat use profiles and scenario development for schools and kindergartens in Norway.
The methods and outcomes of the study may be applied to similar types of buildings when temporary lower attendance or shutdown will appear. Even though the presented results are valid for Norway, the presented results may be used for the comparison purpose.
This article has been written within the research projects "Energy for domestic hot water in the Norwegian low emission society" and “Methods for Transparent Energy Planning of Urban Building Stocks”. The authors gratefully acknowledge the support from the Research Council of Norway (ENERGIX-programme and ExPOSe programme), Department of Energy and Process Engineering at NTNU, SINTEF Community, and Trondheim Municipality.
Follow us on social media accounts to stay up to date with REHVA actualities
0