


Stay Informed
Follow us on social media accounts to stay up to date with REHVA actualities
|
|
Sebastian Dragosits | Roman Stelzer |
Center for Building Technology, Forschung Burgenland GmbH, Research Centre Pinkafeld, Austria | Center for Building Technology, Forschung Burgenland GmbH, Research Centre Pinkafeld, Austria |
| |
In Austria, but also in the EU (EU 27), energy consumption in the household sector has remained very steady at around 20 to 25% of total consumption in recent years. [1] In order to reduce the total energy consumption and thus to increase the overall energy efficiency, this sector can therefore be a good opportunity. Building services equipment in particular should be examined here, as incorrect design or inefficient operation often goes undetected, as long as the plant meets user requirements. Directive 2018/844/EU (EPBD) aims to counteract such undetected inefficiencies by requiring regular inspections and a monitoring system, depending on the size of the system. [2]
In the course of the "digital Twin" research project, modular and scalable inspection and diagnostic methods for the automated operational performance analysis of building services equipment and systems are to be developed, among other things. Heat pumps are often used to provide heating and cooling in buildings, which is why the research project took a closer look at the heat pump as a building services system alongside HVAC systems (Heating, Ventilation and Air Conditioning). In this paper, the developed analysis model for heat pumps is presented in more detail.
In order to create the broadest possible field of application for this overall model, individual analysis submodels were developed, which can be used depending on the information basis. In existing plants, the available measurement technology often does not allow detailed analyses to be carried out, which makes such an approach with a scalable analysis model attractive.
Depending on which variables are measured by a plant, other submodels can be selected, which in sum result in the overall analysis and evaluation. In general, the more information is available and the more quantities are measured, the more accurate the analysis and evaluation of the investigated plant will be. It should also be mentioned here that both reversible and non-reversible heat pumps can be investigated with this analysis model, since the input and calculation structure were defined so generally in advance.
The following submodels are present in the analysis model, which can identify various performance gaps in real operation mode and environment:
· Identification of the heating and cooling period of the heat pump
· Identification of the heat pump switch-on times
· Performance ratio
· Identification of the switch-on times of the secondary pump
· Identification of the switch-on times of the primary pump
· Analysis of heat storage tank (temperature stratification, loading errors)
· Analysis of cold storage tank (temperature stratification, loading errors)
Since the heat and cold supply is often coupled with balancing storage tanks, simple analysis options for heat and cold storage tanks.
The first three submodels each contain two different options on which information basis the analysis and calculation should be performed. For the identification of the heating and cooling period (ID H/C) of the heat pump, for example, there are the options to determine the respective periods with the help of the measured thermal power or the measured supply and return temperature, as can also be seen in Figure 1. In addition to the individual model options, for all sub-models except the first two (they form the basic variant for evaluating the heat pump and are therefore always executed) there is the option to skip the respective evaluation if these aspects are not to be evaluated or the information and measurement data required for this are not available.
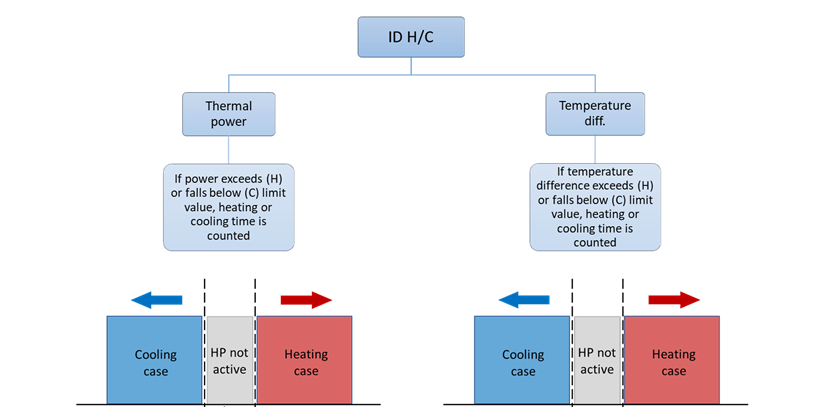
Figure 1. Example of a submodel structure (submodel: identification of heating and cooling period).
All required inputs for all submodels together are shown in Figure 2. Depending on the submodels and submodel options chosen, not all of the information shown in the Figure 2 is required.
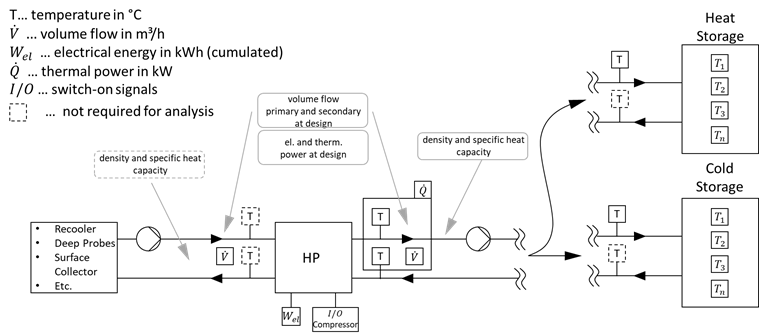
Figure 2. Total required inputs for all submodels together for reversible heat pumps.
In addition to the individual submodels, the overall analysis model also includes a resampling of the measured data, an input check of the input variables and a rough check of the data quality. For the individual calculations and evaluations in the submodels, a uniform and constant time step size of the measurement data is required. Therefore, the model includes a resampling that is performed by default each time the program is executed. Since the overall model has many submodels, an input control of the input variables was implemented. On the one hand it is checked whether all inputs were made in the necessary format and on the other hand whether the necessary information for the in each case selected models was entered before. If an input does not fit or is not existing, an error message including a correction notice will be displayed automatically. The data quality check includes statistical (number of statistical outliers, rate of change of the respective measured variable) and rule-based checks (no negative volume flows, no negative changes in cumulative measured data). If the analysis and evaluation of a plant yields unusual results, the results of the data validation can be checked to see if a faulty data set is responsible.
When all submodels are executed, the following evaluation results and ratings are returned to determine specific performance gaps:
· Switch-on times of the heat pump
· Cycle rates or cycle durations of the heat pump per operating mode (heating/cooling)
· Performance ratios
o Coefficient of Performance (COP)
o Energy Efficiency Ratio (EER)
o Seasonal Coefficient of Performance SCOP
o Seasonal Energy Efficiency Ratio (SEER)
· Comparison of the switch-on times of the heat pump with those of the feed pumps on the evaporator and condenser side
· Temperature stratification in the heat and cold storage tank
· Loading errors during heat pump operation (heat storage tank is loaded with too low or cold storage tank with too high temperature)
The switch-on times of the heat pump are analyzed in order to compare whether it was operated in the desired or energetically optimal periods. The cycle rates or cycle durations of a heat pump quickly provide information about how efficiently the heat pump is operated and whether the control or the design are generally suitable. The performance ratios (COP, EER, SCOP, SEER) directly indicate the efficiency of the heat pump and are thus an essential result of the analysis model. The comparison of the switch-on times between the heat pump and the feed pumps provides information about the timing between these components, i.e. whether the control of the feed pumps roughly fits. Regarding the storage tanks, the difference between the highest and lowest measured temperature is evaluated to check the temperature stratification (for stratified charging storage tanks). The calculation of the loading errors is again mainly aimed at checking the control whether the respective storage tank is actually always loaded with the correct temperature.
With regard to the evaluation of the individual results, limit values can be defined in the model itself, which are then used for visualization.
The analysis model was developed and validated using measurement data from a real plant. The investigated system is a reversible heat pump used in an office building. On both the heating and cooling sides, stratified charging storage tanks are available. However, it was mainly used to provide cooling energy. For validation, a historical annual data set was taken from a period in which inefficient operation of the plant was known.
The model determined, that the heat pump had very short cycle durations (six minutes on average), which was mainly due to the system being oversized relative to the actual cooling energy demand (Figure 3).
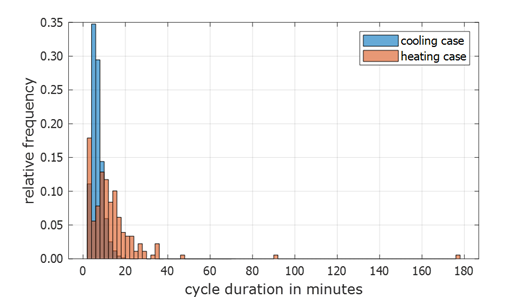
Figure 3. Cycle durations of the heat pump in cooling and heating case.
The fact that the heat pump was used almost exclusively to provide cooling was also shown by the visualization of the switch-on times, which were mainly concentrated in the summer months (Figure 4).
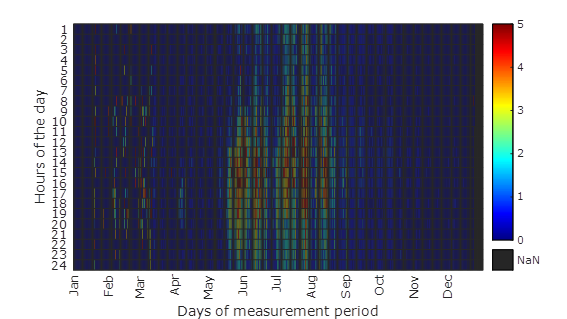
Figure 4. Hourly electrical power consumption of the evaluated heat pump in kW.
Furthermore, the SEER was somewhat low at 3.3. Regarding the feed pumps, it was found that they were active for almost the entire period, i.e. not well matched to the heat pump operation. The analysis of the two storage tanks showed that there was no effective stratification in the cold storage tank (the temperature difference between the upper and lower sensors averaged 1 K in the cooling period). This result again coincides with the almost continuous flow of the feed pump, since the water in the cold storage tank was constantly circulated outside the heat pump operation. But also, during active cooling operation some loading errors (cold storage was loaded with too high temperature) could be identified.
Currently, this analysis model is decoupled from the measurement and further processing of the analysis and evaluation results. The aim of the "digital Twin" project is not only to develop such a stand-alone analysis model, but also to link it to data acquisition (using measurement data stored in a database directly for analysis) and the visualization of results in e.g. online dashboards. This would move the actual Matlab model including operation into the background and the user would thus receive information on the plant performance on the dashboards directly after the measurement has been carried out, and this with comparatively less handling effort.
[1] Eurostat, Energy balances, Energy Balances in the MS Excel file format (2022 edition), Available online: https://ec.europa.eu/eurostat/web/energy/data/energy-balances (accessed on Sep 26, 2022).
[2] Directive (EU) 2018/844 of the European Parliament and of the Council of 30 May 2018 amending Directive 2010/31/EU on the energy performance of buildings and Directive 2012/27/EU on energy efficiency, Available online: https://eur-lex.europa.eu/legal-content/EN/TXT/?uri=celex%3A32018L0844 (accessed on Sep 26, 2022).
Follow us on social media accounts to stay up to date with REHVA actualities
0