

Stay Informed
Follow us on social media accounts to stay up to date with REHVA actualities
|
|
Ondřej Horák | Karel Kabele |
Czech Technical University in PragueFaculty of Civil EngineeringDepartment of Indoor Environmental and Building Services Engineering | Czech Technical University in PragueFaculty of Civil EngineeringDepartment of Indoor Environmental and Building Services Engineering |
Building energy performance in Czechia is evaluated on the basis of the Czech Decree on the Energy Performance of Buildings [1]. The main output is in the form of Energy Performance Certificate, which is calculated on monthly basis and even before the construction or refurbishment of the building starts.
Therefore, the paper deals with the topic of assessment of operational building energy performance. The structure of the assessment is based on above mentioned legislation with the aim of user-friendliness and clearness of the interface.
The paper presents the Energy Performance functionality, which is part of the “Smart House product management system extension” project, on which the Department of Indoor Environmental and Building Services Engineering of the Faculty of Civil Engineering of the CTU in Prague collaborates with Brand-tech company. The project is part of the "TRIO" Applied Research and Experimental Development Program announced by the Ministry of Industry and Trade of the Czechia. [2] The whole system consists of 11 functionalities which are focused on all building systems, energy sources, facility management etc. The project outputs are part of a functional sample called Modular House Monitoring System with Advanced Environmental and Energy Systems Assessment. [3]
The Energy Performance functionality has the aim of evaluating the energy flows in an assessed building during its operation. The main principle is the comparison between evaluated year of operation with so called reference year. The reference year may be based on Energy Performance Certificate, building simulation or one of the previous years of operation. The functionality structure corresponds with the Certificate (Evaluation of Total Energy Delivered and partial energies, Non-renewable primary energy, division to energy carriers). Beyond the scope of legislation, the evaluation of electricity consumption by appliances is also included.
The operational energy performance is evaluated according to the algorithm in Figure 1. First of all, an evaluation period of 1 year has to be selected (Step 1). Subsequently, in Step 2, the data from the building's measurement system, which are relevant for the evaluation, are read and in Step 3, their summarization is carried out. Step 4 is used to evaluate the data of the reference year. Then the reference and evaluation data are compared and in Step 5, a percentage evaluation of the evaluated data is performed against the reference data in Step 6. Step 7 contains a menu for displaying details for shorter time periods and in Step 8 these are then displayed (in graphical and tabular form).
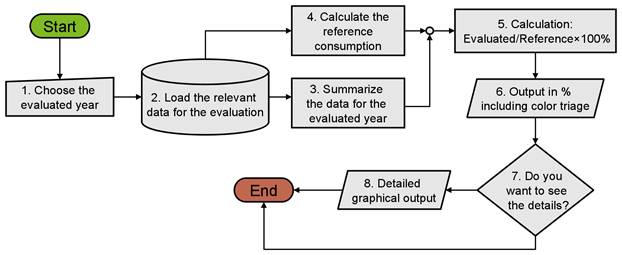
Figure 1. Scheme of algorithm which evaluates the operational energy performance.
To make the outputs understandable, they are structured similarly to the building energy performance certificate. The interface consists of screens depicting the energy flows in monthly time steps. Above them there are main screens that summarize the total energy delivered and non-renewable primary energy.
The main screen shows the main navigation of the functionality and a summary evaluation of the total energy delivered and partial energies: evaluated compared to the reference year, the percentual evaluation and triage by emoticon for clarity at a glance. By clicking on “Details” the monthly data are shown. It is also possible to select the evaluated and reference year on the main screen. By clicking on “Primary Energy” the screen of energy carries, electricity consumption by appliances and Primary energy from non-renewable sources is evaluated in the same principle.
The functionality is tested on a low-energy family house located in town Rýmařov, Czechia. It is a one-story, low-energy wooden building with an unheated attic.
The main source of heat is a stove with a fireplace, where the piece wood is burnt. The fireplace is equipped with a heat exchanger to a hot water two-pipe heating system. The second source is an electric boiler.
Domestic hot water is prepared in an accumulation tank connected to the heating system. There is another circuit for DHW preparation connected with solar thermal collectors. The tank is also equipped by electric heat cartridge.
The whole house is equipped by sensors which are measuring all the energy flows, indoor air quality and outside meteorological conditions. The data have been collecting starting January 2016 in 15-minute time step.
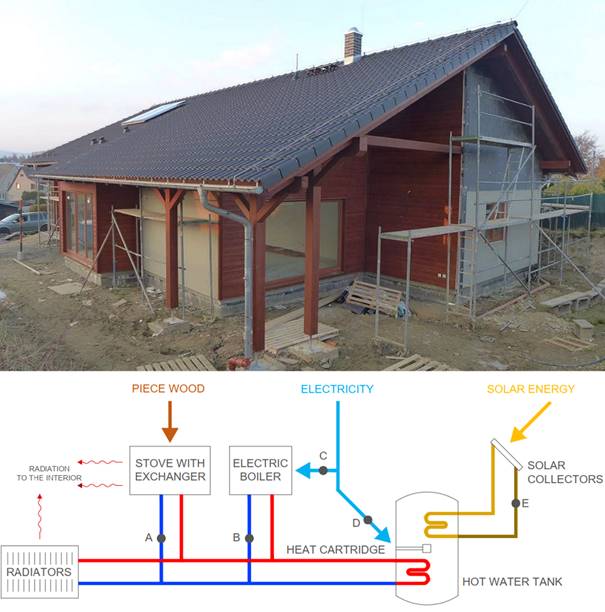
Figure 2. Family house in Rýmařov and its scheme of technical systems. [4,5]
The figures below show the evaluations of total energy delivered and partial energies during the operation of the building. The dark-beige-coloured buttons are serving for navigation and clicking between screens. It is also possible to choose evaluated and reference year. In this case study, the authors evaluate the period from 1st July 2021 to 30rd June 2022. Year 2017 was chosen as a reference.
The principle of tabular evaluation is always to display the measured energy (left column with beige numbers), the reference value of supplied energy (middle column with grey numbers). The third column then indicates the percentage rating Measured/Reference×100%. This rating is accompanied by an emoticon to inform the user how the given energy flow is doing.
By clicking on “Details” the monthly graphic and tabular evaluation of delivered energy is shown. The percentual evaluation and emoticon triage have the same principle.
The main screen on Figure 3 shows the annual results of comparison between measured and reference data. Between the reference and the evaluated year there was a decrease in energy consumption of approximately 15%. When divided into partial energies, the differences are visible. The energy consumption for heating fell by 14%. This is caused (and monthly data confirm this) by differently hard winters. As shown on Figure 4 in the reference year, the energy consumption in November, December and January was significantly higher. On the other side March 2022 was quite cold [6], so the energy consumption is about 54% higher than in reference year.
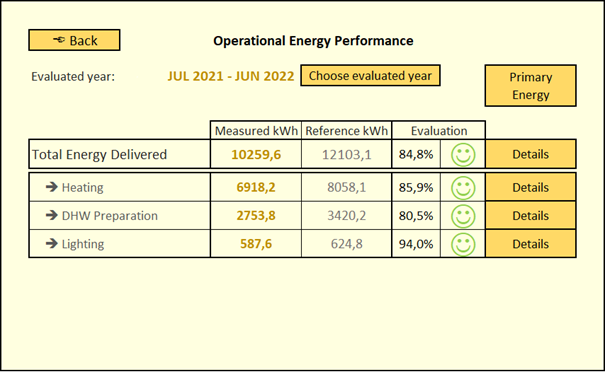
Figure 3. The main screen with annual evaluation of partial and total energy delivered. [7]
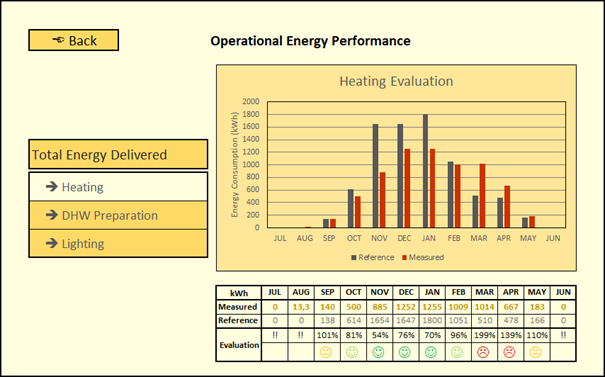
Figure 4. Detailed monthly analysis of energy consumption of heating. [7]
This chapter is focused on evaluation of primary energies. The Figure 5 shows the main screen about primary energy. The principle of evaluation is the same as on delivered energy. The screen is further supplemented with graphs dedicated to the shares of individual energy carriers.
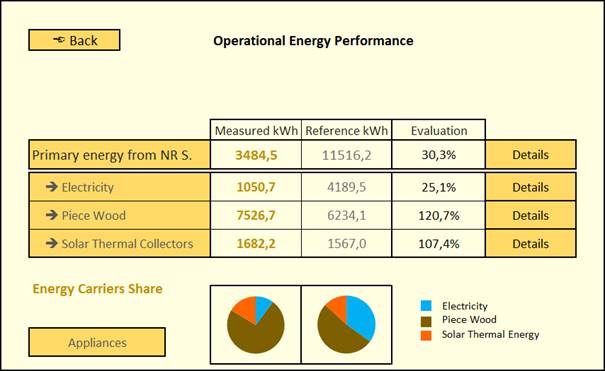
Figure 5. Main primary energy screen. [7]
The diagrams on Figure 6 confirm that the building owners use piece wood more frequently in the evaluated year. It is visible mostly in November when the share of electricity dropped almost to zero (electricity covered only the consumption for lighting).
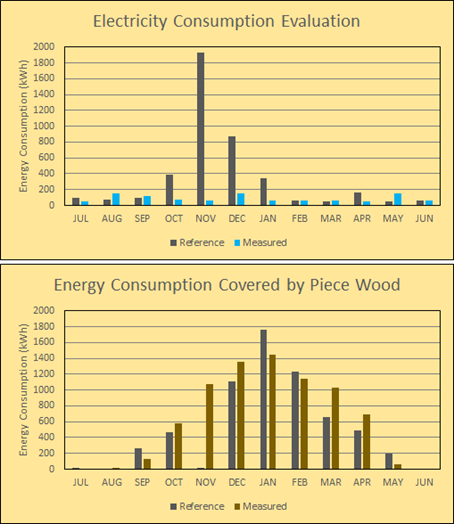
Figure 6. Cuttings from screens from interface showing detailed monthly consumption of electricity and heat energy covered by piece wood. [7]
The Graph on Figure 7 shows the electricity consumption of appliances, the increase of consumption may be caused by purchasing new appliances (for example TV and computers for kids) and a larger share of home-office due to a COVID-19 pandemic.
The appliances consume more energy than for example DHW preparation, so their consumption is not negligible and may be included in overall evaluation.
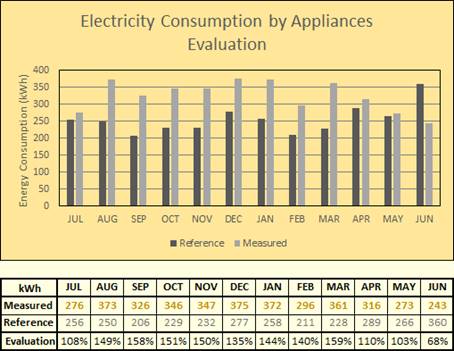
Figure 7. Cuttings from screen from interface evaluating electricity consumption of appliances. [7]
The functionality “Energy Performance” has the aim to provide proper, clear information about energy flows to the building user. The interface should be user-friendly. In present time of rapidly rising energy costs, the functionality can affect the budgets of building users. However, the presence of measurements of all energy flows in the building is a basic assumption to be able to carry out the assessment.
The aim of the authors for further development (beyond the scope of the TRIO project) is to improve the recalculation of the reference period so that the boundary conditions are as comparable as possible. For example, these are meteorological data, data on the presence of people, data on the ventilation of the interior space, etc. All this requires the installation of additional measuring sensors in the building, but at the same time it can provide even clearer information about the evaluated period in terms of energy demand.
Another goal is the ability to click energy flows down to the level of days to hours for more detailed evaluation of, for example, system failures or to optimize the operation of the building, which could lead to lower the energy consumption.
Another conclusion is that in the future it is also appropriate to focus on the consumption of electricity by appliances that are not included in the assessment according to the current legislation. In the family house, these are mainly household and office appliances. The aim of the assessment is to reduce electricity consumption and thus reduce payments.
This project was implemented with financial support from the state budget of the Czech Republic through the Ministry of Industry and Trade in the TRIO-FV40183 programme in cooperation with Brand-tech company.
The full paper was presented at the Indoor Climate of Buildings 2022 conference and is printed in the conference proceedings. [7]
[1] 264/2020 Sb. Vyhláška o energetické náročnosti budov. Zákony pro lidi - Sbírka zákonů ČR v aktuálním konsolidovaném znění [online]. Copyright © AION CS, s.r.o. 2010 [cit. 21.11.2022]. URL: https://www.zakonyprolidi.cz/cs/2020-264.
[2] Vyhlášení čtvrté veřejné soutěže v programu TRIO | MPO. Ministerstvo průmyslu a obchodu [online]. Copyright © Copyright 2005 [cit. 18.11.2022]. URL: https://www.mpo.cz/cz/podnikani/podpora-vyzkumu-a-vyvoje/vyhlaseni-ctvrte-verejne-souteze-v-programu-trio--239644/.
[3] Kabele, K.; Brůha, P.; Dvořáková, P.; Frolík, S.; Horák, O.; Kabrhel, M.; Urban, M.; Veverková, Z. et al. Modulární monitorovací systém domu s pokročilým systémem hodnocení prostředí a energetických systémů [Functional Sample] 2021.
[4] Kabele, Urban: Grant no: te02000077 Smart Regions – buildings and settlements information modelling, technology and infrastructure for sustainable development
[5] Horák, O.; Kabele, K. Predicted and Actual Energy Performance of Residential Buildings in Czechia. Case Study on Evaluation of Detailed Energy and IEQ Monitoring in Family House. In: Roomvent&Ventilation 2018: Excellent Indoor Climate and High Performing Ventilation. Helsinki: SIY Indoor Air Information Oy, 2018. ISBN 978-952-5236-48-4.
[6] Portál ČHMÚ: Historická data: Počasí: Územní teploty. Portál ČHMÚ: Home [online]. URL: https://www.chmi.cz/historicka-data/pocasi/uzemni-teploty#.
[7] Horák, O.; Kabele, K. Operational Building Energy Performance. In: Indoor Climate of Buildings 2022 Healthy Built Environment and Energy Security. Bratislava: Slovenská spoločnosť pre techniku prostredia, 2022. p. 196-203. ISBN 978-80-8284-004-2.
Follow us on social media accounts to stay up to date with REHVA actualities
0