


Stay Informed
Follow us on social media accounts to stay up to date with REHVA actualities
|
|
|
|
Weixin Zhao¹ | Simo Kilpeläinen¹ | Sami Lestinen¹ | Risto Kosonen¹,²,³ |
¹ Department of Mechanical Engineering, Aalto University, Espoo, Finland² Smart City Center of Excellence, TalTech, Tallinn, Estonia³ College of Urban Construction, Nanjing Tech University, Nanjing, ChinaE-mail: risto.kosonen@aalto.fi | |||
Buildings account for approximately 40 % of the world’s energy and 36 % of global greenhouse gas emissions in the European Union [1]. To address this, EU directive 2018/844 requires that the whole building stock in the Union must be carbon-free by 2050 [2]. Ventilation accounts 20-40 % of the total energy consumption of a building. Thus, high performing ventilation systems is a key measure to reach the EU targets.
The DCV systems are designed to meet the demand caused by the changing heat gains and indoor air pollutants in the conditioned space [3–5]. By this way, it reduces outdoor airflow rates based on the occupancy, and thus saves heating/cooling energy and fan power.
To analyze the actual performance of DCV, we performed field measurements in eight public buildings in Southern Finland.
We chose one representative space (Table 1) for monitoring from each building and these spaces consisted of meeting rooms (1, 6, and 8), offices (2, 5 and 7) and classrooms (3 and 4). Based on the ventilation design and control strategy, the spaces were classified into four types:
Type 1 Space 1, 2, 3 and 4: all-air systems with two operation modes (normal and boost modes).
Type 2 Space 5: all-air system with three operation modes (minimum, normal and boost modes).
Type 3 Space 6 and 7: air-water systems with two operation modes (normal and boost modes).
Type 4 Space 8: both all-air and air-water systems with two operation modes (normal and boost modes).
Table 1. The control methods of the studied spaces.
Space/area | Control of damper | Control of ventilation | Supply air temperature controlled based on | |
1 (meeting room/25 m²) | ON/OFF | T + CO₂ | Exhaust air temperature | |
2 (office space/25 m²) | ON/OFF | T + CO₂+ boost button | Outside air temperature | |
3 (classroom/60 m²) | Proportion | T + CO₂ | Outside air temperature | |
4 (classroom/18 m²) | Proportion | T + CO₂+ occupancy | Outside air temperature | |
5 (office/10 m²) | Proportion | T + occupancy | Outside air temperature. | |
6 (meeting room/20 m²) | Proportion | T + CO₂ | Exhaust air temperature | |
7 (office/20 m²) | ON/OFF | T + CO₂+ boost button | Exhaust air temperature | |
8 (meeting room/25 m²) | Proportion | T + CO₂ | Outside air temperature |
The measurements indicate that there are a lot of faults in airflow rate balancing and operation of DCV systems. Almost all the measured ventilation systems have significant faults of the operation that normal facility management has not noticed. Also, there are deficiencies in the technical documentation and for some buildings, the design airflow rates were not available.
In Space 1 with the normal mode (Table 2), the measured supply airflow is more than double the design airflow, and it is 3.6 times higher than the exhaust airflow. In the boost mode, airflow rate is lower than the normal mode. Also, the supply airflow is 3.4 times greater than the exhaust airflow. The damper pair was opened in the normal mode but closed in the boost mode. Therefore, the damper pair is operated exactly the opposite way.
In Space 2, the supply airflows are close to the design values in both modes. However, the measured exhaust airflow rate is much higher than the supply airflow. This lower ratio between supply and exhaust airflows leads to under pressure in the space.
In Space 3, the design values are not available for normal mode in the documentation. In the boost mode, the measured airflow rates are lower than the design values. The measured specific airflow rates are 0.9 ℓ/s/m² and 2.3 ℓ/s/m² in the normal and boost modes. Thus, do not fulfill the airflow requirements for classrooms of 3 ℓ/s/m² [6]. Also, the airflows are not balanced.
In Space 4, the measured supply and exhaust airflows are doubled to the design values in the normal mode. In the boost mode, the measured airflows are close to the design values. In Spaces 3 and 4, the airflows are too low to meet the minimum requirements.
Table 2. Measured and design airflows for Type 1 spaces (all-air system).
Space | Mode | Supply airflow [ℓ/s] | Exhaust airflow [ℓ/s] | Supply/ exhaust ratio | ||
Measured | Design | Measured | Design | |||
1 (meeting room) | Normal | 118 | 50 | 33 | 50 | 3.6 |
Boost | 81 | 100 | 24 | 100 | 3.4 | |
2 (study space) | Normal | 58 | 50 | 76 | 50 | 0.8 |
Boost | 105 | 100 | 133 | 100 | 0.8 | |
3 (classroom) | Normal | 56 | N/A | 36 | N/A | 1.6 |
Boost | 143 | 180 | 81 | 180 | 1.8 | |
4 (classroom) | Normal | 102 | 54 | 117 | 54 | 0.9 |
Boost | 174 | 180 | 200 | 180 | 0.9 | |
In Space 5 (Table 3), the airflow rates are not possible to measure in the minimum mode as being outside the measurement range (<0.9 m/s) for the damper. This measurement clearly indicates that we have the challenge to check the wide range of airflow rates with the existing technology. It is difficult to find any method that makes it possible to measure the range that is nowadays commonly used in commercial buildings.
Table 3. Measured and designed airflows for Type 2 space (all-air system).
Space | Mode | Supply airflow [ℓ/s] | Exhaust airflow [ℓ/s] | Supply/ exhaust ratio | ||
Measured | Design | Measured | Design | |||
5 (office) | Minimum | N/A | 6 | N/A | 6 | N/A |
Normal | 22 | 17 | 16 | 17 | 1.4 | |
Boost | 30 | 25 | 25 | 25 | 1.2 | |
In Space 6 (Table 4), the design values in the normal mode were not available in the design documents. In the normal mode, unbalanced airflows lead to under pressure of 16 Pa. In the boost mode, the airflows are much lower than the designed values. In Space 7, the airflows are similar to the designed airflows in both modes and ventilation works properly in Space 7.
Table 4. Measured and designed airflows for Type 3 spaces (air-water system).
Space | Mode | Supply airflow [ℓ/s] | Exhaust airflow [ℓ/s] | Supply/ exhaust ratio | ||
Measured | Design | Measured | Design | |||
6 (meeting room) | Normal | 38 | N/A | 49 | N/A | 0.8 |
Boost | 44 | 80 | 53 | 80 | 0.8 | |
7 (office) | Normal | 20 | 20 | 22 | 20 | 0.9 |
Boost | 38 | 40 | 45 | 40 | 0.9 | |
In Space 8 (Table 5), the measurements were only performed in the boost mode because the ventilation system constantly works in the boost mode due to the technical fault.
Table 5. Measured and designed airflows for Type 4 space (air water system).
Space | Mode | Supply airflow [ℓ/s] | Exhaust airflow [ℓ/s] | Supply/ exhaust ratio | ||
Measured | Design | Measured | Design | |||
8 (meeting room) | Normal | N/A | N/A | N/A | N/A | N/A |
Boost | 78 | 100 | 106 | 100 | 0.7 | |
As an example, the measured temperature, CO₂ concentration, and automation data were shown in Figure 1. When CO₂ concentration is above 750 ppm, other damper pair opens as designed. The dampers have also opened a few times when CO₂ concentration was below 750 ppm and the room air temperature was under 23°C. This is because that the boost mode was activated with the boost mode button by user. However, the measured exhaust airflow is much higher than the supply airflow.
The measurement depicts that only room air temperature and CO₂, it’s not possible to determine whether the DCV system works in its design manner. The supply/exhaust airflow rates should be always also measured.
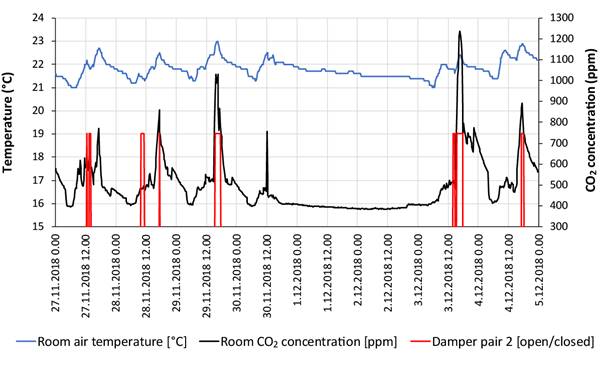
Figure 1. Performance of DCV system in Space 2.
The results show that only one DCV system performs according to design values in eight public buildings. In all the others, either the airflows were wrong or there was technical fault. However, the indoor air temperatures were within design target values in each space and no complaints about IAQ or thermal comfort were reported by the users.
Two major conclusions can be drawn from this result. Firstly, different kinds of faults seem to be common in the DCV systems. Secondly, these faults are not easy to detect only with the automation system. To guarantee the system performance, post-occupancy evaluation of the system performance should be regularly carried out.
The author wishes to acknowledge the funder of Aalto scholarship.
[1] Energy topics | Energy. https://ec.europa.eu/energy/topics/energy-efficiency/energy-performance-of-buildings/nearly-zero-energy-buildings (accessed July 20, 2021).
[2] EUR-Lex - 32018L0844 - EN - EUR-Lex. https://eur-lex.europa.eu/legal-content/EN/TXT/?uri=celex:32018L0844 (accessed July 20, 2021).
[3] M. Dodd, Comparing Energy Savings of Different VAV Systems, EnergySoft LLC. (2012) 1–9.
[4] M. Mysen, S. Berntsen, P. Nafstad, P.G. Schild, Occupancy density and benefits of demand-controlled ventilation in Norwegian primary schools, Energy and Buildings. 37 (2005) 1234–1240.
[5] A. Hesaraki, S. Holmberg, Demand-controlled ventilation in new residential buildings: Consequences on indoor air quality and energy savings, Indoor and Built Environment. 24 (2015) 162–173.
[6] D2 The National Building Code of Finland Indoor climate and ventilation of buildings regulations and guidelines 2012.
Follow us on social media accounts to stay up to date with REHVA actualities
0