

Stay Informed
Follow us on social media accounts to stay up to date with REHVA actualities
|
|
Martin Sokol | Jana Peráčková |
Department of Building Services, Faculty of Civil Engineering, Slovak University of Technology, Bratislava, Slovakia | Department of Building Services, Faculty of Civil Engineering, Slovak University of Technology, Bratislava, Slovakia |
Odour traps are the only protection against the spread of unpleasant odors and viruses from the building's drainage system. The issue of pressure fluctuations in the foul water stacks and its effect on the water level in the odour traps is not new, but the pandemic situation associated with SARS-CoV-2 has brought it up to date once again. There has been a lot of research in recent years that confirms the presence of this virus in the building's sewer system. When the function of the odour traps is lost, this virus can get out and endanger the health of the building occupants [1, 2]. Overpressure occurs most often over stack direction changes as a result of hydraulic jump, Figure 1b. At lower overpressure values, water bubbles in the traps, and at higher values, water is ejected or knocked out from sanitary appliances. Negative pressure occurs in the stack at the connection points of the branch pipes with the flow or below the change of direction of the stack where the air core of the stack closes, Figure 1a, c. When the negative pressure limits are exceeded, water is sucked out of the odour trap [3].
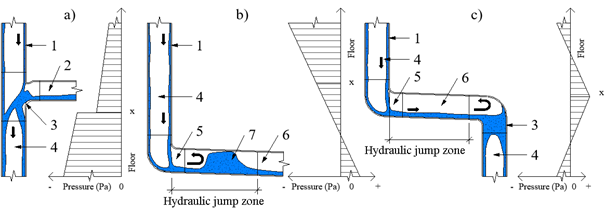
Figure 1. Water flow and pressure fluctuations in the waste pipe. a) at the point of connection of the branch pipe to the stack, b) at the point of transition of the stack to the drain, c) at the point of stack offset, 1 – annular flow, 2 – water flow from the branch pipe, 3 – piston effect, 4 – air core, 5 - water impact on the wall of the arc, 6 – steady state flow regime, 7 – hydraulic jump.
According to EN 12056 [6] and Slovak national standard STN 73 6760 [7], the minimum water level in the trap at the connection to a foul water pipe is htot = 50 mm, and at the connection to the rainwater pipe, it is htot = 80 mm. The pressure resistance of odour traps at different water level heights is shown graphically in Figure 2. The pressure resistances were calculated based on formulas that were developed in the 1980s and are still in use today [4]. However, these formulas have one major drawback in that they do not take into account the shape of the odour traps, which has a major impact on its pressure resistance. Currently, there are a large number of 50 mm odour traps on the market that have a pressure resistance of around 400 Pa or quite a bit higher, which does not correspond to these calculations. This information is also not found in the manufacturers' datasheets, which would greatly reduce the error rate of the designs.
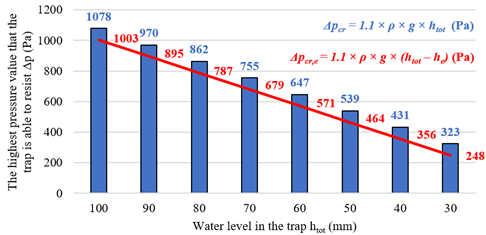
Figure 2. Resistance of the trap to pressure according to the water level. ■ without taking into account evaporation according to Formula (1), ■ taking into account the evaporation after 14 days of not using the sanitary appliance (evaporation 0,5 mm/day), Δpcr – the maximum pressure that the trap can resist (Pa), ρ – water density (kg/m³), g – gravitational acceleration (m/s²), htot – the height of water in the trap (m), he – decrease of water in the trap due to evaporation (m).
Our simulation observed the effect of pressure fluctuations in a stack on the water level in the trap. Two reference traps, which are most commonly used for sinks or basins and toilets, were used, Figure 3a, b. Pressure ranging from – 550 Pa to + 1500 Pa was simulated in the stack. The range of values was chosen based on various experimental measurements outside of Slovakia, where similar ranges of pressures were measured [4, 5]. The boundary conditions of the simulation are shown in Figure 3c, d. The following inputs and settings were used for the simulation:
· the trap contained water with a density of 999.1 kg/m³,
· air with a density of 1.225 kg/m³ was present in the stack and branch pipe,
· pressure values ranging from – 550 Pa to + 1500 Pa were generated in the stack [4, 5],
· calculations were performed with 1000 time steps, a time step length of 0.005 s, and a number of iterations per time step of 40.
The following water level conditions were monitored in the trap:
· water level fluctuations due to overpressure or negative pressure (without compromising the functioning),
· the suction of part of the water due to negative pressure (without compromising the function/ with compromising the functioning),
· complete suctioning of the water due to negative pressure (loss of function),
· water bubbling due to overpressure (loss of function),
· ejection of water due to overpressure (loss of function).
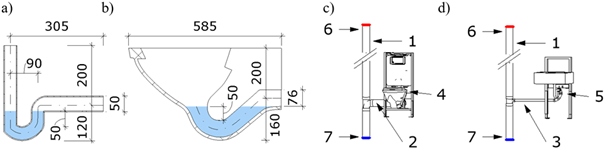
Figure 3. Traps used for simulation. a) trap for sink or basin with 50 mm height of the water, b) trap for WC with 50 mm height of the water, c) WC connection to the stack, d) connection of the sink or basin to the stack, 1 – DN 100 stack, 2 – DN 100 branch pipes with a length of 1 m, 3 – DN 50 branch pipes with a length of 1 m, 4 – the trap for WC with a water seal height of 50 mm, 5 – the trap for the sink or basin with a water seal height of 50 mm, 6 – pressure outlet (atmosphere), 7 – pressure inlet (– 550 to + 1500 Pa).
The traps from Figures 3a, c, were tested for negative pressures ranging from 0 to 550 Pa. The above-mentioned water level conditions were observed in the trap. The toilet trap, which could withstand a negative pressure of pn = 525 Pa without any loss of function, achieved the best results in this test. The trap for the basin or sink withstood a negative pressure of pn = 475 Pa. The detailed simulation results are shown in Table 1 and Table 2.
Table 1. Effect of negative pressure on the water level in the sink trap.
Negative pressure pn (Pa) | Effect on the water level |
≤ 300 | without compromising its functioning, drop in water minimal |
300 to 450 | without compromising its functioning, drop in water up to 25 mm |
450 to 475 | compromising its function, drop in water up to 30 mm, suctioning of air from the interior |
> 475 | loss of functioning, complete suction of water from the trap |
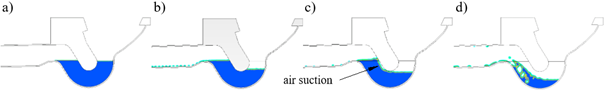
Figure 4. Effect of negative pressure on the water level in the trap. a) no impact on the water level, b) water level losses (without compromising its functioning) c) water level losses with air intake from the interior (compromising its function) d) complete suction of water from the odour trap (loss of functioning).
Table 2. Effect of negative pressure on the water level in the WC trap.
Negative pressure pn (Pa) | Effect on the water level |
≤ 300 | without compromising its functioning, drop in water minimal |
300 to 450 | without compromising its functioning, drop in water up to 25 mm |
450 to 525 | compromising its function, drop in water up to 35 mm, suctioning of air from the interior |
> 525 | loss of functioning, complete suction of water from the trap |
From the point of view of safety, the lowest risk of sucking water out of the water seal is the negative pressure pn ≤ 300 Pa. At these values, the water drop in the trap is minimal, Figure 4a. The safest design method is to assess the stacks for a negative pressure pn ≤ 300 Pa. There was more water suction from the trap and a negative pressure from 300 to 450 Pa, but the functioning of the trap was not compromised. The maximum recorded water drop in the trap was 25 mm, Figure 4b. Considering issues of safety and costs, assessing stacks to a negative pressure pn ≤ 450 Pa is an economical solution and is still relatively safe.
The traps from Figures 3a, c, were tested for overpressures ranging from 0 to 1500 Pa. The high overpressure range was chosen based on experimental measurements from outside of Slovakia when the overpressure of 1500 Pa was measured. The overpressure was measured at the incorrectly chosen technical solution of the stack offset in a 9 – story building [5]. The above-mentioned water level conditions were observed in the trap. The best results in this test were achieved by the toilet trap that could withstand an overpressure po = 875 Pa without any loss of functioning. The trap for the basin and sink withstood an overpressure po = 725 Pa. The detailed simulation results are shown in Table 3 and Table 4.
Table 3. Effect of overpressure on the water level in the sink or basin trap.
Overpressure po (Pa) | Effect on the water level |
≤ 725 | without compromising functioning, water level fluctuations |
725 to 1025 | loss of function, water bubbling |
> 1025 | loss of function, complete ejection of water |
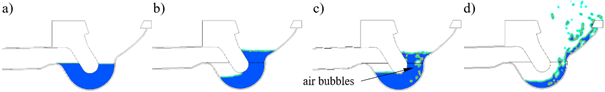
Figure 5. Effect of overpressure on the water level in the trap. a) no impact on the water level, b) water level fluctuations (without compromising its functioning), c) water bubbling (loss of function), d) complete ejection of water (loss of function).
Table 4. Effect of overpressure on the water level in the WC trap.
Overpressure po (Pa) | Effect on the water level |
≤ 875 | without compromising functioning, water level fluctuations |
875 to 1025 | loss of function, water bubbling |
> 1025 | loss of function, complete ejection of water |
From a safety point of view, an overpressure of po ≤ 725 Pa (sink, basin) and po ≤ 875 Pa (WC) runs the lowest risk of the water bubbling or the ejection of water from the sanitary appliance. At these values, the water level in the trap only fluctuates, without any undesirable processes occurring, Figure 5b. The problems with the high overpressure values cannot be solved by the correct design of the stack’s dimensions. An incorrectly resolved change in the direction of the stack can cause overpressure above 1000 Pa even in low buildings (10 floors). Nowadays, there are various accessories for stacks, including positive pressure attenuators, which can sufficiently eliminate such high values.
Based on the simulation of the effect of pressure on the water in a trap, it can be stated:
· the safest solution is to assess the stacks for a negative pressure of pn ≤ 300 Pa, which has a minimal effect on the water level in the trap,
· after taking into account the costs and safety, it is acceptable to design stacks for
· a negative pressure of pn ≤ 450 Pa when there is a drop in the water in the trap, which does not endanger its functioning,
· at a negative pressure of pn > 450 Pa, the functioning of traps is compromised due to the suctioning of air from the interior; and when pn > 475 Pa, the functioning of the trap ceases due to the suctioning of the water seal,
· when the overpressure of po > 725 Pa, water bubbles in traps, which leads to the spread of annoying smells in the building,
· when the overpressure of po > 1025 Pa, the water is ejected from sanitary appliances,
· the shape of a trap affects its pressure resistance.
All results will be verified by experimental measurement in the future.
The proper design of foul water stacks is crucial, particularly in high-rise buildings. To avoid undesirable effects that may arise when water is sucked or ejected from the traps, it is necessary to assess them for the correct limit values. The most important part of assessing stacks is assessing the maximum negative pressure because the overpressure can only be influenced by the correct design of the stack offset. Consideration must be given to direct vent stacks, which may exceed the maximum negative pressure if adequately designed according to the standards. The assessment of the stacks at a negative pressure of pn ≤ 450 Pa represents a safe and cost-effective route based on the simulation and the assumption of a 50 mm high water seal. However, this value should be very well considered in spite of these results, and any odour traps that are planned to be used on the stack should be analysed. It would be a great help if manufacturers would just add this information to their datasheets, as this information must be available to them before they can be placed on the market.
This work was supported by the Ministry of Education, Science, Research, and Sports of the Slovak Republic through the Scientific Grant Agency VEGA 1/0303/21 and KEGA 005STU-4/2021.
[1] GORMLEY, M., ASPRAY, T., KELLY, D. Building Drainage System Design for Tall Buildings: Current Limitations and Public Health Implications. In: Buildings. 2020, 11 (2). Available at https://doi.org/10.1016/S2214-109X(20)30112-1.
[2] HUNG, H. C., CHAN D. W., LAW, L. K., CHAN, E. H., WONG, E. S. Industrial Experience and Research into the Causes of SARS Virus Transmission in a High-Rise Residential Housing Estate in Hong Kong. In: Building Serv. Eng. Res. Tech. 2006, 27(2), s. 91–102. Available at: https://doi.org/10.1191/0143624406bt145oa.
[3] POMOGAEVA, V., MATECHKO, L., PROKOFIEV, D., NAREZHNAYA, T. Investigation of the motion processes of wastewater in sewerage of high-rise buildings. In: E3S Wew of Conferences. 2018, s. 1 – 9. Available at: https://doi.org/10.1051/e3sconf/20183302013.
[4] VALÁŠEK, J. Vodovody a kanalizácia vo vysokých budovách (Water supply and drainage in high-rise buildings). Bratislava: Alfa, 1982, Slovakia, s. 131-157. ISBN 63-021-82.
[5] YABE, S., OTSUKA, M., KAWAGUCHI, T., SUGIMOTO, R. Experimental Investigation of the Influence of Different Offset Piping Methods on the Drainage Performance of a Drainage Stack. In: CIB W062 Symposium. 2015, s. 30 - 55. Available at: https://www.irbnet.de/daten/iconda/CIB_DC30620.pdf.
[6] EN 12056:2002 Gravity drainage systems inside buildings.
[7] STN 73 6760:2009 Kanalizácia v budovách (Drainage in budlings).
Follow us on social media accounts to stay up to date with REHVA actualities
0