

Stay Informed
Follow us on social media accounts to stay up to date with REHVA actualities

Copyright ©2022 by the authors. This conference paper is published under a CC-BY-4.0 license. |
|
|
Jeffrey D. SpitlerSchool of Mechanical and Aerospace Engineering, Oklahoma State University, Stillwater, Oklahoma, spitler@okstate.edu | Signhild E. A. GehlinThe Swedish Geoenergy Center, Lund, Sweden, signhild.gehlin@geoenergicentrum.se |
The thoroughly instrumented 200 kW ground-source heat pump system serving 6300 m² two-story Studenthuset building in Stockholm, has now been monitored for five years. 20 boreholes of 200 m depth in hard rock serve as the source for the heat pumps and also provide space cooling directly. This paper presents the results in the form of a range of performance indicators that describe the short-term and long-term system performance. Performance factors are computed for several boundaries defined by the IEA HPT Annex 52 boundary schema. Seasonal, monthly, daily, and binned performance factors for both heating and cooling operation are presented and discussed.
The energy consumption of building heating and cooling systems often exceeds design expectations, the so-called “building energy performance gap.” [1] Reasons for the gap include errors in design and installation, and non-optimal operating and control settings. Problems that don’t lead to occupant discomfort may neither be detected nor mitigated for months or years without performance measurements. Despite the need for measurements, published results from long-term performance monitoring of building energy systems are scarce.
For larger non-residential ground-source heat pump (GSHP) systems, measured performance is seldom reported. Spitler and Gehlin [2] give an overview of published long-term (> 1 year) measured SPF and COP values reported in the literature for 55 systems worldwide. Such systems are necessarily more complex than GSHP systems for small residential buildings, and often include both heating and cooling as well as supplementary heating and cooling sources and heat recovery.
In 2018 a four-year international collaboration project IEA HPT Annex 52, Long-term performance measurement of GSHP systems for commercial, institutional and multi-family buildings [3] began with the aim to monitor and analyze the long-term performance of a large number of GSHP systems in several countries. The emphasis was on heat pump and system performance, e.g. determining coefficients of performance, seasonal performance factors and other system efficiency indicators. The project closed at the end of 2021, with performance measurement results from 30 large GSHP systems in seven countries. The Annex has yielded a number of case study reports as well as guidelines for instrumentation [4] and uncertainty analysis [5].
One of the monitoring projects within IEA HPT Annex 52 is the GSHP system at the student union building “Studenthuset” at Stockholm University in Sweden. Spitler and Gehlin [2] analysed performance data for one year of operation (April 2016-March 2017) including seasonal performance factors and monthly, daily, and binned average values of coefficients of performance, as well as a detailed uncertainty analysis. Spitler and Gehlin [6] present an extended analysis of performance data from Studenthuset, including three years of analysed data and a discussion about the correlation between performance factors and heating and cooling load. The authors conclude that the system performance is strongly related to the load. With increasing load, the system performance also increases, and the system has relatively poor performance at times when the heating and cooling loads are low.
In this paper, a streamlined version of [7], an extended analysis of 60 months of monitoring (2016 - 2020) from the Studenthuset GSHP system is presented. Performance factors for multiple system boundaries and time frames as well as additional performance indicators and their correlation to load are analysed and discussed. The datasets generated and analyzed during the current study are available at: https://doi.org/10.22488/okstate.22.000005.
The Studenthuset building is a 6300 m² four-story building completed in the fall of 2013. It contains office area, meeting rooms, study-booths for students and a café.The building services are thoroughly instrumented and maintained by highly skilled staff. The building services and GSHP system are described in references [2,6,7].
The building’s heating, cooling and domestic hot water (DHW) loads are met by the GSHP system. No auxiliary heating or cooling is installed, except for an electric resistance heater that boosts the hot water temperature to protect against Legionella. Heat distribution is provided by radiators with extra-large surface areas at a distribution temperature of 40°C instead of 55°C, which is the more common distribution temperature in Sweden. The cooling distribution system is a combination of VAV (variable air volume) and CAV (constant air volume) with chilled beams for ventilation and cooling.
Space heating and DHW are provided by the GSHP system which consists of five 40 kW off-the-shelf water-to-water heat pumps connected to a borehole field with 20 groundwater-filled boreholes in hard rock. The boreholes are 200 m deep and are fitted with single u-tubes filled with an ethanol/water mixture. The bore field is located below a landscaped courtyard and the boreholes are drilled at an angle so that they reach under the surrounding building. Space cooling is provided by direct cooling from the boreholes.
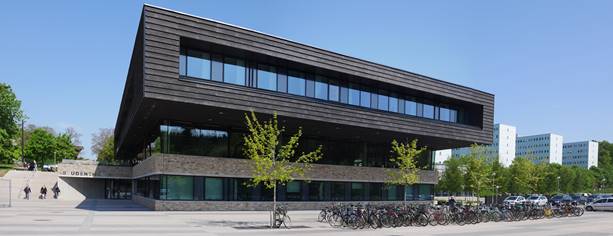
Figure 1. Studenthuset in Stockholm, Photo: JD Spitler.
Figure 2 shows a simplified schematic layout of the Studenthuset GSHP system. Six levels of system boundaries (0-5) are defined in the figure, for the evaluation of performance indicators.
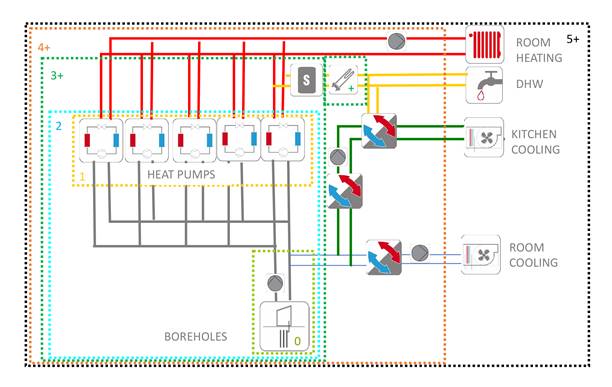
Figure 2. Schematic and Annex 52 system boundaries for Studenthuset. Pictograms in drawing used with permission from TU Braunschweig IGS.
The six system boundary levels were developed within the IEA HPT Annex 52 project and represent an extension of the widely used system boundary schema developed within the EU project SEPEMO [8] in 2012. While the SEPEMO boundary schema was aimed at small monovalent or bivalent heat pump systems, the Annex 52 schema allows for a higher degree of system complexity such as in larger GSHP systems like Studenthuset. The Annex 52 system boundary schema with six boundary levels and an indicator for use of supplemental heating or cooling is one of the outcomes from the IEA HPT Annex 52 project and is described in more detail in [9]. It is used in this paper and [6,7] for the analysis of the Studenthuset operation and performance, while the SEPEMO schema was used in [2].
The measured data for Studenthuset allows for calculation of heating performance at boundary levels H2, H3+ and H5+* and cooling performance at boundary levels C2 and C3 (which are the same for this system).
Performance factors may also be estimated for boundary levels H1* and C5*, with some approximations; the asterisk is used to indicate that the measured performance factor does not exactly correspond [7] to the Annex 52 definition.
Full descriptions of the instrumentation and uncertainty analysis are given in [2]; error bars shown in this paper are based on that analysis. While most measurements are made with individual meters, the electricity use for the five heat pumps and the electricity consumed by the Legionella protection system are measured by one electricity meter. Therefore, the energy consumed by the Legionella protection system (LPS) is estimated from other measurements and subtracted.
A common way to characterize the building space heating and cooling loads is the energy signature, shown in Figure 3 for Studenthuset. This signature excludes domestic hot water heating and kitchen refrigeration. The building uses a modest amount of cooling even down to low outdoor air temperatures. Presumably, this is due to chilled water being circulated and casually gaining heat from the space.
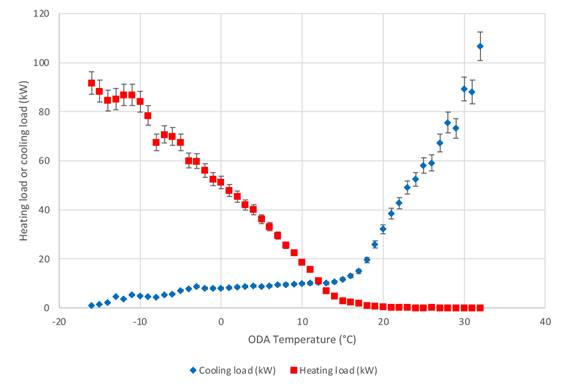
Figure 3. Energy signature: building heating & cooling.
For ground-source heat pump systems, the balance between annual heat rejection and heat extraction is an important parameter. A detailed analysis [7] gives the estimates of the annual loads on the ground shown in Figure 4, with positive values representing heat extraction and negative values representing heat rejection or reductions in heat extraction. If the annual heat transfer were perfectly balanced, the positive and negative portions in Figure 4 would have the same magnitude. It is notable that the load-side circulating pumps and fans (LSCPF) consume more energy than the heat pump compressors, while the source side circulation pumps (SSCP) use a very small amount of energy. The net effect is that, even though the building heating loads are higher than the building cooling loads, the system rejects about 30% more heat than it extracts.
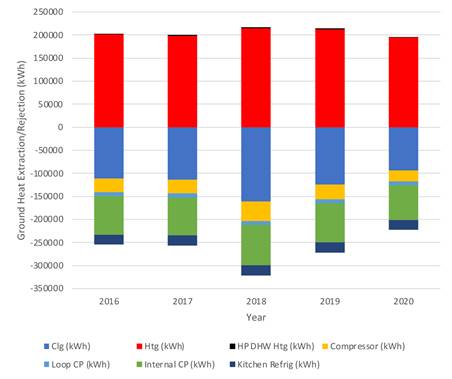
Figure 4. Estimated energy rejection and extraction components (to/from ground).
Ground-source heat pump systems usually have more favorable source temperatures than air-source heat pump systems. Figure 5 illustrates this, showing both the hourly outdoor air temperature and hourly exiting fluid temperature from the GHE. Although it is not clearly seen in the plot, there is a very slight (0.2°C) rise in the GHE temperatures over the five-year period of operation. This is consistent with the annual heat rejection being higher than the annual heat extraction.
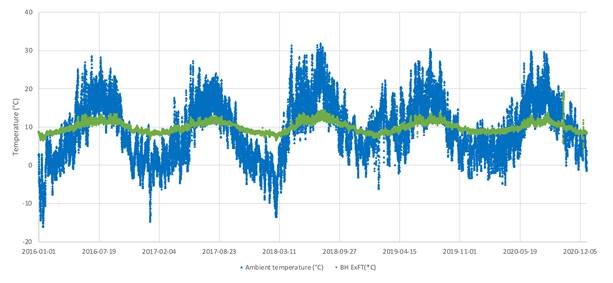
Figure 5. Ground heat exchanger entering fluid temperature and ambient temperature over the five years of measurement (2016-2020).
The cooling system was designed to operate with a maximum temperature of 16°C coming back from the boreholes. To date, the highest return temperature was 14.1°C during the unusually hot summer of 2018. This suggests that the system will likely operate for many years before peak temperatures hit 16°C. That is, there is plenty of time to adjust system operation to mitigate this slight temperature rise.
The electrical energy consumption for each of the measured five years is summarized for heating (Figure 6) and cooling (Figure 7). The electrical energy for the load-side circulating pumps and fans (LSCPF) and the source-side circulating pump (SSCP) are allocated proportionally to the amount of heating and cooling provided. It’s notable that the energy used for distributing heating (LSCPF) is similar to that used by the heat pumps for heating. This has a deleterious impact on the system performance.
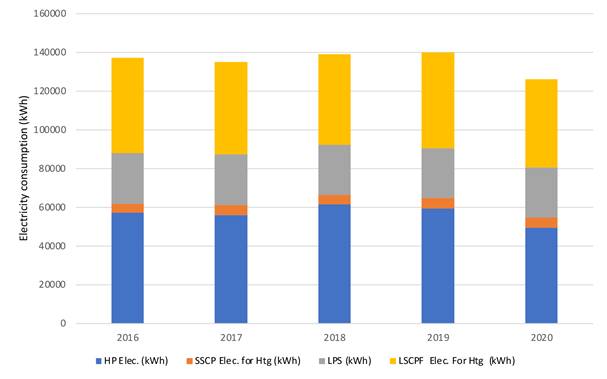
Figure 6. 5-year electricity use breakdown for heating.
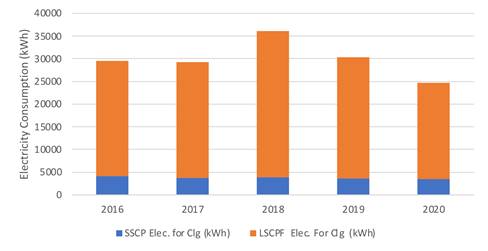
Figure 7. 5-year electricity use breakdown – cooling.
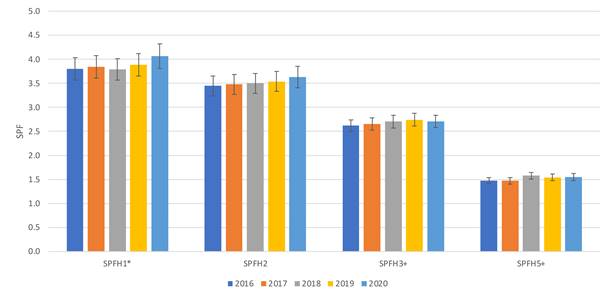
Figure 8. Heating SPF (2016-2020).

Figure 9. Cooling SPF (2016-2020).
Seasonal performance factors for heating are computed for each year, grouped by the Annex 52 boundaries defined in Figure 2, with deviations indicated with asterisks as discussed in Section 2. For each boundary, minor year-to-year fluctuations can be observed. From boundary 1* to 2, the SPF decreases due to the source-side circulating pump (SSCP). A further drop from boundary 2 to boundary 3+ is caused by the Legionella protection system (LPS), which consists of electric resistance heating to raise the hot water temperature to 60°C from the 55°C water provided by the heat pumps, and recirculation pumps that maintain high water temperatures throughout the piping network. Finally, from boundary 3+ to 5+*, the load-side circulation pumps and fans consume more electrical energy than the heat pump compressors and consequently reduce the seasonal performance factor (SPF) by more than 40% to approximately 1.5. The design and operation of the load-side pumping and piping was not part of our study, but it seems likely that there is significant room for improvement.
SPFs for the cooling system are given in Figure 10 for boundaries 2 and 5*. (Note difference in scale.) Boundary 2 shows very high SPF values, as the only electrical energy is for the source-side circulating pump. However, when accounting for the load-side circulating pumps and fans, with boundary 5*, the system performance is not so great. Meaningful comparisons can be difficult to make, but [10] reports cooling SPFC5 (including fan energy) of a distributed GSHP system with much higher ground temperatures of 4.2±0.6. The distributed GSHP system did not have “free cooling” yet was able to provide cooling to the space significantly more efficiently than the Studenthuset system.
The performance factors shown above rely on allocation of the energy consumed by circulating pumps and fans between cooling and heating. An alternative approach is to calculate an overall performance factor for heating and cooling. The impact of the internal heating and cooling distribution energy is still substantial, decreasing the 5-year SPF from 5.2±0.2 at boundary HC2 to 1.8±0.3 at boundary HC5+*.
Monthly performance factors (MPF) for heating and cooling are shown in Figure 10 and 11, respectively. Perhaps contrary to thermodynamic expectations, heating MPF are higher in the winter and lower in the summer, when the ground heat exchanger return temperatures are more favorable. As previously observed for this system and other systems – parasitic losses (e.g. control boards and energized solenoid valves) and cycling losses decrease the performance of GSHP under low-load conditions.
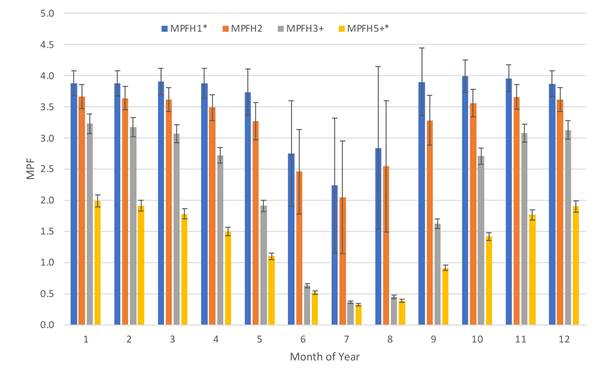
Figure 10. Heating monthly PF (2016-2020).
For cooling, MPF are higher during the winter months, when return fluid temperatures from the ground are lower. This is as expected, but the trend is also due to the allocation of pumping energy between heating and cooling, as will be shown in the next section.
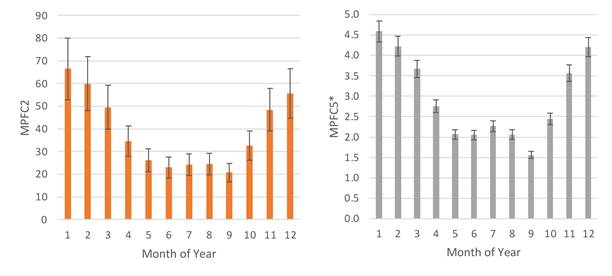
Figure 11. Binned monthly performance factors for cooling for each month in 2016-2020, with error bars.
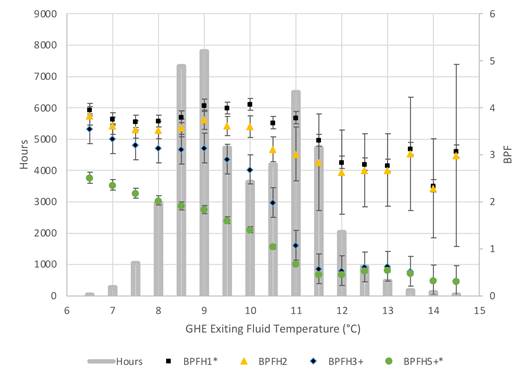
Figure 12. Binned performance factors for heating vs ground heat exchanger exiting fluid temperature.
From a thermodynamic perspective, heat pump performance is expected to increase as source temperatures become more favorable. Binned performance factors have been calculated for heating and cooling, as shown in Figures 13 and 14. Each symbol or bar in these figures represents performance for all hours in a certain bin. E.g., the symbol at a GHE exiting fluid temperature of 8°C represents all hours with temperatures between 7.75 and 8.25°C. The gray bars represent the number of hours in each bin.
Opposite to thermodynamic expectations for heating with heat pumps, the performance for every boundary trends downward with increasing entering fluid temperature to the heat pump. The highest GHE ExFT occur in the summer period, which is a period with low use of Studenthuset and when the need for heating is mainly for DHW and Legionella protection. Energy use for circulation pumps and LPS will then be high compared to delivered energy, hence the low performance factors.
For cooling, the performance factors show a V-shaped trend – highest at low or high temperatures, lowest at the middle point. For space reasons, only boundary 5* is shown here, but the trend is the same for boundary 2. At low temperatures, where cooling is being provided simultaneously with heating, the amount of pump energy allocated to cooling is small, leading to high BPF. This is shown by calculating the BPF assuming that all of the pump and fan energy is allocated to cooling –shown as the orange triangles in Figure 13. In this case the performance increases with increasing fluid temperature. This is also contrary to expectations – for any given amount of pump and fan energy, one would expect to see a decrease in performance factor for cooling, as the GHE ExFT increases. However, the temperatures are highest during periods of high loads, which is also when the amount of energy used for circulation pumps and fans are lowest compared to delivered cooling.
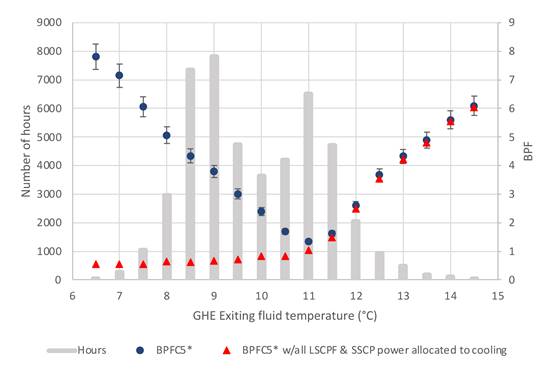
Figure 13. Binned performance factors for cooling vs ground heat exchanger exiting fluid temperature.
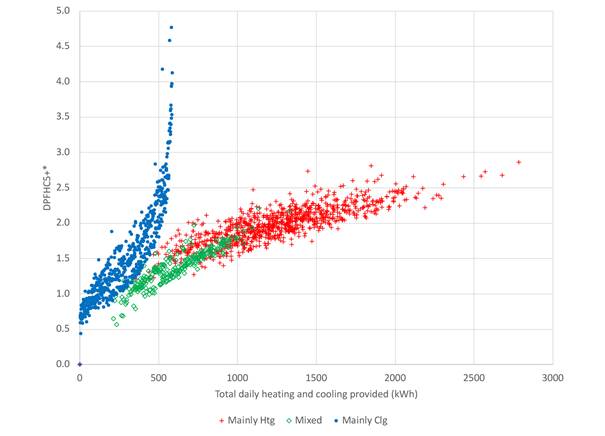
Figure 14. Binned daily total performance factors vs total heating and cooling provided at boundary 5+*.
As may be inferred from the above results, the amount of heating and cooling being provided has a significant impact on the overall system performance, reducing the proportion of electrical energy used for pumping, blowing, and “parasitic” uses like control boards and solenoid valves.
Figure 14 shows binned daily system performance factors (boundary HC5+*) for heating and cooling combined, vs. the total amount of heating and cooling being provided. The performance factors are divided into days that are “mainly cooling”, “mixed”, and “mainly heating”, based on the ratio of heating provided to total heating and cooling providing being less than 0.25, between 0.25 and 0.67, and greater than 0.67, respectively. The general trend for all categories is increasing performance with increasing total load. The mainly cooling days give relatively high performance as the better performance of the free cooling system becomes dominant with higher loads. The character of the “mixed” days follows the trend of the “mainly heating” days, although in the lower load and performance factor region.
In this paper, five years of data from the Studenthuset ground-source heat pump system have been analyzed from a system performance perspective. The measured data for the period 2016-2020 show that the ground heat rejection exceeds the ground heat extraction by about 30%, leading to a minimal temperature increase over the five measured years. The analysis indicates that if operated as is, the GHE will not exceed its temperature constraints for many decades.
The dominant factor for the overall system performance is the amount of heating and cooling provided by the GSHP system – increased heating and cooling leads to higher PF. The reason is that the proportion of electrical energy used for circulation pumps, fans and “parasitic” uses such as control boards and solenoid valves decrease when energy provided increases. The Studenthuset GSHP PF are highest when the building is used heavily, and the lowest performance factors appear during those periods when students are off campus and the building is little used. During those periods standby circulation, DHW and Legionella protection are dominant.
The Studenthuset study pinpoints the deleterious effect of the load side distribution (piping, pumping, fans) and LPS on the system performance factors. The distribution system and Legionella protection systems result in the 5-year combined heating and cooling SPF decreasing from 5.2 at boundary HC2 to 1.8 at boundary HC5+*. While it is important to maintain proper Legionella protection, the LPS operation ought to be optimized so that it does not use more energy than necessary. There is room for further system improvement and component development to minimize the energy use for load side distribution. Comparisons to a distributed GSHP system [10] in the USA suggest that the load-side system distribution energy in Studenthuset is excessive. Comparative studies between centralized and distributed GSHP systems would be useful in shedding further light on distribution energy in heat pump systems.
Thanks go to Anders Larsson and Akademiska Hus providing measurement data and information about the monitored building, along with permission to make the data publicly accessible. The support from the authors’ employers and the Swedish Energy Agency (TERMO research program Grant 45979-1) is gratefully acknowledged. This work is part of the IEA HPT Annex 52. [3].
The full paper can be accessed at: https://proceedings.open.tudelft.nl/clima2022/article/view/126.
[1] de Wilde P. The gap between predicted and measured energy performance of buildings: a framework for investigation. Automation in Construction. 2014;41:40-9.
[2] Spitler JD, Gehlin S. Measured Performance of a Mixed-Use Commercial-Building Ground Source Heat Pump System in Sweden. Energies. 2019;12(10):2020.
[3] IEA HPC.: Annex 52 - Long term performance measurement of GSHP Systems serving commercial, institutional and multi-family buildings. 2019 https://heatpumpingtechnologies.org/annex52/.
[4] Davis JM, Martinkauppi I, Witte H, Berglöf K, Vallin S. IEA HPT Annex 52 - Long-term performance monitoring of GSHP systems for commercial, institutional, and multifamily buildings Guidelines for Instrumentation and Data. 2021. DOI.: 10.23697/tgr4-qn89.
[5] Spitler JD, Berglöf K, Mazzotti Pallard W, Witte H. EA HPT Annex 52 - Long-term performance monitoring of GSHP systems for commercial, institutional and multi-family buildings. Guidelines for Calculation of Uncertainties. 2021. DOI.: 10.23697/m2em-xq83.
[6] Spitler, J.D. and Gehlin, S.: Three Years’ Performance Monitoring of a Mixed-Use Ground Source Heat Pump System in Stockholm. Proceedings of the 13th IEA Heat Pump Conference, April 26-29, 2021, Jeju, Korea. 2021.
[7] Spitler, JD and. S Gehlin. 2022. Performance of a mixed-use ground source heat pump system in Stockholm. 14th REHVA World Congress, Clima 2022. Rotterdam, The Netherlands. May 22-25. https://doi.org/10.34641/clima.2022.126.
[8] Nordman, R.: Seasonal performance factor and monitoring for heat pump systems in the building sector, SEPEMO-Build, Final Report. Intelligent Energy Europe 2012.
[9] Gehlin, S. and Spitler, J.D.: Half-term Results from IEA HPT Annex 52 - Long-term Performance Monitoring of Large GSHP Systems. Proceedings of the 13th IEA Heat Pump Conference, April 26-29, 2021, Jeju, Korea. 2021.
[10] Southard, LE., X. Liu and J. D. Spitler. 2014. Performance of HVAC Systems at ASHRAE HQ – Part 2. ASHRAE Journal 56(12): 12-23.
Follow us on social media accounts to stay up to date with REHVA actualities
0