


Stay Informed
Follow us on social media accounts to stay up to date with REHVA actualities

|
|
|
|
|
Eugene Mamulova | Henk W. Brink | Marcel G. L. C. Loomans | Roel C. G. M. Loonen | Helianthe S. M. Kort |
Eindhoven University of Technology, Eindhoven, the Netherlandse.mamulova@tue.nl | Eindhoven University of Technology, Eindhoven, the Netherlands & Hanze University of Applied Sciences, Groningen, the Netherlands | Eindhoven University of Technology, Eindhoven, the Netherlands | Eindhoven University of Technology, Eindhoven, the Netherlands | Eindhoven University of Technology, Eindhoven, the Netherlands |
Thermal comfort is that condition of mind that expresses satisfaction with the thermal environment [1]. Building engineers refer to building standards to predict the thermal comfort conditions for a given design. However, current standards do not always produce adequate thermal comfort predictions [2]. Researchers in the field of thermal comfort seek to understand and predict thermal comfort, using explanatory and predictive models. Explanatory models typically employ statistical techniques that provide insight into what influences thermal comfort in offices. Predictive models are built to forecast the thermal comfort conditions for a given office space.
Recent research efforts have focused on multi-domain approaches that treat thermal comfort as a combination of variables belonging to four domains, outlined in Figure 1 [3]. Their relevance is apparent but their presence in existing thermal comfort models is limited [4]. The combined presence of all four domains is almost non-existent [4]. Moreover, the majority of existing studies focus on explanatory modelling [4]. The rift between design conditions and real-world conditions is in part attributable to the absence of a suitable thermal comfort model. In consequence, it is important to pursue better prediction of thermal comfort in office buildings and it is worthwhile doing so using the multi-domain approach. This study looks at existing thermal comfort models to identify potential variables that may aid in better explaining and predicting thermal comfort.
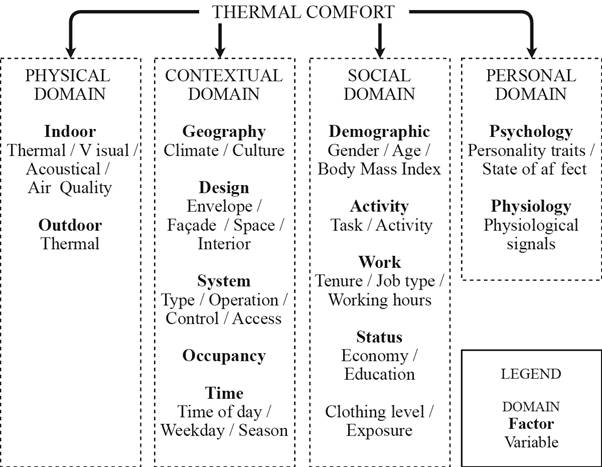
Figure 1. Physical, social, contextual and personal variables present in literature, adapted from [3].
Existing multi-domain studies identify several variables that are of interest to thermal comfort modelling. A list of main effects and interaction effects that are supported or rejected by existing research on multi-domain thermal comfort in offices is composed [4], leading to the following hypotheses:
M1: Air temperature exerts a positive, exponential, effect on thermal discomfort.
M2: Sound pressure exerts a positive effect on thermal discomfort.
M3: Occupant gregariousness exerts a negative effect on thermal discomfort.
I1: Air temperature exerts a negative effect on the interaction effect between sound pressure level and illuminance on thermal discomfort.
I2: Occupant assertiveness exerts a positive effect on the effect of air temperature on thermal discomfort.
I3: Occupancy count exerts a positive effect on the effect of occupant gregariousness on thermal discomfort.
The aforementioned hypotheses are tested via an explanatory model, using field measurement data. The results are used to train a model that aims to predict whether office employees are experiencing thermal comfort or discomfort. The articulation of the modelling outcome is unprecedented in current literature, covering three physical variables (air temperature, illuminance and sound pressure level), one contextual variable (occupancy count), two personal variables (occupant assertiveness and gregariousness) and one social variable (gender), in the interest of testing whether such a multi-domain approach can aid in a better understanding or prediction of thermal (dis)comfort in offices.
The data was collected prior to this study, in two office buildings in the Netherlands. The cross-sectional campaign was conducted during the years 2015-2018. The applied measurement protocol is described in a publication by Brink and Mobach [5]. The data points used in this study are limited to the warmer months of June and July 2016. 623 office employees participated in the measurements. The final sample size is equal to 522. The data consists of objective and subjective measurements.
Explanatory modelling is performed via structural equation modelling (SEM); a covariance-based technique that enables the inclusion of observable and unobservable variables. Visualization is done using standard LISREL matrix notation [6]. The computation is performed via the ‘lavaan’ package [7].
Table 1 provides an overview of the variables used, along with their notation. Variables Tin, SPL, E and Nocc are continuous. Variables a1 − a2 and g1 − g4 are ordinal. All variables are normalized using min-max feature scaling. To account for multivariate non-normality, robust diagonally weighted least squares (DWLS) estimation, known as weighted least square mean and variance adjusted estimation (WLSMV) in ‘lavaan’ package, is used to compute the parameter estimates, robust standard errors and fit indices.
Table 1. Direct and indirect effects included in the SEM model.
Effect | Domain | Symbol | SEM | Variable | Range [unit] |
Direct | Physical | expTin | x8 | Air temperature | 20 – 26 [°C] |
SPL | x9 | Sound pressure level | 40 – 70 [dB(A)] | ||
E |
| Illuminance a | 0 – 2,000 [lx] | ||
Personal | g1 | x1 | Gregariousness |
| |
g2 | x2 | Gregariousness |
| ||
g3 | x3 | Gregariousness |
| ||
h1 | y1 | General body discomfort |
| ||
h2 | y2 | Lower body discomfort |
| ||
h3 | y3 | Upper body discomfort |
| ||
Indirect | Physical | SPL · E · Tin | x10 | Sound, illuminance and temperature |
|
Physical and personal | Tin · a1 | x4 | Temperature and assertiveness |
| |
Tin · a2 | x5 | Temperature and assertiveness |
| ||
Contextual and personal | Nocc · g1 | x6 | Occupancy count and gregariousness | Nocc < 20 | |
Nocc · g4 | x7 | Occupancy count and gregariousness | Nocc < 20 | ||
a The direct effect of illuminance is excluded but illuminance is used to compute SPL · E · Tin. | |||||
The predictive model takes the form of a binary classifier that predicts whether a participant is experiencing thermal comfort or discomfort. The variables included in the model are listed in Table 2.Two linear and two non-linear classification algorithms are selected and trained using the scikitlearn Python library [8]. Po is used for linear algorithms, while P1 is used for non-linear algorithms, as the latter are expected to capture non-linear relationships. The linear algorithms are logistic regression (LR) and linear support-vector machine (L-SVM), while the non-linear algorithms are random forest ensemble (RF) and non-linear support-vector machine that uses the radial basis function kernel (RBF-SVM). During the testing phase, the models are retrained on 308 observations, comprising the training and validation sets, and are tested on the remaining 77 observations. Common metrics such as the F1-score, accuracy (ACC) and the area under the ROC curve (AUC) are used.
Table 2. Variables used for prediction.
Variable | Symbol |
Indoor temperature exponent | Po |
Indoor temperature | P1 |
Sound pressure level | P2 |
Sound × illuminance × temperature | P3 |
Gregariousness × occupancy count | P4 |
Gender | P5 |
The outcome of the explanatory modelling phase is a SEM model. Figure 2 shows the parameter estimates, variance/covariance estimates and factor loadings for the explanatory model. The parameter estimates are also shown in Table 3. The exponent of air temperature x8 is expected to have a positive effect on thermal discomfort η1. According to the results, the effect of x8 on η1 is positive (see Figure 2) and significant at 99.9% confidence (z > 3.09, p < 0.001). Sound pressure level x9 is expected to exert a positive effect on η1. The main effect of sound pressure level x9 is found to be positive and significant at approximately 98% confidence (z > 2.33, p < 0.02).
Table 3. Parameter estimates for the thermal comfort variables included in the SEM model.
| Estimate | SE | z | P(<|z|) |
x8 | 0.643 | 0.203 | 3.177 | 0.001a |
x9 | 0.357 | 0.151 | 2.368 | 0.018b |
x10 | −0.383 | 0.196 | −1.951 | 0.051c |
ξ1 | −0.128 | 0.174 | −0.736 | 0.462 |
ξ2 | 0.104 | 0.382 | 0.272 | 0.785 |
ξ3 | 0.394 | 0.198 | 1.988 | 0.047c |
a CI – 99.9%. b CI – 98%. c CI – 95%. | ||||
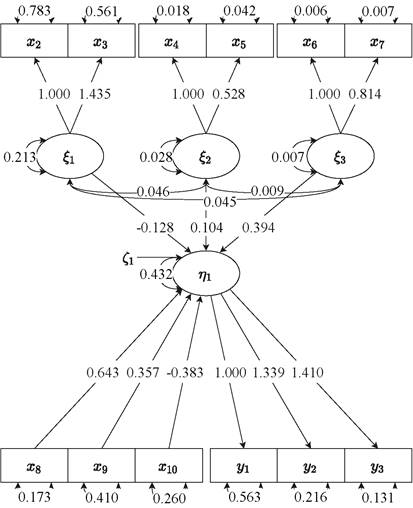
Figure 2. Graphical representation of model estimation.
The interaction between indoor temperature, sound pressure level and illuminance x10 is expected to exert a negative effect on η1, such that an increase in indoor temperature will result in a decreased audio-visual influence. The parameter estimate for the three-way interaction x10 is found to be negative and significant at 95% confidence (z > 1.96, p < 0.05). Gregariousness x1 is expected to exert a negative effect on η1. The effect of x1 on η1 is found to be negative but it is not found to be significant. The interaction between assertiveness and indoor temperature x2 is expected to be positive, to the extent that an increase in temperature will result in an increased influence of assertiveness on η1. The two-way interaction x2 is found to be positive but it is not found to be significant. The interaction between gregariousness and occupancy count x3 is expected to be positive, such that an increase in occupancy count will result in an increased influence of gregariousness on η1. The two-way interaction x3 is found to be significant at approximately 95% confidence (z > 1.96, p < 0.05). As a result, hypotheses M1, M2, I1 and I3 are not rejected.
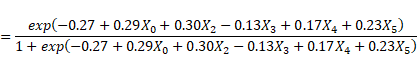
The outcome of the predictive modelling phase are four models; LR, L-SVM, RF and RBF-SVM. LR is fitted as shown in equation (1). The polarity of the parameter estimates is consistent with hypotheses M1, M2, I1 and I3, suggesting the model learned a similar pattern to the one captured using SEM.
| (1) |
The performance metrics for the validation and testing phases are reported in Table 4. The difference in performance across the models is very slight and all four models yield similar scores across all three metrics. While L-SVM and RF show better ACC and weighted F1 on the validation set, they no longer outperform the other models on the test set. The increase in ACC during the testing phase for all four predictive models could be attributed to random variation between data splits. The predictive performance of the models is just above random guessing (= 0.50) and is not sufficient for predicting thermal (dis)comfort.
Table 4. Performance metrics (validation and testing).
Model | Set | AUC | ACC | F1 |
LR | Valid | 0.58 | 0.56 | 0.53 |
Test | 0.68 | 0.56 | 0.56 | |
L-SVM | Valid | 0.58 | 0.61 | 0.61 |
Test | 0.67 | 0.55 | 0.55 | |
RF | Valid | 0.62 | 0.60 | 0.60 |
Test | 0.64 | 0.58 | 0.59 | |
RBF-SVM | Valid | 0.57 | 0.52 | 0.48 |
Test | 0.66 | 0.57 | 0.58 |
The interpretation of the SEM model addresses the hypotheses M1− M3 and I1− I3. The model estimates do not reject M1, M2, I2 and I3, leading to several implications that may be of interest to the understanding of thermal comfort in offices:
· During the cooling season, an increase in indoor temperature results in an exponential increase in thermal discomfort.
· An increase in sound pressure level results in an increase in thermal discomfort.
· An increase in air temperature decreases the effect that the interaction between sound pressure level and illuminance has on thermal discomfort, resulting in a negative three-way interaction.
An increase in occupancy count increases the effect of occupant gregariousness on thermal discomfort, resulting in a positive two-way interaction.
The results support the notion that the model may be used to explain thermal comfort. However, the existence of a near-equivalent model is likely. The reliability of the subjective data, particularly assertiveness and gregariousness, is questionable. A better fit may be achieved via the use of a more extensive and well-known scale, such as the IPIP-NEO-120 [9].
The SEM model suggests that Po−P5 significantly affect thermal comfort in offices. Yet, the four predictive models are not capable of adequately predicting thermal (dis)comfort. Looking at all four outcomes, the quality of the data may have introduced noise, masking the patterns necessary for making reliable predictions. However, real-world data is noisy and constitutes a pitfall for even the most prevalent models. A predictive model can be expected to perform even worse in practice than it does on the mother data set. The results show that thermal comfort is a complex, multi-domain construct that is difficult to predict. However, the performance of the four predictive models does not cast a definitive shadow over the prospect of accurate prediction. Predictive models that include a larger number of thermal comfort variables and higher quality subjective measurements may yield better predictions. Moreover, other, more advanced modelling techniques, such as stochastic modelling, may be better suited for thermal comfort prediction.
This study applies the multi-domain approach to thermal-comfort modelling. An explanatory model is constructed using SEM. The specified model examines the influence of indoor temperature, illuminance, sound pressure level, occupancy count, gregariousness and assertiveness on thermal discomfort. The SEM model is unique, as it is the first explanatory model, derived from field measurements, to include multiple physical and personal variables, while also including contextual variables. The following conclusions are derived from the explanatory model:
· Thermal discomfort increases at higher indoor temperatures and higher sound pressure levels, suggesting that both should be optimized and maintained.
· Uncomfortably high indoor temperatures decrease the effect that sound pressure level and illuminance otherwise have in a comfortable thermal environment. This highlights the importance of designing for optimal temperature conditions and constitutes a basis for the use of personalized strategies.
Gregarious individuals may be more thermally comfortable than non-gregarious individuals when there are many occupants in the room. Designers are encouraged to account for inter-individual differences by providing flexible working conditions.
Four predictive models LR, L-SVM, RF and RBF-SVM are trained using significant variables Po−P5. The models examine the predictive potential of the explanatory model. All models struggle to predict thermal (dis)comfort, despite the inclusion of significant thermal comfort variables. The results bring to light several conclusions:
· Significant thermal comfort influences are not always adequate predictors thereof.
· Researchers are advised to precede future thermal comfort studies with explanatory modelling, to facilitate the creation of predictive models that contain a large variety of variables.
Combined use of explanatory and predictive modelling is necessary, to test whether variables considered in thermal comfort research hold theoretical relevance, predictive potential, both or, perhaps, neither.
This study is part of a broader research effort to achieve better prediction of thermal comfort in offices, which is an essential step in the building design process. The results formulate a basis for further research on the influence of indoor climate, occupancy and personality traits on thermal comfort in offices, as well as the interaction between the different influences. Moreover, the findings have direct implications for the engineering sector, as they suggest that influences such as sound pressure level, occupancy and personality traits, should be considered when designing for optimal thermal conditions.
This research is subject to several limitations, the mitigation of which is encouraged in the future. Firstly, prominent variables such as correlated colour temperature and air velocity are not included in the study. Similarly, variables such as age, relative humidity, clothing insulation and metabolic rate are excluded due to insufficient variability in the measured data. Secondly, extreme indoor conditions are not observed during field measurements. In addition, the measurements are limited to summer conditions in the context of the Netherlands and are not representative of cooler conditions or other climate regions. Due to this limitation, the relationship between temperature and thermal discomfort is assumed to be exponential. Future studies are encouraged to include cold sensation data and thereby model a parabolic relationship between temperature and thermal discomfort, where thermal discomfort increases at lower and higher temperatures both. Thirdly, the internal consistency of the personal variables is poor and they are not sufficiently representative of the Big Five personality traits. Lastly, the quality of the predictive models may be improved via the use of advanced hyper-parameter tuning, a larger variety of machine learning algorithms and more advanced modelling methods.
The data is provided by the research group of Mark Mobach at the Hanze University of Applied Sciences. The authors acknowledge the contribution of Yasin Toparlar, Deerns Groep B.V.
[1] ANSI/ASHRAE. Standard-55-2017 Thermal Environmental Conditions for Human Occupancy. 2017.
[2] Van Hoof J. Forty years of Fanger’s model of thermal comfort: Comfort for all? Indoor Air. 2008; 18: 182–201.
[3] Schweiker M., Ampatzi E., Andargie M. S., Andersen R. K., Azar E., Barthelmes V. M., Berger C., Bourikas L., Carlucci S., Chinazzo G., Edappilly L. P., Favero M., Gauthier S., Jamrozik A., Kane M., Mahdavi A., Piselli C., Pisello A. L., Roetzel A., Rysanek A., Sharma K., Zhang S. Review of multi-domain approaches to indoor environmental perception and behaviour. Build. Environ. 2020.
[4] Mamulova E., A Multi-Domain Approach to Thermal Comfort in Office Buildings. Master thesis. Eindhoven University of Technology, Eindhoven, The Netherlands. 2021. https://pure.tue.nl/ws/portalfiles/portal/167630476/Mamulova_1371118_BPS.pdf
[5] Brink H. W, Mobach M.P., Quality and satisfaction of thermal comfort in Dutch offices. Proc. 15th EuroFM Res. Symp. 2016; 162-171.
[6] Newsom J. LISREL Matrix Notation. 2012.
[7] Rosseel Y. lavaan: An R Package for Structural Equation Modeling. J. Stat. Softw. 2012: 48.
[8] Pedregosa F., Varoquaux G., Gramfort A., Michel V., Thirion B., Grisel O., Blondel M., Prettenhofer P., Weiss R., Dubourg V., Vanderplas J., Passos A., Cournapeau D., Brucher M., Perrot M., Duchesnay E. Scikit-learn: Machine learning in Python. J. Mach. Learn. Res. 2011; 12: 2825–2830.
[9] J. A. Johnson J. A. Measuring thirty facets of the Five Factor Model with a 120-item public domain inventory: Development of the IPIP-NEO-120. J. Res. Pers. 2014; 51: 78–89.
Full article: https://proceedings.open.tudelft.nl/clima2022/article/view/181
Follow us on social media accounts to stay up to date with REHVA actualities
0