


Stay Informed
Follow us on social media accounts to stay up to date with REHVA actualities
|
|
|
R. Gritzki | C. Felsmann | M. Rösler |
TU Dresden | TU Dresden | TU Dresden |
|
|
|
|
|
|
A. Gritzki | M. Iivonen | J. Naumann |
BAuA, formerly TU Dresden | Purmo Group | GWT-TUD, Dresden |
Forced by the increased use of renewable energies, there is a need to lower the temperature level of space heating systems and heating networks. Lower water temperatures in heating systems again require larger heat emitting surfaces. Consequently, part load operating conditions with very large temperature spreads at very low mass flows can be observed more frequently. These situations also occur in district heating networks. Experiments at typically used radiator types with convection plates performed by the authors showed, that the heating power in case of reduced mass flow rates (below 30% of the design flow rates) is considerable higher than the heat output reported by the manufacture’s submittal predicted based on the calculation approaches according to EN 442-2 [1]. This effect is in contrast to previous investigations of the part load behaviour of radiators. In [2] and [3] for example the authors assume a reduction of the heat output in case of lower mass flow rates and not an increase.
In order to be able to physically substantiate and mathematically describe the effect detected by means of first measurements, detailed additional measurements of the heat output of different radiator types were performed as well as detailed numerical investigations in a virtual test cabin. In both cases the studies have been designed according to the specifications in EN 442-2. Specifically, different radiator types with and without convection plates (type 22, type 20 and type 10) such as two tubular radiators (12 sections, two/three tubes) were examined. In case of the heat output measurements the radiator mass flow rates were further reduced up to 20% of the nominal flow rates. In case of the numerical investigations the determination of heat output data was done at much lower mass flow rates (up to 3% of the nominal mass flow).
The results of the investigations show, that in case of radiator type 22 the widely used EN 442-2 approach was not suitable to reliably predict radiator heating power neither in dependency on supply water temperature levels nor for typical mass flow rates. The mismatch was about 10%! In this Part 1 of the article results of both the measurements and the numerical analyses are presented; in Part 2 a new calculation approach is introduced to overcome the mismatch.
Symbols | ||
k | heat transfer coefficient | in W/(m² K) |
Km | radiator model constant | – |
∆Tm, ∆Tar | over-temperature (logarithmic or arithmetic) | in K |
ṁ | mass flow rate | in kg/h |
Q̇ | heat output | in W |
Φ | heat output (EN 442-2) | in W |
Tin | supply temperature | in°C |
Tout | return temperature | in°C |
Tr | room air temperature (control point) | in°C |
cp | specific heat capacity | in J/(kg K) |
∆T | difference supply – return temperature | in K |
Indices | |
N | nominal point / design point |
ar | arithmetic |
ln | logarithmic |
50 | design point (at 50 K over-temperature, EN 442-2) |
A radiator is a water-air-heat exchanger installed in buildings used to provide heat for space heating (see Figure 1).
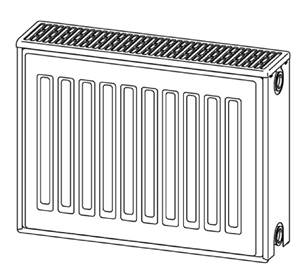
Figure 1. View of radiator with profiled front. [VDI6036]
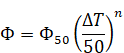
For dimensioning purposes heat output of radiators has to be estimated under steady state conditions to check if it fits with nominal heat load requirements. So far it is assumed that heat output Φ mainly depends on the difference between mean radiator temperature and room temperature (the so-called over-temperature ΔT) and can be calculated according to
| (1) |
where parameters Km and n are derived from laboratory tests accounting for heat transfer mechanisms. Test conditions in terms of supply and return temperature as well as mass flow rate are defined in EN 442-2 and are seemed to be constant, i.e. independent on operating conditions. Once Km and n are known heat output at any operating point can be calculated by referring to a standardized reference point that is set at supply temperature of 75°C, return temperature of 65°C, and over-temperature of 50 K by applying equation
| (2) |
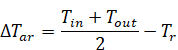
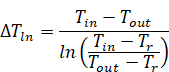
Heat supply mass flow rate through the radiator has to be fixed according to a given temperature difference between supply and return flow to fulfil heat balance at the radiator. Calculation of the over-temperature ΔT can be done in two ways, as arithmetic over-temperature ΔTar or as logarithmic over-temperature ΔTln. In both cases it is assumed that mean radiator over-temperature can be determined simply on the basis of supply and return temperatures Tin and Tout and room temperature Tr.
| and |
| (3) |
Normally radiators are designed for temperature differences (the spread) of about 10…20 K and in this temperature range both calculation approaches are almost equivalent. But in [2] and also in the underlying investigations, it was found that the arithmetic over-temperature is only valid to a limited extent ((Tout − Tr)/(Tin − Tr) > 0.7) and therefore the more general logarithmic over-temperature should be used, especially for larger temperature spreads. In this case the logarithmic over-temperature is a much better representation for the difference between mean surface temperature of the entire radiator, which is relevant for the heat transfer to the environment, and room temperature. Accordingly, the logarithmic over-temperature is used here.
Nowadays there is a trend to increase the temperature spread because heat system operators are interested in getting back a low return temperature (for example in case of district heating). That leads to quite low heat supply flow rates through the radiators not only in part load but also at design conditions. See the following example where a radiator of type 22 (two panels and two convection plates, see Figure 1) with a construction height of 0.4 m and a length of 1.4 m has been analysed. The heat output was measured for the temperature pairing 60-30-20 (radiator supply temperature 60°C, return temperature: 30°C, room temperature 20°C, and it was found heating power of 640 W while a heating power of 554 W was expected according to the EN 442-2 calculations. The measured heat output of the radiator in that operating point is about 15.5% higher! So, it has been shown that the heat output of typical radiators at higher temperature spreads and thus mass flow rates less than 30% of the design is significantly higher than expected from the above given calculations according to EN 442-2 (based on the log. over-temperature), i.e. calculations are not valid anymore.
The higher heat output in these operating points leads to oversized radiators, an unstable control behaviour and tends to increase the room temperatures. From that perspective there is a clear interest to better know if we still can rely on standardized calculation methods and to understand why standardized calculation fails some time.
In a first step measurements of the heat output of different radiator models of type 22 (two panels with two convection plates) with various mass flow rates were carried out at RETTIG ICC. Measurements are done in a climate chamber according to EN 442-2 and deviations between measured and calculated heat outputs have been observed. The main purpose of the studies presented here is to find a physical based explanation for these deviations for radiator heat output, which is also valid in the low partial load range.
To extend the data base for the studies, in addition to the measurements detailed numerical simulations of different radiator types are performed in a virtual test cabin according to the specifications in EN 442-2. The underlying coupled and transient simulation model allows investigations for a very wide range of operating points, especially at very low mass flow rates.
All measurements presented in this section were carried out by RETTIG ICC. During the laboratory testing the radiator heat outputs at several operating points have been measured and the design heat output according to EN 442-2 has been rated including the estimation of parameters Km and n.
Table 1 summarizes data based on measurements following EN 442-2 (sets of three different measurements based on different over-temperatures per rating) for three radiator models and two different mass flow rates per model. The white line in Table 1 always stands for the nominal mass flow rate and the grey one for the reduced mass flow rate. Based on temperatures and corresponding radiator heat output measured, radiator model parameters Km and n have been derived following the EN 442 rules for each operating point. It is remarkable that radiator model parameters vary and depend on test conditions.
Table 1. Temperatures, mass flow rates (measured), model parameters and heat outputs (calculated using exponential approach according to data sheet); radiator type 22.
Radiator type 22 | Measured | Calculated | ||||
Temp. spread for Tin = 75°C | Mass flow rate | EN 442 Radiator model parameters | Predicted Heat output Φ | |||
in mm | in K | in kg/h (%) | Km | n | ∆T = 22 K | ∆T = 50 K |
600 / 1400 | 10 | 189 (100) | 13.7 | 1.30 | 768 | 2240 |
27 | 56 ( 30) | 16.6 | 1.26 | 814 | 2291 | |
900 / 500 | 10 | 96 (100) | 6.4 | 1.32 | 383 | 1134 |
27 | 29 ( 30) | 7.8 | 1.28 | 404 | 1157 | |
300 / 2000 | 10 | 165 (100) | 10.0 | 1.35 | 642 | 1939 |
26 | 55 ( 33) | 14.1 | 1.27 | 721 | 26 | |
Based on equation (1) these parameters than have been used to predict the heat outputs for the operating conditions 75-65-20 (nominal point with over-temperature ∆T = 50 K) and 60-30-20 (∆T = 22 K), see last column of Table 1.
As can be seen from the table the calculated heat outputs vary for the same radiator model in dependence on the mass flow rate. As expected, in most cases the predicted data based on the definitions in EN 442-2 are higher for larger temperature spreads (i.e. lower over-temperatures) caused by small mass flow rates.
This is obviously a result of the parameters Km and n that are assumed to be constant in EN 442 but may depend on mass flow. It shows some interesting tendencies but it does not lead to the solution of the problem. In case of lower mass flow rates Km increases and n decreases. So the heat output deviations are higher if the over-temperatures ∆T are smaller (Φ = Km∙(∆T)n).
The laboratory tests have been modelled in a virtual test cabin to gain more insight into physical phenomena. In this section the used coupled simulation programs, the simulation model of the and essential details of different radiator models are introduced.
The simulation tool is a combination of three highly coupled program parts to assure that all relevant physical and technical aspects for the simulation of radiators are considered. In detail it consists of the thermal building and system simulation code TRNSYS-TUD [4], the indoor air flow simulation code ParallelNS [5], and the commercial CFD-code Ansys Fluent® [6]. Ansys Fluent® is applied for the simulation of the radiator, ParallelNS for the air flow calculation inside of the cabin, and TRNSYS-TUD for the spatial highly resolved radiant heat transfer, the heat conduction of the surrounding surfaces of the cabin, the controlling and the technical equipment, for example the control systems.
Due to the coupling within the transient simulation process these three single codes together result in a very complex simulation tool which is able to satisfy the demands of practical applications, like radiator test chambers. Subsequently the three modules and the coupling algorithm are briefly described.
TRNSYS-TUD is a further development (at TU Dresden) of the commercial building simulation tool TRNSYS® based on version 14.2 and is used in the coupling process as the building and system simulation unit for combined simulations, see [4]. It can communicate with different CFD programs via PVM (Parallel Virtual Machine), in order to get detailed information about the convective heat transfer or about parameters of technical equipment.
ParallelNS is a finite-element research code developed at Göttingen University and Dresden University of Technology. Based on the Reynolds-averaged Navier-Stokes equations for incompressible non-isothermal fluids two turbulence models, a k-e model with special functions for the wall treatment and a j-f-k-e model are used for calculating the effects of turbulence. Moreover, it is possible to consider a wide variety of additional transport equations [7]. The interaction with the thermal building simulation program and with the radiator simulation in Ansys Fluent® is also managed by PVM.
Ansys Fluent® is responsible for the detailed simulation of the radiator parts (radiator shell, convection plates). Due to the ability to handle hybrid mesh types it is possible to model very complex three-dimensional geometries, thus also the interior of multi-section radiators, or very thin convection plates. The coupling with the building simulation was done by means of the implemented user defined functions (UDF). Therefore, the ability to exchange data via PVM was implemented in the UDF-code. For more information see the Ansys Fluent® user manual [5].
The complete coupling algorithm works transient, across the transfer of boundary condition (BC) values at predefined BC interfaces. To ensure a realistic approximation of the interaction among the wall faces of the surrounding walls and the flow field, all the walls are split into a number of such BC interfaces. For the two flow solvers, the BC interfaces are additionally further refined to gain more stability due to the use of mean BC-values. More information about the coupling algorithm can be found in [7] to [9].
The numerical investigations of the heat emission and the thermal behaviour of the different radiator models were performed in a virtual test cabin according to EN 442-2 by means of the coupled building, system and flow simulation described above at different temperature levels and different heating medium mass flow rates. For this purpose, coupled transient simulations of the test cabin with its control loops as well as the cabin air and the thermal behavior of the radiator were carried out for each needed operating point. As result very detailed analyses of the flow and heat conduction processes in and around the radiator models based on water and surface temperatures and their local distributions as well as the evaluation of the heat output (with convective and radiative part) of the radiator models based on different temperature pairings are available.
The modelled test cabin has the overall dimensions of L × W × H = 4 m × 4 m × 3 m, see also Figure 2.
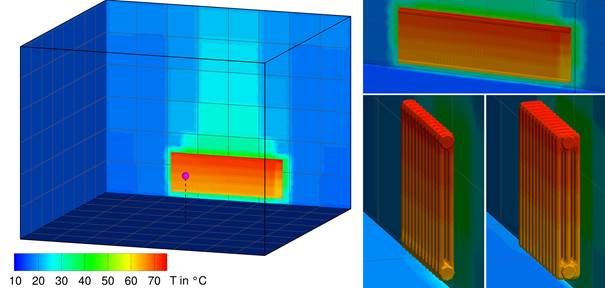
Figure 2. Geometry of the modelled test cabin with radiator and controller location.
The investigated radiator models are, as postulated in [1], located centered in front of the backside of the cabin, 0.11 m above the floor and 0.05 m away from the backside. All walls of the test cabin except the backside are controlled tempered walls. The materials and the wall constructions correspond to the guidelines in [1]. The sensor point for the temperature control (red point) is located in the middle of the test cabin at a height of 0.75 m above the floor. The model of the test cabin is equipped with two different control loops. One loop controls the tempered walls in order to keep the temperature at the measure point at a constant value of 20°C. The other loop controls the water influx against the radiator outflow temperature. The simulations were performed unsteady until steady state conditions were reached.
The radiators and the wall behind them are divided into a large amount of very small “tiles” (up to 7200 BC faces, depending on the complexity of the radiator geometry). This way their real geometry and their real physical behavior, especially in respect to the radiant and the convective heat transfer and the temperature distribution are reflected. The mesh resolution of the air flow simulation in the cabin varies from 1.0 to 1.3 million elements, dependent on the specific radiator type.
In the underlying investigations up to now six radiator models were considered. Figure 3 shows the outer surfaces of the investigated radiators along with their temperature distributions in the steady state for the temperature pairing 75-35-20. In all cases the water inflow is located at the upper right side while the outflow is located at the same lower side (view from the centre of the cabin).
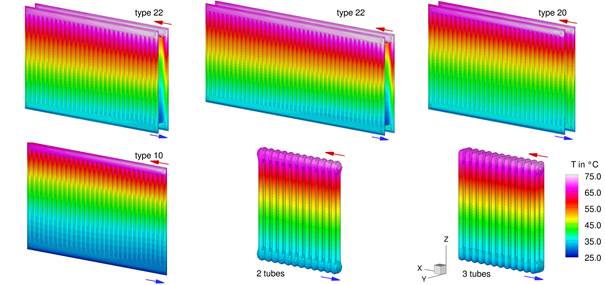
Figure 3. Geometries of the six radiator models along with their temperature distributions in the steady state, temperature pairings 75-35-20.
In detail the following six radiator types, each one of a height of 0.6 m were modelled:
· two radiators of type 22, different lengths, two layers and two convection plates, (upper left and upper middle) length: 1.0 m and 1.4 m, depth: 0.102 m, heat output: 1709 W/m, radiator resolution: up to 3.6 million elements, up to 7200 BC-interfaces,
· one radiator of type 20 with two layers and without convection plate, (upper right) length: 1.0 m, depth: 0.015 m, heat output: 1085 W/m, radiator resolution: 1.7 million elements, 4100 BC-interfaces,
· one radiator of type 10 with one layer and without convection plate, (lower left) length: 1.0 m, depth: 0.015 m, heat output: 639 W/m, radiator resolution: 0.7 million elements, 2050 BC-interfaces,
· one tubular radiator with 2 tubes and 12 sections, (lower middle) length: 0.54 m, depth: 0.065m, heat output: 564 W, radiator resolution: 0.69 million elements, 3700 BC-interfaces and
· one tubular radiator with 3 tubes and 12 sections, (lower right) length: 0.54 m, depth: 0.105m, heat output: 781 W, radiator resolution: 1.0 million elements, 4600 BC-interfaces.
First, the simulation model results are compared to the EN 442 approach for different temperature pairings based on the manufactures submittal (over-temperatures at ΔTar=30 K, 50 K, and 60 K). As results of EN 442 approach are communicated in the manufactures submittal they are referred to as catalogue data. (By the way: measurements showed that it is difficult to reach the higher over-temperatures of the radiators (50 K and 60 K) required by EN 442-2 if mass flow rates are low). Furthermore, it has to be mentioned that the logarithmic over-temperature is used for analysis as discussed earlier. That is why results in the diagrams do not exactly fit the standardized data of 60 K, 50 K, and 30 K, respectively (logarithmic over-temperature is 59.44 K, 49.83 K, and 29.72 K instead).
In Figure 4 and Figure 5 exemplary the results of these validations for four of the six investigated radiator types are collected. Heating power data is displayed as bullet point whereas the mass flow is represented by columns. Keep in mind, that heat output mainly depends on over temperature while mass flow depends on temperature spread. As one can see, the simulation results and the catalogue data in all cases are in very good agreement. The differences between the simulated heat output data and the data based on the data sheets in all temperature pairings are less than 2 percent, in most cases even smaller. Taking into account those results it can be concluded, that the numerical models of the radiator types as well as the numerical models of the cabin are very well suited for the investigations of the partial load behaviour that are presented in the following sections.
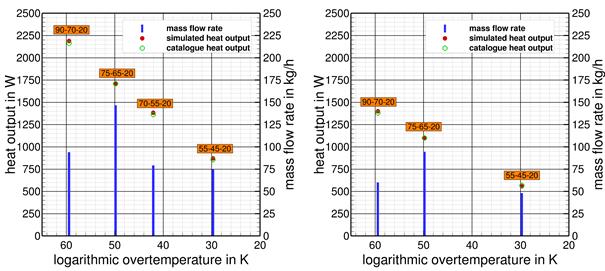
Figure 4. Simulated and catalogue heat output data and mass flow rate of panel radiators (length: 1.0 m) at different typical operation points – left: type 22, right: type 20.
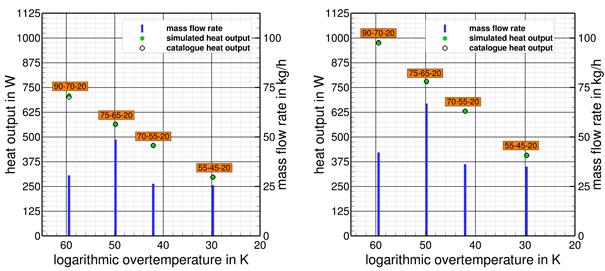
Figure 5. Simulated and catalogue heat output data and mass flow rate of the tubular radiators at different typical operation points – left: two tubes, right: three tubes.
In Figure 6 the surface temperatures at different mass flows and return temperatures for the modelled tubular radiators are displayed.
These diagrams give a good overview of the vertical and horizontal temperature distribution of the radiators. However, it is not possible to say whether the vertical temperature drop is linear or non-linear.
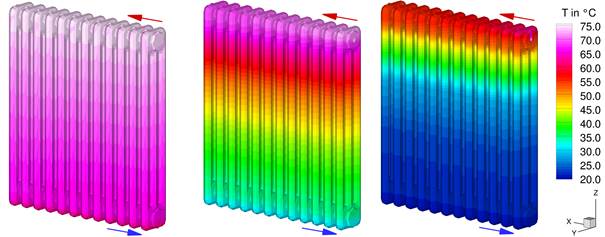
Figure 6. Surface temperatures at different mass flows and return temperatures, tubular radiators with three tubes – left: 75-65-20, middle: 75-35-20, right: 75-21-20.
Based on the validated radiator models now the impact of reduced mass flow rates on the heat output of the radiators has been analyzed. The studies were done for three different supply temperatures, 90°C, 75°C and 55°C. In this section the results for the supply temperature 75°C are discussed as this a representative case and the behavior of the radiator models is in principle similar for other supply temperatures.
Mass flow rate through the radiator has been reduced and subsequently the difference between supply and return temperature increases. In Figure 7, the calculated heat output data and the mass flow rates of the two panel radiators with convection plates in dependence on that temperature difference between supply and return temperature is displayed and compared to the catalogue data based on the logarithmic over-temperature ΔTln and the standardized reference point. In addition, the diagrams also show the results predicted by the exponential approach according to EN 442 based on the arithmetic over-temperature ΔTar. Each discrete dot represents one simulation with its specific constant mass flow rate needed to match the return temperature.
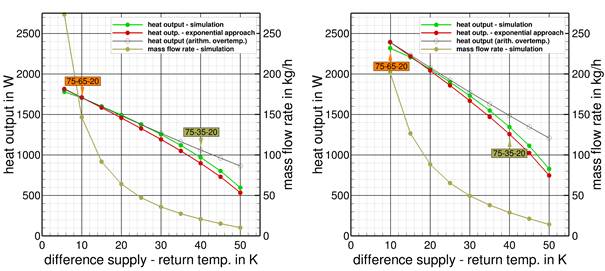
Figure 7. Simulated (green) and catalogue heat output data based on exponential approach (red/gray) at constant supply temp. of 75°C and changed mass flow rates, panel radiators with convection plates, type 22 – left: 1.0 m length, right: 1.4 m length.
The results clearly show now the mismatch between the simulation results and the catalogue data when mass flow rates differ from the standardized reference flow. The heat output data expected by the digital twin of the radiator are up to 10% higher than the data predicted by the exponential approach according to EN 442. This is according to the measurement results presented in Table 1. If the arithmetic over-temperature is used, the mismatch is even more pronounced. It clearly shows that the EN442 approach is valid only for operating conditions similar to the standard but should be applied with care when the radiator is operated in part load (at lower flow rates).
The performance of six different radiator models has been analyzed using a digital twin. Various supply temperatures and mass flow rates were taken into account resulting in about 150 simulation runs.
The heat output results of the simulated radiators under reference conditions (taken from the manufacture’s catalogue data) were in all cases in very good accordance to the design data in the data sheets. Therefore, the simulation models are very well-suited to further investigate the impact of different mass flow rates on the heat output of radiators.
In case of commonly used radiator type 22, measurements and simulations generate higher heat outputs (up to approx. 10%) than compared to the catalogue data based on the logarithmic over-temperature ΔTln and the standardized reference point. This applies to all supply temperature levels already in the range of typical mass flow rates. It is assumed that convection plates will have an impact because radiators without such devices may not show any mismatch. More details on this are given in Part 2 of the article.
[1] EN 442-2. 2014. Radiators and convectors – Part 2. Test methods and rating. Beuth Verlag, Berlin.
[2] H. Bach, D. Schlapmann. 1977. Effektive Übertemperatur zur einheitlichen Darstellung der Wärmeleistung von Raumheizkörpern. Ki 10/77, Teil 6, S. 592-597.
[3] Knabe G. 1992: Gebäudeautomation. Verlag für Bauwesen Berlin, München.
[4] Perschk, A. 2010. Gebäude- und Anlagensimulation – „Ein Dresdner Modell“. GI Gesundheitsingenieur / Haustechnik / Bauphysik / Umwelttechnik, Bd. 131, Nr.4.
[5] ParallelNS user’s guide: University of Göttingen / Technical University of Dresden 2001.
[6] Ansys Fluent Inc. 2019. Ansys Fluent User’s guide for Fluent. Release 19.0.
[7] Gritzki, R, Richter, W, Rösler, M. 2003. How to predict the air exchange efficiency for hybrid ventilation systems. Int. Journal of Ventilation, Vol.1, HybVent SE:33-39.
[8] Gritzki, R., Perschk, A., R., Rösler, M., Richter, W. 2009. Modeling of Heating Systems and Radiators in Combined Simulations. Proceedings of Clima 2007 WellBeing Indoors, 2007.
[9] Gritzki, R., Perschk, A., R., Rösler, M., Richter, W. 2009. Gekoppelte Simulation zur Spezifikation von Heiz- und Kühlkörpern. Bauphysik Heft 1, 2009.
Follow us on social media accounts to stay up to date with REHVA actualities
0