
Stay Informed
Follow us on social media accounts to stay up to date with REHVA actualities
|
Özgür Küçükhüseyin |
Testo Sales DirectorClimate Product Management – Testo SE & Co. KgaA, Turkeyokucukhuseyin@testo.com.tr |
Carbon dioxide is a colourless and odourless gas. It is a natural component of ambient air, at a concentration of around 400 ppm (parts per million). CO₂ is formed during the complete combustion of carbonaceous substances with sufficient oxygen supply. In the organisms of living creatures, it is formed as a metabolite of cell respiration. [1] At higher concentrations upwards of 1000 ppm, significant negative effects on the general well-being can occur (headaches, fatigue, lack of concentration). [2]
Carbon dioxide is produced in the body’s cells (at quantities of 0.7 kg per day) and diffuses from there to the surrounding capillaries. It is transported in the blood after chemically binding onto proteins such as haemoglobin, or in dissolved form. CO₂ is largely physically dissolved, only a small part is converted by carbonic anhydrase in the red blood corpuscles into carbonic acid which disintegrates into hydrogen and hydrogen carbonate ions in the aqueous environment. The carbon dioxide is exhaled via the alveolar membrane of the lung. A crucial physiological function of the carbon dioxide in the organism consists in its regulation of breathing via the chemical receptors of the aorta and the medulla oblongata, which stimulate the respiratory centre in the brain stem. Increased CO₂ concentrations in inhaled air increase the breathing frequency and the tidal volume. During this process, CO₂ has a dilatory effect on the bronchia, which causes an increase in the dead space volume (the space in the respiratory system which is not involved in gas exchange). However, the dilatory effect of the CO₂ on peripheral and central arterioles does not lead to a decrease of blood pressure, since an increased adrenalin production causes a compensatory vasoconstriction. [3]
Concentration | Effect |
350 to 450 ppm | Typical atmospheric concentration |
600 to 800 ppm | Reliable indoor air quality |
1 000 ppm | Upper range of reliable indoor air quality |
5 000 ppm | Maximum workplace concentration over 8 hours |
6 000 to 30 000 ppm | Critical, only short-term exposure |
3 to 8% | Increased breathing frequency, headaches |
> 10% | Nausea, vomiting, loss of consciousness |
> 20% | Rapid loss of consciousness, death |
Fig. 1. Effect of different CO₂ concentrations. | |
CO₂ is viewed as a leading parameter for human-induced air pollution, since the increase of indoor CO₂ concentration correlates well with the increase of the intensity of odours arising from human metabolism. The CO₂ content of the indoor air is thus a direct expression of the intensity of a room’s use. It is therefore also suitable as an orientation marker for other areas of regulation such as for the dimensional planning of ventilation and air conditioning systems or for ventilation instructions in naturally ventilated, densely used rooms such as schoolrooms or assembly rooms. [4]
In indoor spaces which are in use, the CO₂ concentration depends mainly on the following factors:
· Number of persons in the indoor space, space volume
· Activity of the indoor space’s users
· Duration spent by the users in the indoor space
· Combustion processes in the indoor space
· Air exchange and outer air volume flow
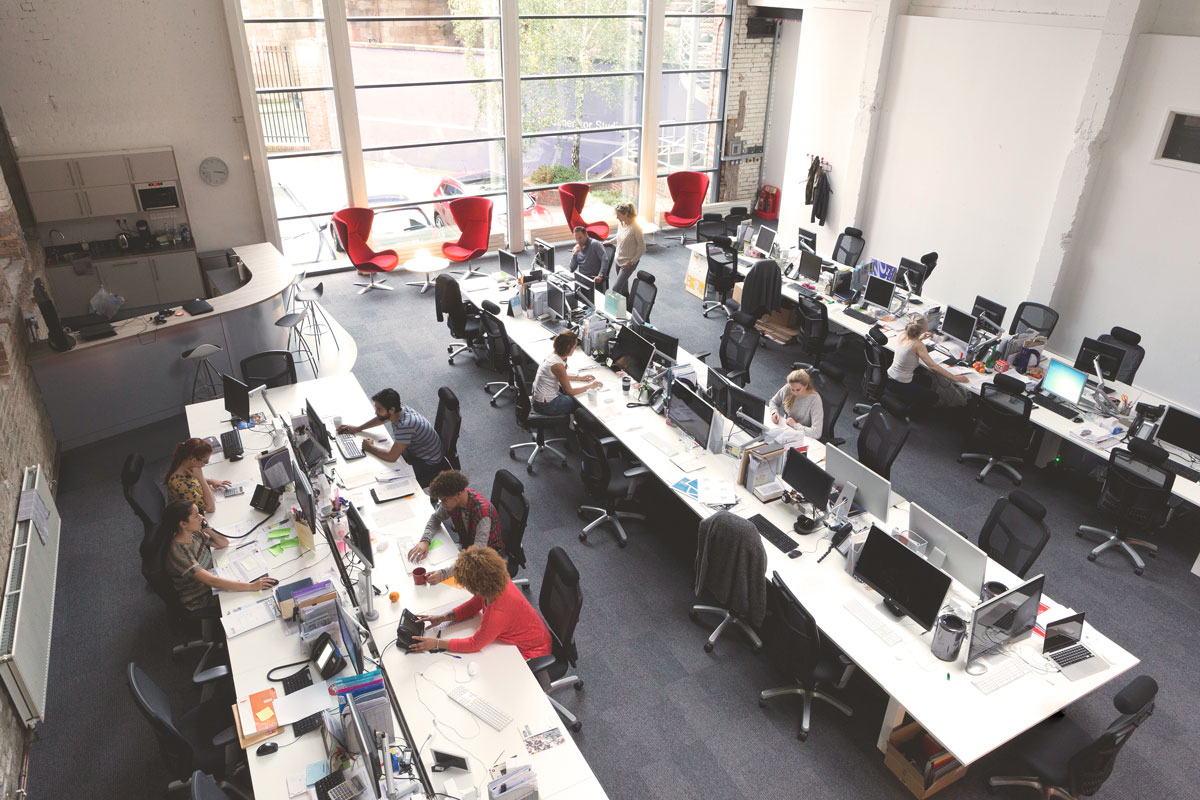
A rapid increase of CO₂ concentration in the indoor air is the typical consequence of the presence of many persons in relatively small spaces (e.g. assembly, conference or schoolrooms) with a low air exchange rate. Critical CO₂ concentrations generally occur together with other air contamination factors, in particular odorous substances from sweat or cosmetics, as well as microorganisms. In airtight constructions with their very low air exchange rates, the CO₂ concentration can increase even in the presence of only a few people (e.g. in apartments or offices). In both cases, the CO₂ has a direct influence on how comfortable people in feel in a room. The European Collaborative Action (ECA) has arrived at the following levels of dissatisfaction based on model calculations. From 1 000 ppm, around 20% of room users can already be expected to be dissatisfied, rising to approximately 36% at 2000 ppm. [5]
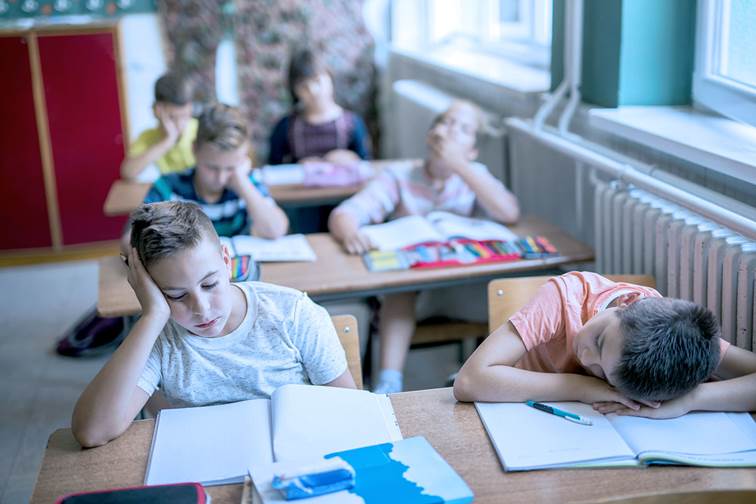
While assembly or conference rooms are as a rule only used occasionally and for short periods, schoolrooms, in the light of the regular presence of students and teachers over hours, must be viewed as particularly critical regarding the CO₂ concentration in the classroom air. Current and past studies in several German states on the carbon dioxide contamination of indoor air in schoolrooms have consistently demonstrated considerable deficits in indoor air quality regarding this parameter. [6]
The CEN EPB standard EN 16798-1:2019 Energy performance of buildings - Ventilation for buildings - Part 1: Indoor environmental input parameters for design and assessment of energy performance of buildings addressing indoor air quality, thermal environment, lighting and acoustics - Module M1–6 [7] provides in the informative Annex B values for ventilation rates. In B3 of this annex you the basis for the criteria for indoor air quality and ventilation rates is presented. Values and classifications presented in the tables in B3 are not limited to the pollution level due to persons but also due to the emission of building materials.
150 years ago, the German chemist and hygienist Max von Pettenkofer had already indicated “bad air” as a negative influence after longer stays in living quarters and teaching institutions, and identified carbon dioxide as the most important leading component for the evaluation of indoor air quality. He set 0.1 vol% (= 1000 ppm) as a standard for indoor CO₂ – the so-called Pettenkofer number, which was the valid guideline for a long time. The first signs of impaired well-being, such as headaches, fatigue and lack of attentiveness start to show upwards of this concentration. [9] |
|
Fig. 2. Max von Pettenkofer. |
The outer air volume flow or ventilation rate describes the volume of the flow (in ℓ/s or m³/h) of external air into a room or a building, either through the ventilation system or by infiltration through the building shell.
For rooms which are intended for human presence, the required external air volume flows are stated with reference to people, i.e. ℓ/s per person or m³/h per person. The air exchange rate (n in 1/h) is the quotient from the air input volume flow in m³/h and the room volume in m³.
An indoor climate is perceived to be comfortable when the temperature is between 20 and 23°C and the air humidity between 30 and 70%RH. However, a maximum of 50%RH is recommended for those allergic to house dust mites. Occasional checks using an officially calibrated hygrometer are to be recommended in this case. Air flows in rooms should not exceed values of 0.16 m/s (in winter) and 0.25 m/s (in summer), depending on the season.
When entering a room in which people are present, there is sometimes an impression of “used-up air”. This can be traced to exhaled carbon dioxide, water vapour and emitted body odours. [8]
The ventilation traffic light is useful for a modern evaluation of CO₂ level in indoor air (Fig. 3).
| Carbon dioxide concentration (ppm) | Ventilation traffic light | Hygienic | Recommendations |
Concentrations under 1000 ppm carbon dioxide in
indoor air: | < 1000 | Green | Hygienically uncritical | No further measures |
Concentrations 1000 and 2000 ppm: | 1 000 to 2 000 | Yellow | Hygienically | Ventilation measures (increase external air quantity/air exchange). Check and improve ventilation behaviour |
Concentrations over 2000 ppm: | > 2 000 | Red | Hygienically | Check ventilation options of room. Check possible further measures |
Fig. 3. Evaluation of CO₂ level in indoor air with the ventilation traffic light. [10] | ||||
The term “sick building syndrome” (SBS) can be read two ways. On the one hand, it refers to buildings which make their inhabitants sick as they work, and on the other hand, the buildings themselves are described as “sick”.
The cause of sick building syndrome is usually air conditioning or insufficient air hygiene in buildings. There is a broad spectrum of symptoms, including the following: Irritations of the eyes, nose and throat; a perception that the mucus membranes and the skin are drying out; mental fatigue; frequent respiratory infections and coughing; hoarseness, shortness of breath, itching and non-specific hypersensitivity.

An American study in buildings with air conditioning and ventilation systems was able statistically to demonstrate significant, positive correlations between complaints such as dryness in the throat and irritations of the mucus membranes, and the increase of CO₂ concentrations, even in concentration ranges below 1 000 ppm absolute.
More recent studies have shown that the costs for remedying problems arising from an unfavourable indoor climate are often higher for the employer, the building owner and society than the energy costs of the affected building. It has also been proven that a suitable indoor climate quality can improve total performance at work and study, while lowering absentee rates. [11]

In Germany alone, there are 34 000 general education schools and 10 000 professional training schools. Accordingly, the monitoring of CO₂ is of special significance here. Outdoor air contains an average carbon dioxide component of 400 ppm. [12]
In a classroom, this proportion increases just though the air breathed by students and teachers in one class period to over 1 500 ppm, and after 90 minutes, values of 2 700 ppm have been measured. In the end, this leads to increased fatigue and decreasing attentiveness – symptoms which are direct obstacles to learning and teaching. [13]
A study from the USA concludes that the CO₂ concentration in classrooms has a direct influence on student attendance. An increase of 1 000 ppm CO₂ leads to an increase of absenteeism by 10 to 20%. According to another study, every 100 ppm increase of CO₂ reduces the annual attendance of students by 0.2%. [14] It has also been established that raising the ventilation rate can lower absenteeism due to illness by 10 to 17%. [15]
CO₂ therefore influences attendance in the schools surveyed. However, the extent of this influence remains unclear. Not least because the individual circumstances in the schools need to be considered.
With the introduction of the Energy Saving Bill in Germany in 2002, (revised in 2007), all those involved in the refurbishment of school buildings are facing new challenges. The building shell and the windows are consciously being made airtight, to fulfil the energy stipulations. In cases of insufficient ventilation, the downside of this can be an accumulation of chemical and biological substances in the indoor air. [16]
Although the carbon dioxide problem in rooms with many people has long been known, convincing solutions have hitherto not been found in the education sector. At the same time, there is no clearly regulated responsibility as to when and by whom the classroom windows are to be opened, especially in the winter months. The consequences are, as expected, high to very high CO₂ values (3000 ppm and more). This also has a direct effect on the risk of infection in schools: Where there is much CO₂, a particularly large number of germs are also to be found. [17]
In 2003, for example, the American scientists Rudnick and Milton studied the risk level of flu infection in a classroom. 30 people were present in a classroom for four hours, one person was suffering from acute influenza. The result: At 1 000 ppm CO₂, five people were infected, at 2 000 ppm there were twelve, and at 3 000 ppm, even 15. [18]
The current situation in many schools shows that in some places, the instruction to ventilate regularly and intensively is not enough to manage the CO₂ problem. Technological ventilation measures become unavoidable, to achieve a user-dependent and permanent air quality with low CO₂ concentrations. [19]
In Germany and Europe, there are no comprehensive legally binding regulations for quality requirements regarding indoor air. Instead, several evaluation values exist, which are called guide values, orientation values or target values, for example. In Germany, a CO₂ value of 0.15 vol% (= 1 500 ppm) applies as a hygienic guide value according to DIN 1946 Part 2. The indoor guide values for CO₂ were published by the Indoor Air Hygiene Commission (IRK) of the Federal Ministry of the Environment and the State Health Authority. [20]
Several neighbouring countries have published guidelines and recommendations for the ventilation of buildings, including schools, which include stipulations for the limitation of CO₂ concentrations in indoor air. In Finland, the maximum permitted CO₂ concentration in indoor air under usual weather conditions and when the room is in use is 1 200 ppm. The Norwegian and Swedish guidelines fix a maximum CO₂ concentration of 1 000 ppm for living rooms, schools and offices. In Denmark, according to the Work Protection Authority guideline, the carbon dioxide concentration in children’s day care centres, schools and offices should not exceed 1 000 ppm. The air exchange is described as insufficient when the CO₂ concentration exceeds the value of 2 000 ppm several times a day for a short time. [21]
At workplaces which are subject to the stipulations of the Dangerous Substance Directive (German TRGS 900) a workplace limit value of 5 000 ppm CO₂ applies.
There are three possibilities available for the measurement and monitoring of carbon dioxide in indoor rooms:
Portable and suitable for long-term measurements, they measure the CO₂ content quickly and precisely.
Measure temperature and humidity without interruption, in addition to CO₂. Measurement values are transmitted by wireless LAN to the Cloud, allowing alarm notifications of limit value violations by e-mail or SMS. The easily visible air quality traffic light also ensures that the responsible people see the indoor air quality status immediately.
In addition to CO₂, they measure all other ventilation and air conditioning parameters such as air flow velocity, temperature, humidity, turbulence level, CO or lux.
[1] Bundesgesundheitsbelehrung, Gesundheitsforschung-Gesundheitsschutz des Umweltbundesamtes 2008, Gesundheitliche Bewertung von Kohlendioxid in der Innenraumluft, Springer Medizin Verlag Ergonomic Institut für Arbeits- und Sozialforschung, page 1358.
[2] Müller-Limroth (1977): quoted in Luftqualität in Innenräumen (1997). Bundesamt für Umwelt, Wald und Landschaft, Schriftenreihe Umwelt Nr. 287, quoted in Komfortlüftung.at gesund & energieeffizient, Physikalische Faktoren Kohlenstoffdioxid als Lüftungsparameter, Aktualisierte Fassung August 2011, authors (Dipl.-Ing. Dr.Rolf Boos, Dipl.-Ing. Bernhard Damberger, Dipl.-Ing. Dr.Hans-Peter Hutter, Univ.-Prof. Dr. Michael Kundi, Dr.Hanns Moshammer, Dipl.-Ing. Peter Tappler, Dipl.-Ing. Felix Twrdik, Dr. Peter Wallner), http://www.komfortlüftung.at/.
[3] Bundesgesundheitsbelehrung, Gesundheitsforschung-Gesundheitsschutz des Umweltbundesamtes 2008, Gesundheitliche Bewertung von Kohlendioxid in der Innenraumluft, Springer Medizin Verlag Ergonomic Institut für Arbeits- und Sozialforschung, page 1362.
[4] Komfortlüftung.at gesund & energieeffizient, Physikalische Faktoren Kohlenstoffdioxid als Lüftungsparameter, Aktualisierte Fassung August 2011, page 6, authors (Dipl.-Ing. Dr.Rolf Boos, Dipl.-Ing. Bernhard Damberger, Dipl.-Ing. Dr.Hans-Peter Hutter, Univ.-Prof. Dr. Michael Kundi, Dr.Hanns Moshammer, Dipl.-Ing. Peter Tappler, Dipl.-Ing. Felix Twrdik, Dr. Peter Wallner), http://www.komfortlüftung.at/.
[5] ECA (1992) Guidelines for ventilation requirements in buildings. European Collaborative Action Indoor Air Quality & its Impact on Man. Report no. 11. EUR 14449, quoted in: Bundesgesundheitsbelehrung, Gesundheitsforschung-Gesundheitsschutz des Umweltbundesamtes 2008, Gesundheitliche Bewertung von Kohlendioxid in der Innenraumluft, Springer Medizin Verlag Ergonomic Institut für Arbeits- und Sozialforschung, page 1366.
[6] Bundesgesundheitsbelehrung, Gesundheitsforschung-Gesundheitsschutz des Umweltbundesamtes 2008, Gesundheitliche Bewertung von Kohlendioxid in der Innenraumluft, Springer Medizin Verlag Ergonomic Institut für Arbeits- und Sozialforschung, page 1358f.
[7] EN 16798-1:2019 Energy performance of buildings - Ventilation for buildings - Part 1: Indoor environmental input parameters for design and assessment of energy performance of buildings addressing indoor air quality, thermal environment, lighting and acoustics.
[9] Umweltbundesamt Innenraumlufthygiene-Kommission des Umweltbundesamtes, Leitfaden für die Innenraumhygiene in Schulgebäuden, authors Dr. Heinz-Jörn Moriske and Dr. Regine Szewzyk, 2008, page 32, http://raumluft.linux47.webhome.at/fileadmin/dokumente/uba_innenraumhygiene_schulgebaeude.pdf.
[10] Fig. 3: Ad-hoc AG IRK/AOLG, 2008: Gesundheitliche Bewertung von Kohlendioxid in der Innenraumluft, Bundesgesundheitsbl-Gesundheitsforsch-Gesundheitsschutz.
[11] Über das Sick-Building Syndrome, author Dr-Ing. Ahmet Cakir, Zeitschrift für Arbeitswissenschaft 1994 ((http://ergonomic.de/wp-content/uploads/2015/03/sick_building-2002.pdf.
[12] Umweltbundesamt Innenraumlufthygiene-Kommission des Umweltbundesamtes, Leitfaden für die Innenraumhygiene in Schulgebäuden, authors Dr. Heinz-Jörn Moriske and Dr. Regine Szewzyk, 2008, page 10.
[13] Frauenhofer IBP, Frauenhofer Institut für Bauphysik IBP, Study Report Titel Impact of the indoor environment on learning in schools in Europe, authors Gunnar Grün, Susanne Urlaub, Stuttgart, 10. Dezember 2015, https://www.ibp.fraunhofer.de/content/dam/ibp/de/documents/Presseinformationen/Velux-Prestudy_WhitePaper_141205_amended.pdf.
[14] Shendell DG, Prill R, Fisk WJ, et al. (2004) Associations between classroom CO₂ concentrations and student attendance in Washington and Idaho. Indoor Air 14:333–341, quoted in: Bundesgesundheitsbelehrung, Gesundheitsforschung-Gesundheitsschutz des Umweltbundesamtes 2008, Gesundheitliche Bewertung von Kohlendioxid in der Innenraumluft, Springer Medizin Verlag Ergonomic Institut für Arbeits- und Sozialforschung.
[15] Frauenhofer IBP, Frauenhofer Institut für Bauphysik IBP, Study Report Titel Impact of the indoor environment on learning in schools in Europe, authors Gunnar Grün, Susanne Urlaub, Stuttgart, 10. Dezember 2015, (https://www.ibp.fraunhofer.de/content/dam/ibp/de/documents/Presseinformationen/Velux-Prestudy_WhitePaper_141205_amended.pdf).
[16] Umweltbundesamt Innenraumlufthygiene-Kommission des Umweltbundesamtes, Leitfaden für die Innenraumhygiene in Schulgebäuden, authors Dr. Heinz-Jörn Moriske and Dr. Regine Szewzyk, 2008 (http://raumluft.linux47.webhome.at/fileadmin/dokumente/uba_innenraumhygiene_schulgebaeude.pdf, Seite 7.
[17] Mensch-Umwelt-Gesundheit, Bericht CO₂, http://raumluft.linux47.webhome.at/natuerliche-mechanische-lueftung/co2-als-lueftungsindikator/, page 2.
[18] Rudnick SN, Milton DK (2003) Risk of indoor airborne infection transmission estimated from carbon dioxide concentration. -245 Bundesgesundheitsbelehrung, Gesundheitsforschung-Gesundheitsschutz des Umweltbundesamtes 2008, Gesundheitliche Bewertung von Kohlendioxid in der Innenraumluft, Springer Medizin Verlag Ergonomic Institut für Arbeits- und Sozialforschung, page 1365.
[19] Umweltbundesamt Innenraumlufthygiene-Kommission des Umweltbundesamtes, Leitfaden für die Innenraumhygiene in Schulgebäuden, authors Dr. Heinz-Jörn Moriske und Dr. Regine Szewzyk, 2008 (http://raumluft.linux47.webhome.at/fileadmin/dokumente/uba_innenraumhygiene_schulgebaeude.pdf, page 39.
[20] Bundesgesundheitsbelehrung, Gesundheitsforschung-Gesundheitsschutz des Umweltbundesamtes 2008, page 1358- 1369, http://www.komfortlüftung.at/, gesund&energieeffizient, Komfortlüftungsinfo No. 4, Gesetzliche Vorgaben und Regelwerke, Herausgegeben am 15.10.2010, page 7.
[21] SF-Ministry of the Environment (2003) Indoor climate and ventilation of buildings. Regulations and Guidelines 2003. D2 National building code of Finland, http://www.environment.fi/default.asp?contentid=68171&lan=en, zitiert bei: Bundesgesundheitsbelehrung, Gesundheitsforschung-Gesundheitsschutz des Umweltbundesamtes 2008, Gesundheitliche Bewertung von Kohlendioxid in der Innenraumluft, Springer Medizin Verlag Ergonomic Institut für Arbeits- und Sozialforschun.
Follow us on social media accounts to stay up to date with REHVA actualities
0