


Stay Informed
Follow us on social media accounts to stay up to date with REHVA actualities

|
|
|
Mahmoud El-Mokadem | Kai Rewitz | Dirk Müller |
RWTH Aachen University, E.ON Energy Research Center, Institute for Energy Efficient Buildings and Indoor Climate (EBC), Aachen, Germany | RWTH Aachen University, E.ON Energy Research Center, Institute for Energy Efficient Buildings and Indoor Climate (EBC), Aachen, Germany | RWTH Aachen University, E.ON Energy Research Center, Institute for Energy Efficient Buildings and Indoor Climate (EBC), Aachen, Germany |
Currently, air quality control in shopping centres is based on fixed high air exchange rates or on the measured CO₂ concentration, which is a good indicator for the emissions of persons and allows for demand-based supply volume flow control. However, running the ventilation system with fixed volume flows does not lead to energy efficient operation and controlling the ventilation system based on only one parameter (CO₂) may not be sufficient from an air quality perspective. For example, odours and contaminants emitted from shopping centre products are not detectable by CO₂ sensors.
Odours perceived by humans can often be traced back to so-called volatile organic compounds (VOCs). These substances occur in the air in the form of gases and vapours. Even low VOC emissions are often associated with significant odour perceptions and can lead to health problems. In contrast to CO₂ sensors, VOC sensors can detect mixtures of substances in the indoor air with a characteristic signal [2]. However, the control of ventilation using VOC sensors is rarely implemented, since no specific limit value is defined that could be used to as a setpoint.
Due to the large number of VOC emissions in shopping centres, the goal is to define acceptable objective limits for different product groups. Hence, extending current CO₂-based control by VOC-based control can improve air quality.
In this study, metal oxide semiconductor sensors are selected for the detection of volatile organic compounds. Their operating principle is based on the dependence of the electrical conductivity of metal oxides on the gas concentrations and gas types present. Metal oxide semiconductor sensors can be divided into thin-film and thick-film sensors and exhibit, among other things, high sensitivity to low gas concentrations, a long service life and a low price, which potentially qualifies them for use in the demand-based control of ventilation systems. On the other hand, their non-linear sensor characteristics depending on the gas concentration make calibration difficult. Moreover, drift and aging behaviour cannot be neglected. Furthermore, there is a cross-sensitivity of additional parameters such as relative humidity and air temperature [3].
For the setup of the VOC sensor system, different metal oxide sensors of the MQ sensor series are used to enable the detection of several gases, such as CO, CO₂, H₂, NH₃, NOx, ETOH, alcohol, and formaldehyde. The MQ sensors are connected to a single board Arduino Mega microcontroller for power supply and data transfer. In addition, a temperature sensor and a humidity sensor are integrated to compensate for cross-sensitivities. With the help of a TVOC sensor, the sum of volatile organic compounds can be recorded. Thus, total air pollution can additionally be estimated [4]. Figure 1 shows the final VOC sensor system.
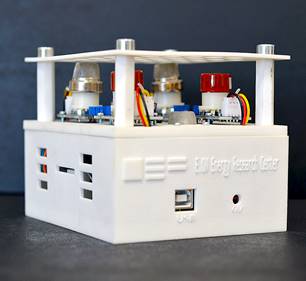
Figure 1. Developed E-Nose.
The results of previous studies with subjective tests confirm the significant decrement of the acceptability of perceived air quality with increasing temperature and humidity [5–8].
The aim of the current study is to collect both subjective and objective data for the evaluation of odours or air quality for selected product groups and to derive possible limit values. In particular, the influences of air temperature and relative humidity are to be analysed. The objective evaluation is carried out with the developed VOC sensor system. The subjective evaluation is carried out with a group of test persons trained according to DIN ISO 16000-28 with regard to acceptance and perceived intensity by using acetone comparative scale [9].
The study is conducted in the air quality laboratory of the Institute for Energy Efficient Buildings and Indoor Climate (EBC), RWTH Aachen University. The product groups are divided into 5 categories: clothing, books, shoes, perfume and coffee.
The products are filled into so-called emission chambers. The chambers are made of stainless steel to minimize the influence of oxidation reactions on the air. In addition, these chambers have a connection for introducing conditioned supply air via a central ventilation unit and an outlet fitted with a glass cylinder where test subjects can evaluate the air quality. Control of the supply air volume flow rate by measuring the actual condition via an orifice plate allows a precise adjustment of the air exchange in the emission chambers. To achieve good mixing even at low air changes, an additional mixing fan, which circulates the air in the chamber, is installed in each case. Figure 2 shows an example of the positioning of the clothing and the sensor system in one of the emission chambers. The sensor system is positioned directly in front of the mixing fan.
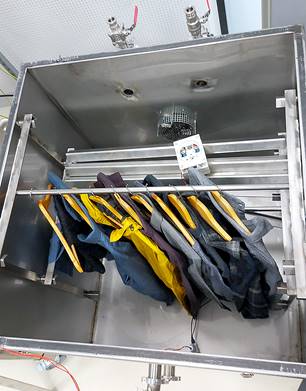
Figure 2. Positioning of the E-Nose and the product inside the emission chamber.
To evaluate the intensity of the shopping products emissions, an acetone comparative scale is used according to DIN ISO 16000-28. The test rig allows reproducible acetone concentrations. According to DIN ISO 16000-28, the acetone concentration in mg/m³ can be converted into PI. Here, 0 PI corresponds to an acetone concentration of 20 mg/m³. The increase by 1 PI corresponds to a linear increase of the acetone concentration of 20 mg/m³.
In previous investigations Hegemann et. al used a maximum intensity of 14 PI for a shopping centre product (shoes) [10]. Since the current study also tests other products such as perfume, for which significantly higher ratings are expected, the upper end of the comparative acetone scale is extended to 28 PI (580 mg/m³). In choosing this value, the stated limits of 590 mg/m³ by the National Institute for Occupational Safety and Health (NIOSH) for exposure over 24 hours are met [11].
According to DIN ISO 16000-28, the minimum size of a subjective group, for the evaluation of acceptance, is 15 persons (untrained) and for the evaluation of perceived intensity is eight persons (trained). For this study, 17 successfully trained test persons participated in the tests.
A classification of product groups from shopping centres or their emissions with respect to different VOC classes are investigated. Shoes, clothing, books, perfume and coffee, representing the food courts, are identified as relevant and suitable product groups for the main study. Sensors with correspondingly high sensitivity are also assigned to the VOC classes. For example, formaldehyde which can be emitted from new clothing, new shoes, or new books can be detected with HCHO sensor [12]. Sanaeifar et al. use the MQ-135 sensor for the detection of aromatic compounds emitted from food [13]. Perfumes and detergents contain alcohols, which can be detected with the MQ-3 sensor. Cosmetics containing alkanes can be detected with the MQ-2 sensor [14].
Since only three emission chambers are available, the study is divided into two sub-studies. In the first sub-study, clothing, shoes and perfume (variant 1) and in the second sub-study, books, coffee and perfume (variant 2) are evaluated. Perfume is tested for two source strengths, as the highest ratings were recorded here. The second variant corresponds to a 60% reduction in source strength compared to the first variant. In each sub-study, the group of test subjects is also divided into two sub-groups due to hygiene protection with regard to the COVID-19 pandemic, so that the first sub-group participated in the study in the morning and the second sub-group in the afternoon.
We selected one setting per day for the air temperature and the relative humidity of the supply air, which is kept constant during the day. Two hours before the arrival of the test subjects, the test stand is switched on to create stationary boundary conditions. After a welcome and brief acclimatization of the subjects, the evaluation begins. Once an evaluation is completed for all three emission chambers, the volume flow rate or air exchange rate is varied. During the test run, the subject group is almost exclusively in the air quality laboratory. After all assessments are completed, the subjects are dismissed. The parameter variations carried out were chosen to be inside the acceptable thermal comfort range boundaries [15]. Temperatures are chosen to 20°C, 23°C and 27°C, relative humidity is selected to 30% and 50% and air change rate is varied in 6 steps between 5.1 to 1 h−1. This leads to 36 evaluations per subject and product.
In addition to the evaluation of the perceived intensity, the percentage of dissatisfied subjects is analysed using the question: "Imagine you were exposed to the air from the emission test chamber for several hours a day. Would you rate the odour as acceptable?" "Yes" and "No" are available as response options. The proportion of no ratings is defined as the proportion of dissatisfied.
In Figure 3, the ratings per air exchange setting averaged over all test subjects are plotted against temperature for a relative humidity of 50%. These mean values are shown as coloured circles per product group. Based on the results, a direct proportional relationship between air temperature and perceived intensity can be seen for each product groups. Furthermore, the difference in perceived intensity due to the product groups is significantly higher than the influence of temperature.
Figure 4 shows the effect of relative humidity on the perceived intensity for perfume (variant 1). The results for the relative humidity of 30% are shown as red circles, respectively as black crosses for 50%. In addition, the regression lines are drawn. Both regression lines run almost parallel with the same slope. However, the perceived intensity at 50% humidity is rated higher by about 2 PI compared to 30% humidity. The results for the other product groups show similar behaviour. Overall, it can be concluded that an increase in temperature and humidity leads to an increase in perceived intensity.
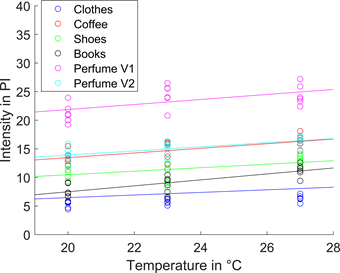
Figure 3. Influence of temperature on the perceived intensity at 50% relative humidity.
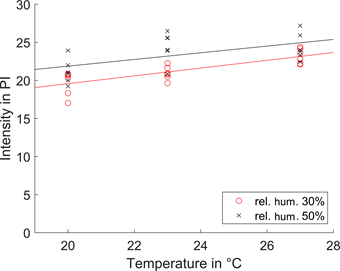
Figure 4. Influence of relative humidity (rel. hum.) on the perceived intensity for perfume (variant 1).
To evaluate the statistical significance of the temperature and humidity variation with respect to the subjects’ evaluation, the Friedman test is used. The Friedman test is a statistical test suitable for evaluating non-parametric data as it does not assume a normal distribution of the data [15]. As a result of the test statistic, the "P-value" is compared. In our case, if P > 0.05, the null hypothesis cannot be rejected, and a difference between the samples distributions cannot be detected. If P < 0.05, the null hypothesis is rejected, and the alternative hypothesis is accepted.
The Friedman test leads to P-values smaller than the defined significance level (P < 0.05) with range from 3.30e−13 to 6.95e−55, so that statistically significant differences due to the variation in temperature and humidity can be assumed.
Figure 5 shows the percentage of dissatisfied people for the perfume product (variant 1) across the different scenarios. The values in each scenario represent an average value over all test subjects and analysed air change rates. The percentage of dissatisfied people increases with rising air temperature and rising relative humidity. The influence of the temperature is higher at a relative humidity of 50% than at 30%.
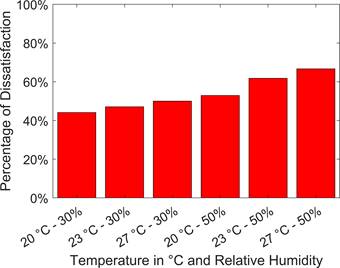
Figure 5. Influence of temperature and humidity on percentage of dissatisfied for perfume (variant 1).
In Figure 6, the percentage of dissatisfied people is plotted against the perceived intensity. The coloured symbols are mean values of the 17 evaluations by the test persons for each combination of product, temperature, relative humidity and air change rate. The range of ratings for the products studied varies. The highest ratings for perceived intensity and the proportion of dissatisfied persons exist for the product perfume (variant 1). The lowest ratings occur for clothing and books, with an intensity of approximately 5 PI resulting in a proportion of dissatisfied of approximately 20%. The data shows that the proportion of dissatisfied people increases with the perceived intensity.
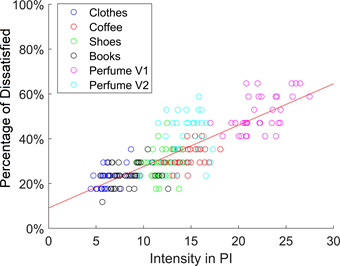
Figure 6. Correlation between perceived intensity and percentage of dissatisfied.
In the following, the results for the MQ-3 sensor are presented since it has the highest sensitivity to the products investigated. Figure 7 shows the sensor signal as a function of temperature for various products at a relative humidity of 50%. For all products except clothing, the sensor signal increases with increasing air temperature.
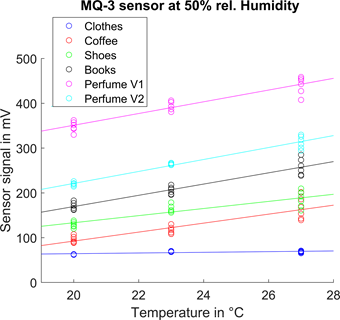
Figure 7. Influence of temperature on the sensor signal at 50% relative humidity for MQ-3 sensor.
Comparing this with the subjective data from Figure 3, a similar behaviour can be seen for the sensor signal as a function of temperature. When looking at the order of the perceived intensities with the measured sensor signals, it can also be seen changing in the ranking of the products between the subjective and objective output. For example, the subjects rate coffee as more intense than shoes, books and clothing, whereas the sensor signal is only weaker for clothing than for coffee.
Figure 8 shows the sensor signal as a function of temperature for perfume (variant 1) at a relative humidity of 30% and 50% for the MQ-3 sensor. The sensor signal increases with increasing relative humidity. This behaviour is similar to the observation for the evaluation of perceived intensity in Figure 4.
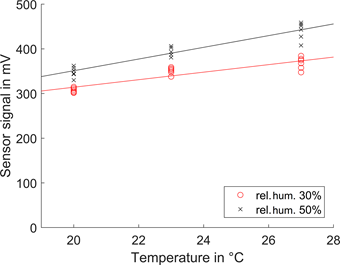
Figure 8. Influence of relative humidity on the sensor signal for perfume (variant 1) for MQ-3 sensor.
To use VOC sensors for demand-controlled ventilation in shopping centres, limit values are needed that can be used as set points for the controlled variables. In Figure 9, the perceived intensity (subjective values) is plotted against the sensor signal for the MQ-3 sensor. For the different product groups the point clouds in the diagram have different positions. In consequence, the correlation of the perceived intensity and the sensor signal should be done depending on the product groups. In addition, linear regression lines are shown on the basis of the five product groups investigated, whose functions, the coefficients of determination R² and the root mean square error (RMSE) are contained in Table 1.
Table 1. Derived correlations between sensor signal in mV (x) and perceived intensity in PI (y).
Data | Correlation | R² | RMSE |
All data | y = 0.05 · x + 4.75 | 0.65 | 3.2 PI |
Books | y = 0.026 · x + 3.72 | 0.40 | 1.4 PI |
Coffee | y = 0.026 · x + 11.48 | 0.30 | 1.5 PI |
Clothes | y = 0.053 · x + 3.39 | 0.40 | 0.9 PI |
Perfume | y = 0.05 · x + 5.20 | 0.65 | 2.5 PI |
Shoes | y = 0.026 · x + 7.09 | 0.20 | 1.5 PI |
In each case, a linear regression approach is used to derive a correlation between the sensor signal in mV and the perceived intensity in PI. The coefficient of determination for the separate analysis of the product groups is smaller than the overall regression data. It is noticeable that for books, coffee, and shoes, the slope of the regression function is the same, and only the Y-axis intercept differs. In Figure 10, the percentage of dissatisfied persons is plotted against the sensor signal of the MQ-3 sensor for the product groups investigated. It can be observed, that with increasing sensor signal the percentage of dissatisfied is rising. However, a strong scattering of the data along the regression line drawn can be seen. This makes it difficult to derive an exact objective limit value to reach a specific percentage of satisfied people or not to be too restrictive to guarantee a minimum percentage of dissatisfied.
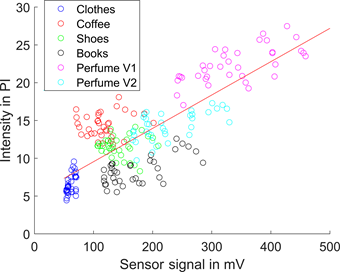
Figure 9. Correlation between the sensor signal of MQ-3 and the perceived intensity.

Figure 10. Correlation between the sensor signal of MQ-3 and the percentage of dissatisfied.
In order to detect emissions from building materials and products in shopping centres, VOC sensors are suitable in principle. Based on the results of the study carried out, it is possible to correlate the objective sensor signals with subjective evaluations for individual product groups. However, the determination of exact limit values in order to achieve a certain acceptance of the air quality must be set with caution due to the scattering of the data. With a larger amount of data, which would require further studies, it would also be possible to use machine-learning methods to analyse the data. With these, it might be possible to derive correlations between multiple sensor signals and subjective evaluations much more easily and robustly. Important findings were also obtained in connection with the influence of air temperature and humidity on subjective perception. Thus, for all products investigated, the perceived intensity and the proportion of dissatisfied persons increase with rising temperature and relative humidity. These findings can help implement an energy-efficient heating, cooling, and ventilation system operation in shopping centres.
[1] Koptyug E. Number of shopping centers in Germany from 1965 to 2021: Statista; 2021. Available from: URL: https://www.statista.com/statistics/523100/number-of-shopping-centers-in-germany/.
[4] Molhave L, Clausen G, Berglund B, et al. Total Volatile Organic Compounds (TVOC) in Indoor Air Quality Investigations*. Indoor Air 1997; 7(4): 225–40.
[5] Gunnarsen L, Fanger PO. Adaptation to indoor air pollution. Environ Int 1992; 18(1): 43–54.
[7] Berglund LG. Comfort and Humdity. ASHRAE Journal 1998; (August): 35–41.
[11] The National Institute for Occupational Safety and Health (NIOSH). Immediately Dangerous to Life or Health Concentrations (IDLH) for Acetone; 1994. Available from: URL: https://www.cdc.gov/niosh/idlh/67641.html.
[12] European Chemical Agency. Investigation Report: Formaldehyde and Formaldehyde Releasers; 2017 [cited https://echa.europa.eu/documents/10162/13641/annex_xv_report_formaldehyde_en.pdf/58be2f0a-7ca7-264d-a594-da5051a1c74b].
[14] Cosmetic Ingredient Review. Safety Assessment of Alkane Diolsas Used in Cosmetics; 2018. Available from: URL: https://www.cir-safety.org/sites/default/files/alkane%20diols_0.pdf.
Full paper: https://proceedings.open.tudelft.nl/clima2022/article/view/418
Follow us on social media accounts to stay up to date with REHVA actualities
0