


Stay Informed
Follow us on social media accounts to stay up to date with REHVA actualities


|
|
|
|
Jinkyun Cho | Jinho Kim | Jongwoon Song | Seungmin Jang |
Dept. of Building and Plant Engineering, Hanbat National University, Korea | Dept. of Fire Protection, Safety and Facilities, Suwon Science College, Korea | Energy Solution Technology, E-SOLTEC Co., Ltd., Korea | Dept. of Building and Plant Engineering, Hanbat National University, Korea |
In the past, most types of viruses that reached the pandemic level were respiratory infections such as influenza and coronavirus [1]. Particularly, the coronavirus causes a pandemic every 5 to 10 years because the cycle is getting shorter [2]. The WHO (word health organization) declared COVID-19 a global pandemic in 2020, which persists at the present. In the beginning, medical institutions isolated symptomatic patients from general patients through screening clinics. The screening clinic plays a primary role in screening suspected patients of infectious diseases. At the COVID-19 pandemic peak, more than 600 screening clinics (temporary, drive-through, walk-through and etc.) were installed and operated in Korea. However, there are no clear criteria and guidelines for the design, installation, and operation of these screening clinics worldwide. A novel non-contact modular screening clinic (NCMSC) was developed that addresses the problems of existing screening clinics and the risk of cross-infection during the COVID-19 testing process.
It increases the accessibility of patients to the screening clinic and provides adequate protection for healthcare workers (HCWs). The NCMSC is a safe medical facility equipped with negative pressure zones, an anteroom (AR) and a specimen collection booth (SCB), and positive pressure zones, such as an examination room (ER), as shown in Figure 1. Moreover, it implemented two-stage negative pressure control to prevent virus leakage. The air change rate was set to more than 12 ACH [3], [4], which is the standard for an airborne infectious isolation room, and the pressure differential was set to maintain maximum 25 Pa or above. Subsequently, ER maintained positive pressure and HEPA filter (PM2.5 99.97%) were applied to prevent infection among HCWs. The total air change rate of the SCB was set to be maximum 30 ACH for an effective discharge of viruses. The ventilation system provides a safe air quality and space for HCWs and individuals to be tested against infection. Therefore, the appropriate arrangement of the supply air (SA) and exhaust air (EA) outlets of the ventilation system is an important consideration for adequate indoor airflow. The ventilation system and pressure differential performance should be reviewed and the airtightness and the area of opening of the structure should be optimized to maintain pressure differential through numerical analysis results and prevent aerosol viral diffusion and infection between SCB and ER.
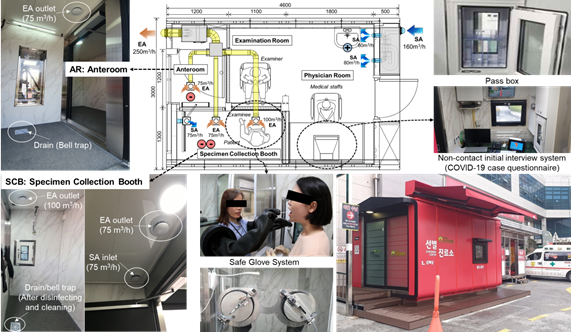
Figure 1. Layout of the COVID-19 NCMSC showing the optimized of SA/EA inlet/outlet locations.
A quantitative analysis of the effect of the cross-infection prevention and a ventilation strategy to prevent the transmission are needed and should be established in the developed NCMSC. The effects of the airflow velocity and room pressure control based on the operation of the ventilation system on the viral transmission were investigated. The dimension of the CFD domain was 4100 × 3000 × 2400 mm (L×W×H). Figure 2 shows the division of SCB, AR, and ER.Both SA and EA systems were applied in the SCB for effective. On the other hand, only a SA system of ER was set to 6 ACH. Only an EA system was installed in AR and the airflow rate of EA was 12 ACH for Baseline and 30 ACH for Cases 2 and 3. Meanwhile, an EA outlet was installed in the SCB with an EA flowrate of 12 ACH for Baseline. In addition, two EA outlets were installed for Cases 2 and 3 with total EA flowrate of 30 ACH. Furthermore, Case 3 applied the SA system was installed with a flowrate of 12 ACH. The negative pressure was controlled in SCB, and analysed with all doors closed.The shortage of SA for EA was supplemented through door gaps of adjacent rooms, and the direction of airflow was from the ER to the SCB.
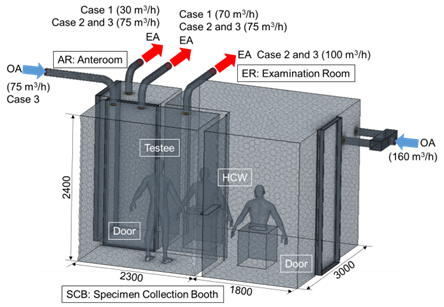
Figure 2. NCMSC mesh of the CFD model.
The boundary conditions of the simulations are listed in Table 1.The velocity of air supplied through the SA inlet and gap of the door, the velocity of air exhausted through the EA outlet, and the pressure differential between rooms were evaluated. Then, the ventilation performance through which the virus is assumed to be an aerosol of SCB is predicted.
Table 1. CFD boundary conditions with airflow rates.
Ventilation system | Baseline | Case 2 | Case 3 |
Supply (ER) | 160 m³/h | 160 m³/h | 160 m³/h |
Transfer (ER to SCB) | 25 m³/h | 40 m³/h | 30 m³/h |
Supply (SCB) | N/A | N/A | 75 m³/h |
Exhaust (SCB) | 70 m³/h | 175 m³/h | 175 m³/h |
Exhaust (AR) | 30 m³/h | 75 m³/h | 75 m³/h |
Transfer (AR to SCB) | 45 m³/h | 135 m³/h | 70 m³/h |
Lying manikins | Uniform heat flux: 62 W, no slip boundary | ||
Walls | 2 and 1 W/m² at ceiling/floor, no slip boundary | ||
Bedside | Adiabatic wall boundary condition | ||
Grid cells | 8,176,419 | ||
Turbulence model | Standard k–ε model | ||
Figure 3(a) shows the horizontal airflow velocity profile at a height of 1.5 for each Case.
The air change rates for AR and SCB in Baseline, which only applied the EA system, was set to 12 ACH. The velocity values were in the range of 0.0374 to 0.0506 m/s by examining the average airflow velocity distribution for each height of the SCB, indicating that the airflow progressed slowly and the air was gradually exhausted. In the case of AR, the air was exhausted with a similar velocity of approximately 0.0365~0.0414 m/s with some of the air moved to the SCB. On the other hand, the air change rates for AR and SCB in Case 2, which only applied the EA system were set to 30 ACH. The average air velocity profile for each height of the SCB was in the range of 0.0852 to 0.0945 m/s, indicating that the airflow velocity was increased twice than in Baseline. The air in the AR is exhausted with a velocity range of 0.0931 to 0.1003 m/s with some of the air moves to the SCB.
Furthermore, the air change rates for AR and SCB in Case 3, which applied both EA and SA systems in the SCB were set to 30 ACH. The average airflow velocity range was from 0.1236 to 0.1781 m/s. The average airflow velocity profile was increased by approximately 1.7 times than in Case 2. The air in AR was exhaustedwith a velocity ranging from 0.1086 to 0.1166 m/s, and some of the air moves to the SCB.
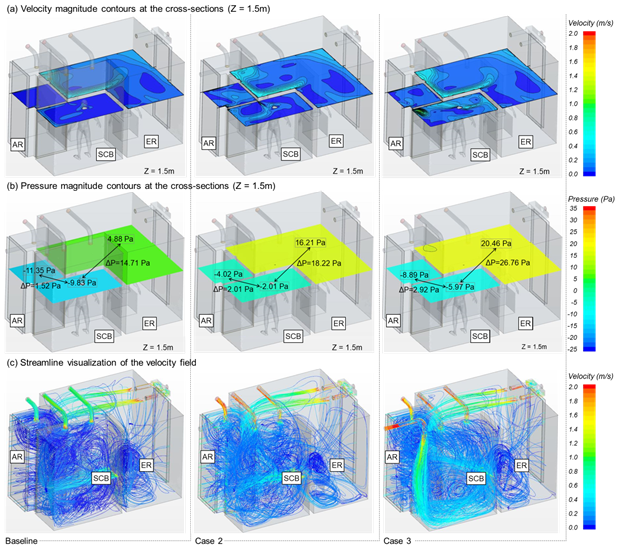
Figure 3. Results of CFD numerical analysis in the NCMSC for different ventilation conditions.
A negative pressure should be maintained in the contaminated zone (SCB) and a positive pressure should be maintained in the clean zone (ER) to ensure that the aerosol viruses in SCB do not flow to the ER.Figure 3(b) shows the pressure differential between SCB and ER for each case. It is less likely that viruses migrate from SCB to the ER if the pressure is great between these two rooms.
The average pressure differential for Baseline, Case 2 and 3 were -14.62 Pa, -18.17 Pa and -25.25 Pa, respectively. The analysis showed that the SCB was properly controlled for all cases to maintain the negative pressure. In addition, the effect of the cross-infection prevention of COVID-19 entering the ER is considerably enhanced because the pressure differential increases from Baseline to Case 3.The average pressure differential between SCB and AR for Baseline andCase 2, 3 were -1.39, -1.87 and -3.02 Pa, respectively. However, the values for Baseline and Case 2 are not within the appropriate range of the recommended pressure differential of at least -2.5 Pa based on the airborne infectious isolation room [5].
Figure 3(c) shows the airflow streamlines across the entire MCMSC space. It is apparent that for SCB, which applied both SA and EA systems in Case 3, the ventilation is active across the entire room compared to Baseline and Case 2, which only applied the EA system. The airflow velocity results of 0.0587 m/s for Baleline and 0.112 m/s for Case 2 were obtained by examining the overall average airflow velocity of the room, indicating that the velocity of Case 2 increased by 1.9 times than Baseline. In addition, the airflow velocity was 0.1786 m/s for Case 3, indicating a velocity increase of 1.6 times than Case 2 and 3.0 times than Baseline. It is expected that Case 3 will enhance the ventilation performance and facilitate an effective discharge of the aerosol COVID-19 viruses.
Full-scale field measurements were performed under similar conditions used in the numerical analysis. PIV (particle image velocimetry) was used to conduct experiments for airflow behavior characterization and examination of the leakage area through visualization of particles simulating viruses in SCB and to verify the safety of the developed NCMSC against cross-infection.
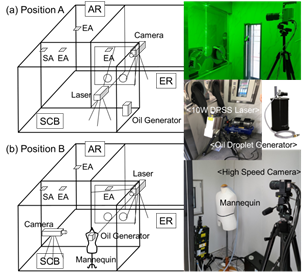
Figure 4. Experimental set-up for the PIV.
Table 2. Measuring cases with the PIV equipment.
Measurement | Cases | Position | Door between SCB and AR |
PIV A1 | Case 2 | A | Closed |
PIV A2 | Case 3 | A | Closed |
PIV B1 | Case 3 | B | Closed |
PIV B2 | Case 3 | B | Open |
Figure 4 shows the experimental setup and perspective view of the PIV set-up. Two-dimensional flow fields were measured at different positions of the camera and laser. At Position A, the camera was installed in the ER, and the laser and oil droplet generator were installed in the SCB. Moreover, at Position B, the laser was installed at the ER and the camera and the oil droplet generator was installed in the SCB to ensure that the droplet came out from the mouth of the manikin, an individual to be tested. Subsequently, the exhaust airflow was observed. Four different PIV measurements were performed for four different combinations, as shown in Table 2. First, the PIV measurement was performed at Position A for Case 2, where only the EA system was operated, and Case 3, where both EA and SA systems were simultaneously operated in the ventilation system of the SCB. Subsequently, the ventilation performance at Position B was examined with the door between the AR and SCB closed and open for Case 3.
The pressure differential can determine the effect of cross-infection prevention. The pressure differentials of SCB and ER with the ventilation system turned on are ΔP = -21.8 and -29.3 Pa, respectively. The measured values and numerical analysis results were very similar. The negative pressure in the SCB was properly maintained for both cases (Cases 2 and 3). The experimental results were divided into two parts based on the location of the PIV measurements. Moreover, Figure 5 shows the experimental results for the vertical airflow velocity.
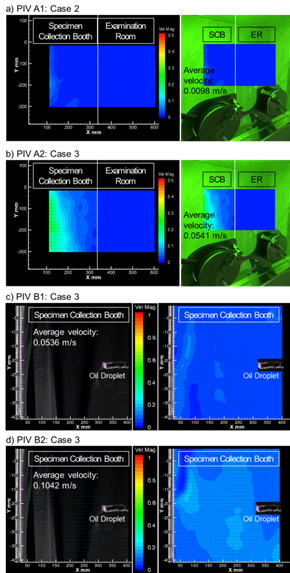
Figure 5. Time-averaged air distribution under PIV cases.
Figure 5(a) shows the average velocity of Case 2 for PIV A1. The particle movement velocity in the SCB was found to be very slow with almost no airflow for an average airflow velocity of 0.0098 m/s. On the other hand, the average airflow velocity of PIV A2 in Case 3 (Figure 5(b)), where SA and EA systems were operated, was 0.0541 m/s, indicating a four-time increase than PIV A1. The make-up air was smoothly supplied to improve the exhaust efficiency. In addition, the cross-infection by viruses is not expected to occur since there was no airflow from the contaminated zone (SCB) to the clean zone (ER) in PIV A1 and PIV A2. Figure 5(c) shows the average velocity of Case 3 for PIV B1. The average airflow velocity was 0.0536 m/s, and is the same as that in PIV A1 under the same ventilation conditions. Finally, Figure 5(d) shows the average velocity of Case 3 for PIV B2. The same condition was applied to PIV B2 as PIV B1, but the door to the AR was opened. In this case, the results showed that the average airflow velocity was 0.1042 m/s, and the velocity of the generated particles increased more than twice than that of PIV B1. However, it is a principle to close the door during specimen collection. Therefore, it is recommended to operate the ventilation system with the door open before the next individual to be tested enters to increase the cleaning and disinfection effect after collecting the specimen.
Based on the results of this study, the standards for the installation and operation of the screening clinics are proposed. It is necessary to implement space configuration and secure airtight performance to ensure that all tests can be performed using non-contact methods.
This work is supported by the Korea Agency for Infrastructure Technology Advancement (KAIA) grant funded by the Ministry of Land, Infrastructure and Transport (22TBIP-C161800-02).
[1] Lim, T., Cho, J., Kim, B.S., 2010, The predictions of infection risk of indoor airborne transmission of diseases in high-rise hospitals: Tracer gas simulation,Energy and Buildings, 42(8), 1172-1181.
[2] Noor, R., Maniha, S.M.,2020, A brief outline of respiratory viral disease outbreaks: 1889-till date on the public health perspectives,Virusdisease, 31(4), 441-449.
[3] CDC, Guidelines for preventing the transmission of mycobacterium tuberculosis in health-care facilities, US Department of Health and Human Services, Public Health Services, Federal Register. 1994.
[4] Cho, J., Woo, K., Kim,B.S.,2019, Removal of airborne contamination in airborne infectious isolation rooms.ASHRAE Journal, 61(2), 8-21.
[5] Cho, J., 2019, Investigation on the contaminant distribution with improved ventilation system in hospital isolation rooms: Effect of supply and exhaust air diffuser configurations, Applied Thermal Engineering, 148, 208-218.
Full article: https://proceedings.open.tudelft.nl/clima2022/article/view/283
Follow us on social media accounts to stay up to date with REHVA actualities
0