


Stay Informed
Follow us on social media accounts to stay up to date with REHVA actualities
|
|
|
|
Markus Schaffer | Judith Fauth | Hicham Johra | Olena K. Larsen |
msch@build.aau.dk | judith.fauth@tuwien.ac.at | hj@build.aau.dk | ok@build.aau.dk |
|
|
|
|
|
|
|
|
Daniel Leiria | Anna Marszal-Pomianowska | Michal Pomianowski | |
dle@build.aau.dk | ajm@build.aau.dk | mzp@build.aau.dk |
The digitalisation of the building sector progresses rapidly in all phases of the building's lifetime. With the Energy Performance Certificates (EPCs), which are valid for only 10 years, performance data are then collected multiple times during the operation phase. Since December 2018, European Union regulations have enforced remote readability and smart metering for energy carriers in all EU buildings [1]. Consequently, the estimates from 2020 indicate that 72% of electricity consumers had a smart electricity meter. By 2027, all buildings connected to an electricity grid or a district heating network must be equipped with such a smart meter. Similar requirements are made for smart gas meters. Furthermore, smart water meters also are becoming increasingly common across the EU [2]. Thereby, dynamic energy and water usage data become available for a large share of the building stock. In addition, the digitalisation of households is ramping up with the deployment of IoT (Internet of Things). By 2028, it is estimated that approximately 40% of the EU dwellings will be equipped with IoT devices for energy and comfort management [3], thus gathering more data on indoor environment quality and energy performance.
This massive digitalisation could be the needed game changer to accelerate the decarbonisation of the building stock by offering dynamic assessment and optimization tailored to a single building and its occupants as well as the needs of local energy grids.
This article showcases the application of new data treatment frameworks and methods to leverage this massive influx of dynamic data. Since in 2022, more than 90% of European buildings were buildings solely equipped with energy meters lacking IoT-enabled sensors and devices [3], the starting point for all methods is the data available from smart meters, in particular heat and water. In the end, this work outlines the lessons learned and potential challenges to be faced by actors/stakeholders in the building sector working with digitalisation.
Initially, EPCs for buildings were introduced to offer transparent information regarding the energy performance of the building stock, serving as a vital asset in the data-driven implementation and evaluation of energy policies. Despite its widespread adoption, current EPC schemas exhibit several shortcomings [4]. These include a notable energy performance gap [4], a lack of consideration for comfort [4] and the free-running potential of buildings, and the absence of incentives for users to pursue energy efficiency [4].
Of significant concern, EPCs and tools used for labelling, in their static form, prove incompatible with dynamic data obtainable from monitoring solutions like indoor climate sensors or smart energy meters that can log data at high frequencies. This mismatch necessitates aggregating monitored data to the EPC calculation frequency, often on a monthly basis, resulting in a substantial loss of information rather than its efficient utilisation.
In the EDYCE project [5], an effort has been made to advance toward future assessment of building performance by utilising digital data from indoor climate sensors to better inform the models and to improve the model predictive capabilities through a definition of ‘adapted conditions’. An energy performance gap is then calculated as a difference between simulated results and the monitored actual performance by smart heat meters (SHMs). Contrary to the EPC schema, the resolution of the results in E-DYCE can better match the time resolution from monitoring. The methodology is depicted in Fig.1 and as presented, its main objective is to derive the energy performance gap, where the main advancements revolve around the following three activities: i) determination of adapted conditions of use, ii) disaggregation of space heating and domestic hot water production from the total heat recorded by SHMs (further elaborated in section 2 of this paper), iii) dynamic performance gap analysis.
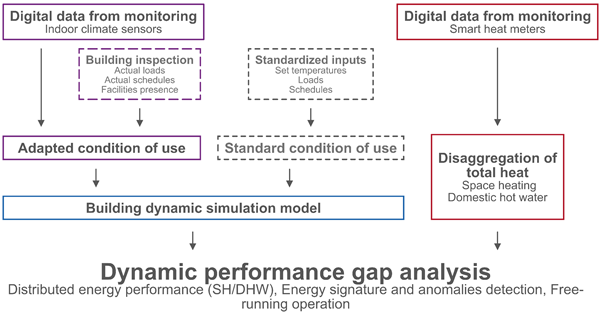
Figure 1. The methodology of data-driven building performance assessment in E-DYCE.
The E-DYCE framework suggests replacing standardised inputs for modelling with adapted conditions of use, offering a more realistic representation of building operation in the model [6]. In particular, standard indoor temperatures are replaced by monitored ones, which are spatially aggregated and extrapolated to fit different modelling approaches for geometry simplifications. Performance gap analysis was carried out with weekly time steps, however, the E-DYCE framework allows for more frequent analysis, if relevant.
As shown above, current developments demonstrate that smart meter data harbours significant potential due to its high temporal resolution, commonly one hour or higher, and widespread adoption.
However, the usability of the data is compromised by the fact that smart meters in Denmark typically record the total heat energy used by a building or apartment, encompassing both space heating (SH) and domestic hot water (DHW) production — two distinct end uses. Separating energy usage for SH and DHW is imperative for frameworks investigating and seeking to address performance gaps, such as the E-DYCE approach. It is also crucial for district heating utilities looking to implement demand response strategies by modulating energy use for SH to reduce peak demand. In addition, it plays a fundamental role in identifying suitable energy efficiency measures, reasons for discomfort, and supporting a comprehensive analysis of the building's energy balance.
To meet the demand for knowledge about the separated energy use for each end use, a recent series of publications [7-10] has developed an approach to disaggregate the total energy recorded by SHMs into SH and DHW. The fundamental concept of this approach involves four steps:
1. Identify hours where only SH is used
2. Train a model on these hours
3. Use this model to predict SH for all hours where DHW may be used
4. Calculate DHW as the difference between the recorded total energy use and the predicted SH
Identifying hours with only SH use can be achieved using the "maximum peak" approach, assuming that hours involving both SH and DHW use are within the seven highest energy use recordings between 5 am and 11 pm (refer to Fig.2a). This approach has an accuracy of approximately 80% [8]. However, when hourly total potable water readings from smart water meters are available, this information can be used to identify hours with SH use only [10]. This prevents the misclassification of hours where DHW was used as hours with SH only (Fig.2b).
As for the model predicting SH, it has been demonstrated that a random forest model can accurately predict SH based solely on data from SHMs without the need for additional model fine-tuning [10].
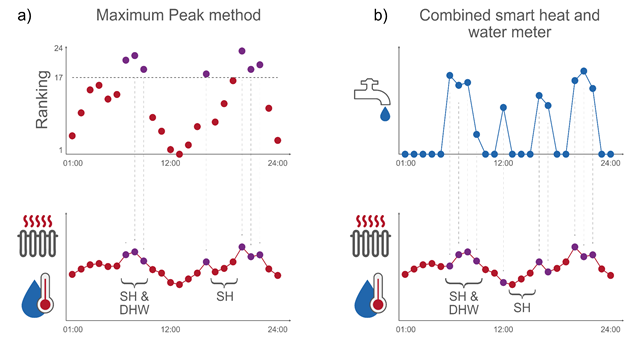
Figure 2. a) Identification of hours with SH and SH& DHW use based on the maximum peak approach. b) Identification of hours with SH and potential SH&DHW use based on data from smart water meters.
Today, 50-60% of all building heating systems have faulty operation leading to higher volume flows and return temperatures and creating large barriers for buildings and district heating optimization. After the split of total heat demand to space heating and domestic hot water by using the above-described methods, the real-time insights provided by SHM readings can be used for assessing the system performance and pinpointing faults that hinder efficiency.
Fig.3 showcases the relationship between heat-carrier fluid volume flow and return temperature for three similar apartments. These apartments share the same SH systems and building characteristics, yet display varying SH performances. Apartment 1 maintains the most consistent and optimal performance throughout the year.
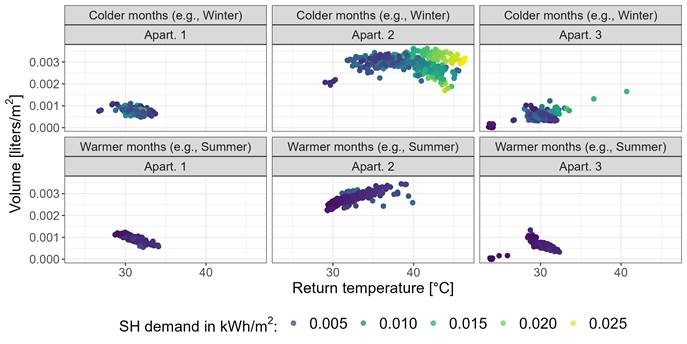
Figure 3. Relation between energy, volume, and return temperature of three similar apartments with different SH performances.
During warmer months, all apartments show a decrease in SH demand. However, Apartment 2 exhibits a significant shift in SH demand in colder months (greener data points denoting higher energy use). This variation signals potential inefficiencies, like an imbalance in heat distribution through the dwelling’s radiators. Fixing the faults in Apartment 2 could result in energy demand and volume flow reductions, bringing its performance closer to the more efficient Apartments 1 and 3. Potential improvements in Apartment 2 can be estimated as a drop of around 19% in energy demand, a decrease of 75% in volume, alongside a 69% increase in the temperature difference between supply and return fluid during the colder months. Apartment 3's data also presents anomalies (periods without any heating use with minimum volume flow and low return temperatures), alongside occasional spikes in the return temperature.
This short example underlies that the SHM readings are not only destined for routine monitoring and billing but can also be employed for rapid detection and diagnosis of faulty heating systems that fall short of optimal operation over long periods and occasionally.
The ongoing process of digitalisation presents new opportunities to support the decarbonisation of the building stock. However, it comes with significant challenges. Some arise from the original intended use of data, such as smart heat meters being primarily designed for billing. Consequently, this data is often transmitted at a 1 kWh resolution, introducing uncertainty when estimating the energy demand at a fine granular level, especially for hourly estimates of individual apartments [11] (Fig.4).
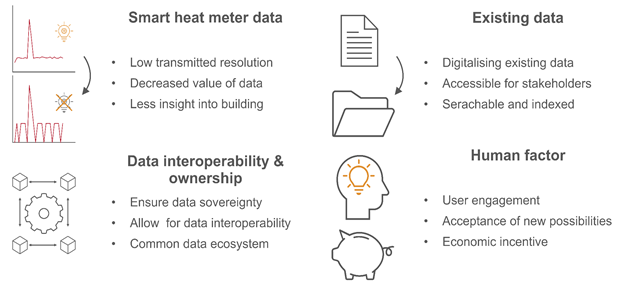
Figure 4. Current and future challenges and opportunities regarding the digitalisation in the building sector.
Other common digitalization challenges include interoperability between diverse data sources and the importance of respecting data ownership, sovereignty and privacy. Within the building sector, research and policy efforts are addressing these issues (Fig.4). Initiatives like the Digital Building Logbook aim to establish a common data ecosystem within the EU for comprehensive data storage related to buildings [12].
Specifically concerning the existing building stock, a challenge emerges as significant information exists in paper-based form within relevant building authorities, often with limited or restricted access for stakeholders. Emerging technologies, such as text and image recognition, show great potential to increase the availability and usefulness of this information (Fig.4).
Ultimately, the engagement and awareness of building owners are pivotal for the success of digitalisation. Building tenants and owners recognising the challenges in achieving the decarbonisation of the building stock and accepting the new possibilities presented by data-driven methods (e.g., dynamic building control and demand response) are essential for building digitalisation to be successful. Finally, the economic incentive must be given, calling for new tariffs incorporating for example energy flexibility provided by a single building for a grid (Fig.4).
[1] Directive (EU) 2018/2002 amending Directive 2012/27/EU on energy efficiency https://eur-lex.europa.eu/legal-content/EN/TXT/PDF/?uri=CELEX:32018L2002&from=EN.
[2] Berg Insight, 2023, Smart Water Metering in Europe and North America, 3rd Edition, https://www.berginsight.com/smart-water-metering-in-europe-and-north-america.
[3] Smart Home - Europe. (n.d.). Retrieved November 20, 2023, from https://www.statista.com/outlook/dmo/smart-home/europe.
[4] Li Y, Kubicki S, Guerriero A and Rezgui Y 2019 Review of building energy performance certification schemes towards future improvement Renew. Sustain. Energy Rev. 113 109244.
[5] Energy flexible dynamic building certification (EDYCE) https://edyce.eu/.
[6] Larsen, O. K., Pomianowski, M. Z., Chiesa, G., Belias, E., De Kerchove D’EXAERDE, T., Flourentzou, F., Fasano, F., & Grasso, P. (2023). E-DYCE - Dynamic approach to the dynamic energy certification of buildings. Journal of Physics, 2600(3), 032015. https://doi.org/10.1088/1742-6596/2600/3/032015
[7] Leiria, D., Johra, H., Belias, E., Quaggiotto, D., Zarrella, A., Marszal-Pomianowska, A., & Pomianowski, M. (2022). Validation of a new method to estimate energy use for space heating and hot water production from low-resolution heat meter data. E3S Web of Conferences, 362, 10001. https://doi.org/10.1051/e3sconf/202236210001.
[8] Leiria, D., Johra, H., Marszal-Pomianowska, A., & Pomianowski, M. Z. (2023). A methodology to estimate space heating and domestic hot water energy demand profile in residential buildings from low-resolution heat meter data. Energy, 263(PB), 125705. https://doi.org/10.1016/j.energy.2022.125705.
[9] Leiria, D., Schaffer, M., Johra, H., Marzsal-Pomianowska, A., & Pomianowski, M. Z. (2023). Estimating residential space heating and domestic hot water from truncated smart heat data. Journal of Physics: Conference Series, 2600(2), 022017. https://doi.org/10.1088/1742-6596/2600/2/022017.
[10] Schaffer, M., Widén, J., Vera-Valdés, J. E., & Marszal-Pomianowska, A. (Submitted). Disaggregation of Total Energy Use into Space Heating and Domestic Hot Water: A city-scale suited approach. Energy.
[11] Schaffer, M., Leiria, D., Vera-Valdés, J. E., & Marszal-Pomianowska, A. (2023). Increasing the accuracy of low-resolution commercial smart heat meter data and analysing its error. 2023 European Conference on Computing in Construction 40th International CIB W78 Conference.
[12] European Commission, Executive Agency for Small and Medium-sized Enterprises, Volt, J., Toth, Z., Glicker, J. et al., Definition of the digital building logbook – Report 1 of the study on the development of a European Union framework for buildings' digital logbook, Publications Office, 2020, https://data.europa.eu/doi/10.2826/480977.
Follow us on social media accounts to stay up to date with REHVA actualities
0