


Stay Informed
Follow us on social media accounts to stay up to date with REHVA actualities
|
|
|
|
Ad van der Aa | Richard Claessen | Willem van der Spoel | Peter van der Velde |
ing.ABT bv, Delft, Netherlandsa.vd.aa@abt.eu | ir.ABT bv, Velp, Netherlands | dr. ir.ABT bv, Velp, NetherlandsDelft University, Delft, Netherlands | ing.Interland Techniek, Waalwijk, Netherlands |
The airborne spread of viruses in buildings has long been a topic of scientific research. As early as the 19th century, it was understood that proper ventilation has an impact on human health. Around 1930, a more fundamental basis about airborne virus spread in rooms was established by the work of Wells [1]. The 2002 outbreak of the SARS-CoV epidemic in China increased scientific research on the mechanisms of airborne virus spread in buildings. The current outbreak of the SARS-CoV-2 virus has led to a major acceleration of further research on this topic. It has become clear that there is an airborne route by which virus particles are transmitted from person to person. Virus-laden airborne particles emitted from the nose and mouth by exhalation, speaking, coughing, or sneezing play a vital role. Depending on the size of the particles referred to as aerosols or droplets. The emission rate varies from up to about 1 m/s for exhalation and speaking to 5 m/s for loud speaking and singing to more than 10 m/s for screaming, coughing and sneezing [2]. However, the exact quantity of harmful virus particles emitted by an infected person, the size of those particles, the quantity that results in infection, what distance is safe, what ventilation rate is appropriate, etc., is not yet certain [3]. As a result, the current practice is to minimize the received dose as far as reasonably achievable.
An inventory of the current elevator cabin ventilation solutions in the Netherlands shows a limited presence of ventilation facilities to supply fresh air to the cabin. In this light, it is not surprising that recent research by the University of Amsterdam indicates that concentrations of virus particles can hover in the elevator cabin up to 20 minutes after use [4]. The shortcomings in elevator ventilation combined with current COVID-19 guidelines, e.g. maintaining distance, have resulted in a strongly limited or sometimes even forbidden use. Especially in high-rise situations this is far from desirable as it effectively blocks the use of the upper floors.
A solution to this problem should meet at least the following conditions:
1. Contaminated air (virus-laden particles) should be removed from the elevator cabin effectively and efficiently.
2. The airflow pattern must ensure that elevator passengers are always inhaling clean and safe air, also when they are positioned at a relatively short distance from each other.
These conditions can be fulfilled by applying vertical displacement ventilation, either downflow or upflow. The more practical solution is to supply fresh air from the cabin ceiling and to discharge air near the floor, as with this configuration the supply diffuser remains clean. The supply air should be evenly distributed over the ceiling area and the downflow should force the exhaled, potentially contaminated air, along the body towards the floor. The principle is known from laboratories, cleanroom environments and operating rooms.
Nielsen [5] studied the airflow around thermal manikins in climate chambers. Findings show that a thermal plume around a person has an upward velocity of approximately 0.25 m/s. This implies that a downward velocity of 0.30 m/s should be sufficient to achieve a stable downward directed airflow. For cleanrooms, values between 0.20 and 0.45 m/s are generally used, depending on the specific procedures taking place. In a study on particle transfer in downflow isolation chambers, Yang [6] recommends a velocity between 0.20 and 0.25 m/s, depending on the position of the manikin.
To get more insight in the safe distance between elevator passengers in relation to the downflow velocity, a simple plume model [7] was used to calculate the downward deflection of the emitted airflow from the mouth/nose at different conditions (quiet exhalation 1.0 m/s, loud speech 5.0 m/s and coughing/sneezing 10.0 m/s) in dependence of the downward air velocity (0.02 m/s, 0.20 m/s and 0.30 m/s) at a flow opening of Ø 20 mm. The calculation results are shown graphically in Figure 1.
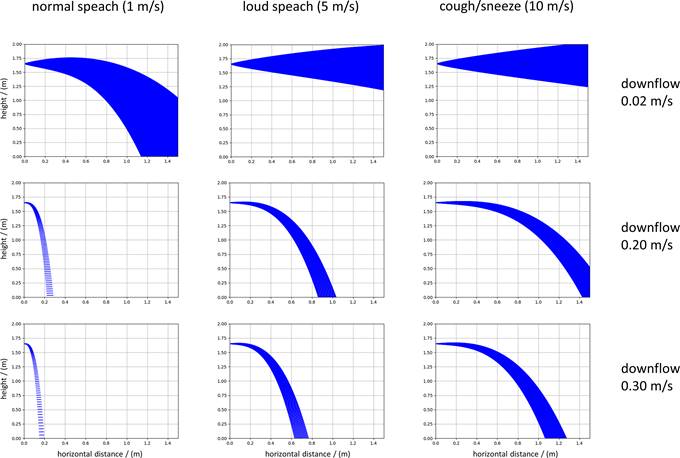
Figure 1. Calculated plumes for different combinations of exhalation velocity and downflow velocity.
Based on these indicative calculations, we concluded that for loud speech (5.0 m/s) and a downflow velocity of 0.30 m/s, a distance between persons of approximately 0.5 m can be considered safe. These values were used as the starting point for the design. Note that additional safety is obtained by wearing face masks as these substantially reduce exhalation speed.
The compact dimensions of typical elevators cabins, in height, length and width, pose design limitations, permitting little room for additional installations. In addition, elevator systems are subject to the regulations of EN 81-20 and EN 81-50, which primarily address the safe use and maintenance of elevator systems. Elevators are periodically inspected and are subject to certification for safe operation. Preferably, a solution should not invoke extensive re-inspection or recertification. Therefore, changing the structural elements and safety components is not allowed. Furthermore, a solution may only add to or change the interior of the cabin and stay within a certain weight increase. The control panel, which is usually located in the elevator cabin, should remain untouched and unimpeded. Given these prerequisites, the envisaged design solution should cover only one wall surface in absence of the control panel and should reduce the ceiling height as little as possible.
The principle of the design is shown in Figure 2. To obtain a uniform distribution of the downward airflow in the elevator cabin, the air must be supplied from the ceiling in an evenly distributed manner. The required air is extracted from the elevator cabin using centrifugal fans at one of the cabin walls, which in the prototype are located about 0.5 m above the floor, and subsequently directed towards a ceiling plenum. The supply diffuser in the ceiling consists of a perforated metal plate with a flat HEPA filter mounted on top. For the prototype elevator cabin on which experiments were carried out, a 35 mm thick E12 filter with 99.5% efficiency was chosen, corresponding to a pressure drop of 100 Pa and a downward air velocity of 0.4 m/s.
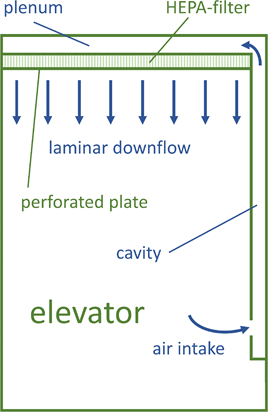
Figure 2. Schematic representation of elevator cabin with the downflow air system.
Due to height restrictions in the cabin, the plenum height should be as small as possible. A mathematical model for airflow in a manifold, as developed by Wang [8], was used to describe the airflow and pressure distribution in the plenum. A comparison with measurement results obtained from a mock-up showed that theory and experiment are in good agreement. With this model, the distribution of the air supply across the ceiling surface can be predicted.
Using acoustic measurement equipment by Innovation Handling, see Figure 3, the flow field in the elevator was spatially mapped. To present the measurement results, a cartesian xyz coordinate system was defined as shown in Figure 4. The elevator door is located on the right side of the figure. Results for vertical air velocity are presented in the xy plane at a height of 1.5 m, in the XZ plane at the centre of the elevator (y = 0.55 m) and in the yz plane at two positions (x = 0.6 m and x = 1.2 m). With the elevator door closed, see Figure 5, these measurements show a uniform and downward velocity field from about 0.6 m above the floor. The vertical air speed is between approximately 0.25 m/s and 0.40 m/s. When the elevator is occupied by passengers, the air velocity is higher due to the smaller flow area. With an open elevator door, the air velocity is still downward but due to exchange through the doorway, the values are significantly lower than with a closed door. Finally, a duration measurement was performed with the sensors at a fixed height positioned in the centre of the elevator. These measurements were divided into three periods: 1) activity with people entering/leaving and the elevator door opening and closing regularly, 2) elevator door closed with two people inside, and 3) activity as in the first period with an average of four people in the elevator. The results in Figure 6 show the vertical air velocity as a function of time at different heights.
It follows from these measurements that at a height > 0.7 m above the floor, the air velocity and direction of the flow is in all cases directed downward and has a velocity of at least 0.25 m/s.
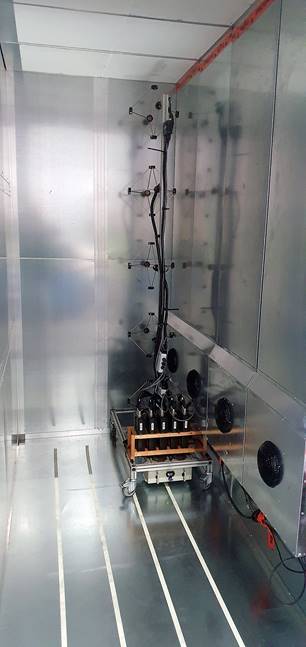
Figure 3. Test elevator cabin with setup for air velocity measurements. On the right side of the picture four centrifugal suction fans in the wall cavity are visible.
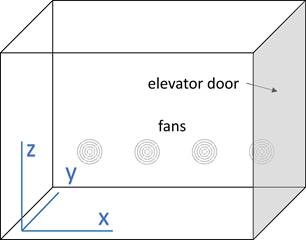
Figure 4. Schematic representation of elevator cabin and imposed coordinate system (origin in the corner).
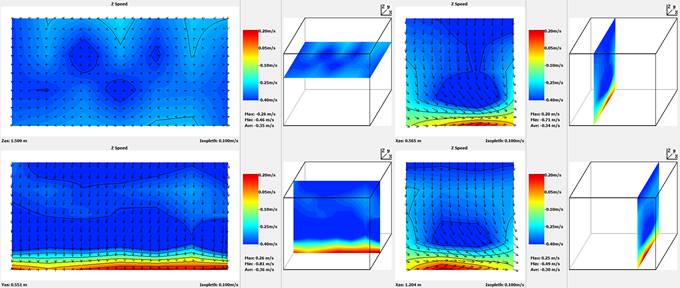
Figure 5. Measured vertical air velocity in the elevator with the elevator door closed.
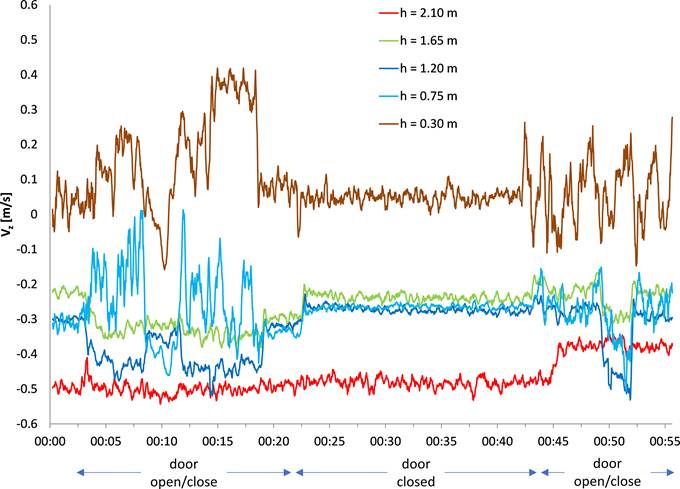
Figure 6. Measured vertical air velocity in the elevator as a function of time at different activities.
To validate the system's ability to remove aerosols emitted by elevator passengers, and thus its ability to limit airborne contamination, several experiments using artificially generated aerosols were carried out.
In these experiments a large quantity of aerosols was generated/released in the prototype elevator cabin at the start of a measurement. Subsequently the number of aerosols in particles size bins was measured as a function of time. These measurements were carried out by Prof. Daniel Bonn of the Institute of Physics, University of Amsterdam.
Aerosols were generated using an atomizer/spray bottle filled with an ethanol-glycerol mixture and fitted with a special spray nozzle, which generates aerosols like those released by people when talking or coughing. The generation rate of aerosols equals several people talking or coughing. Aerosols were measured using two methods:
· Laser diffraction. In this setup a laser sheet (laser beam in frame) is used to track the aerosols. Aerosols falling through the frame light up due to the laser light. The number of illuminated pixels is a measure of the number and volume of aerosols. Using a CCD camera and image analysis software, images can be made.
· Portable particle counter. This device draws a small amount of air from the elevator cabin by means of a probe, and the number of aerosols in the air sample is counted in size bins centred at 0.3 µm, 0.5 µm, 1.0 µm, 2.0 µm, 5.0 µm and 10.0 µm. The sample time used was 2 s.
Figure 7 visualizes the main results. The upper graph and picture show the decrease in aerosols over time in the elevator cabin with the downflow air system off. The lower graph and picture show the same measurements, but with the downflow air system active/on.
The following periods are indicated in the graphs:
· Red: background concentration is being measured (downflow system off in both cases).
· Green: aerosols are being generated using atomizer/spray bottle.
· Orange: decrease of aerosols is being measured. For the test with the downflow system off, the number of aerosols decreases due to deposition, evaporation, etc. For the test with the system on, the decrease is mainly due to the capture by the HEPA filter.
Based on these measurements, a characteristic decay time of 333 s was determined with the downflow system off, and 11 seconds with the downflow system on [9].
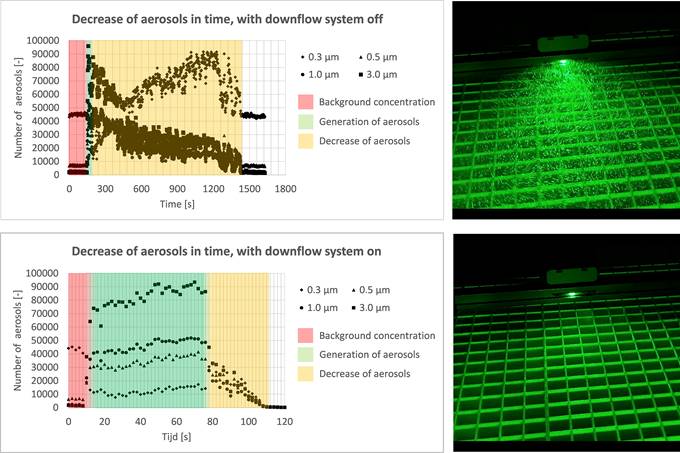
Figure 7. Results of the aerosol persistence measurements. Above left: change of counted aerosols over time, test elevator cabin with downflow air system off. Above right: photo of laser sheet with aerosols visible. Below left: change of counted aerosols over time, test elevator cabin with downflow air system on. Below right: photo laser sheet with no aerosols visible.
The aerosol falling curve measurements were used to obtain insight into the falling curve and the horizontal distance that aerosols emitted by passengers can travel. More specific, these measurements indicate the necessary distance between people in an elevator cabin to limit possible airborne transmission.
With a constant aerosol source placed in the elevator cabin, the number of aerosols at various distances from the source were determined. The used aerosol generator atomizes a NaCL 0.9% solution and mainly produces aerosols smaller than 1.0 µm. These were released in the elevator cabin with the hose outlet located at 1.5 m height. The number of generated aerosols corresponds to several people talking and coughing. The aerosols were measured using the described portable particle counter with a sample time of 5 s and sorted into 6 bins.
Figure 8 visualizes the main results. The graph shows the number of aerosols in the 0.3 µm bin at the source location and at a horizontal distance of 25, 50, 75 and 100 cm from the source. Measurements were performed at downflow air velocities of 0.2 m/s, 0.3 m/s and 0.4 m/s. Besides all the individual measurements (data points), the data for each downflow air velocity are also averaged (lines).
The figure shows that the number of aerosols decreases from approximately 500,000 at the source to almost zero at 0.25 m distance, for a downflow air velocity >0.3 m/s. These measurements therefore show that a distance of 0.25 m or more between persons will greatly reduce the risk of airborne transmission.
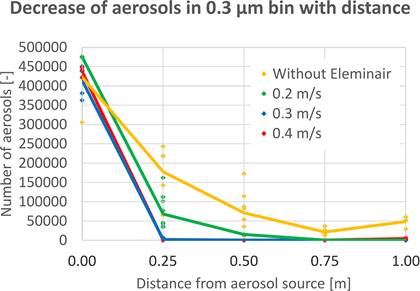
Figure 8. Results of the aerosol falling curve measurements.
The first Eleminair system has recently been installed in ‘The Edge’ building in Amsterdam, see Figure 9. Three 0.58 m wide modules were installed side by side with a ceiling plenum length of 2 m. In comparison to the prototype, the ventilators have been positioned at a higher position, yielding a sleeker design and thus more clearance in the passenger zone. Furthermore, a pre-filter in the wall cavity has been included to limit fouling of the HEPA filter. The modules are equipped with lighting and sensors that monitor airflows and check the contamination levels of the filters. One of the modules is equipped with a central display indicating the operation of the system. An alarm message is displayed in case of a malfunction. In addition, a notification can be sent to the BMS and the installation can be monitored and managed remotely, for example to signal in time filter replacements. After installation of the system, the maximum allowed occupancy of the elevator increased from 2 to 8 persons, i.e., a fourfold increase in the vertical transportation capacity.
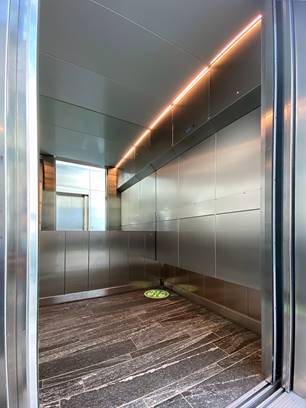
Figure 9. Implementation of the Eleminair system in an elevator in ‘The Edge’ building.
Based on the experimental results described in this paper, it is concluded that the Eleminair system meets the set requirements and that an elevator cabin with this system installed can be used in a safe manner if a minimum distance of approximately 0.5 m between elevator passengers is observed. A European patent application has been filed for the system.
[1] W.F. Wells (1934). On air-borne infection. American Journal of Epidemiology 20(3).
[2] J. W. Tang et al (2013). Airflow Dynamics of Human Jets: Sneezing and Breathing - Potential Sources of Infectious Aerosols. PLOS ONE, April 2013.
[3] W.H. van der Spoel et al (2020). Een 1,5 meter-samenleving: kan dit naar 1 meter-samenleving of moet het juist meer zijn? TVVL Magazine February 2021.
[4] C. van Rijn et al (2020). Reducing aerosol transmission of SARS-CoV-2 in hospital Elevators, Indoor Air 30(6).
[5] Peter V. Nielsen (2009). Control of airborne infectious diseases in ventilated spaces, Journal of The Royal Society Interface, Vol. 6.
[6] C. Yang et al (2015). The ventilation needed to control thermal plume and particle dispersion from manikins in a unidirectional ventilated protective isolation room. Building Simulation, 8: 551–565.
[7] J. Halitsky (1989). A Jet Plume Model for Short Stacks, JAPCA, 39:6, 856-858.
[8] J. Wang (2011). Theory of flow distribution in manifolds. Chemical Engineering Journal, 168(3).
[9] D. Bonn (2020). Rapport van de metingen in een liftcabine (Interland Techniek/ABT, Waalwijk).
Follow us on social media accounts to stay up to date with REHVA actualities
0