

Stay Informed
Follow us on social media accounts to stay up to date with REHVA actualities

|
|
Yunus Emre Cetin | Martin Kriegel |
Hermann-Riestchel-Institut, Chair of Energy, Comfort and Health in Buildings, Technische Universitaet Berlin, Berlin, Germanyy.cetin@tu-berlin.de | Hermann-Riestchel-Institut, Chair of Energy, Comfort and Health in Buildings, Technische Universitaet Berlin, Berlin, Germany |
The novel coronavirus COVID-19 pandemic impinged millions of people [1]. Overwhelming numbers of reported cases brought into attention the importance of preventive strategies to alleviate the propagation of extremely infectious diseases. Multiple guidelines have raised the concern on the indoor airborne transmission of COVID-19 and many recommendations have been released by organizations [2–4]. These recommendations and strategies in terms of building, room, and personal scale have been reviewed and discussed from different perspectives [5–7]. In this context, infection risk assessment is considered a useful tool that may help to quantify and compare the effectiveness of corresponding infection control measures.
Wells-Riley [8,9] and dose-response models are known as two fundamental approaches in infection risk modelling for ventilated indoor enclosures. In general, the infection risk is characterized by a probability between 0 to 1. Models preferred can provide a quantitative risk assessment to deal with the ongoing epidemic and help to comprehend possible results of varying circumstances. The Wells-Riley model is a simple and quick approach based on the quantum concept, which also considers infectivity and source strength. The infection risk prediction with the Wells Riley assumes that the pathogens are homogeneously distributed in a room. The dose-response model on the other hand can provide more precise and realistic outputs than the Wells-Riley model. Nevertheless, this model is less handy since it requires infectious dose data to construct the dose-response relationship [10,11].
The Wells–Riley model and its modifications have been extensively used for the investigation and evaluation of the infection risk of numerous ventilated environments from different perspectives [12–17]. In corresponding studies, key parameters of the Wells-Riley model like quantum generation and breathing rate are evaluated mostly as a constant. In fact, these fundamental parameters have a varying character and considering them as a constant may result in misleading conclusions. Also, the effect of preventive measures on infection risk mitigation was rarely inspected and compared in a quantitative way. Hence, the motivation of this study is to evaluate the effect of different infection preventive strategies by employing the Wells-Riley model in which the probability distributions of unknown parameters are considered. For this purpose, the stochastic Monte Carlo approach is used to broaden the representativeness of the results. The effect of displacement ventilation, standalone air cleaners, installing partition, upper room UVGI systems, and wearing N95 masks are evaluated. The findings can be used in the ongoing struggle against COVID-19 by helping to understand effective countermeasures in infection.
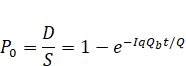
The Wells-Riley equation is mainly described as follows:
| (1) |
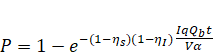
where P0 is the probability of infection, D is the number of cases, S is the number of susceptible, I is the number of infectors, q is the quanta emission rate by one infector (quanta/h), Qb is the breathing rate of the susceptible person (m³/h), and Q is the volume flow rate of pathogen free air (m³/h). In this study, the above version of the Wells-Riley equation is modified to include the use of N95 masks, air cleaners, displacement ventilation, partition, and UVGI system. The modified equation is given as follows:
| (2) |
In this equation, ηs and ηI represents the mask filtration efficiency of the susceptible and infected persons respectively. V is the volume of the room (m³) and α expresses the equivalent air change rate (given in Eq.3) which depends equivalent ventilation air change rate (λvent), inactivation rate of ultraviolet germicidal irradiation (kUV), and natural inactivation (kinact).
| (3) |
The equivalent ventilation rate (λvent) includes the air supply rate of the HVAC system (λHVAC) and portable air cleaners (λPAC). Here, in order to reflect the imperfect mixing case in different ventilation concepts like displacement ventilation an additional ventilation parameter (εHVAC) is also included to this equation as seen below. This additional ventilation parameter is equal to one for a perfect mixing situation which is one of the main assumptions in Wells-Riley consideration. A similar factor is also employed in another modification of Wells-Riley by Sun and Zhai [14].
| (4) |
Air supply rate of the HVAC system (λHVAC) is composed of supplied air flow rate of outdoor air (λoutdoor) and recirculated air (λrecirculated). It is given in the following form:
| (5) |
where ηfilter is the filtration efficiency of the filters.
Three different base cases namely an elderly nursing home, a waiting area at the doctor’s office, and a classroom are evaluated. Layouts, occupancy levels, duration of stay, ventilation configurations are assigned based on literature and the most typical real practices. Definitions and details regarding corresponding cases are given in Table 1.
Table 1. Settings of the studied cases.
Space | Elderly nursing home | Waiting area at doctor’s office | Music lesson in a classroom | Corridor in a school | Gym in a school |
Duration of stay (min) | 60 | 60 | 60 | 15 | 90 |
Number of total people | 2 | 10 | 25 | 40 | 25 |
Volume of space (m³) | 3x4x2.7 | 4x5x2.7 | 5x8x3.2 | 30x1.25x3.2 | 15x27x5.5 |
Outdoor ventilation rate (l/s) | 8.6 | 44 | 137 |
| 452.5 |
Quanta generation (h−1) | 58±31 | 58 ± 31 | 970±390 | 251±134 | 492±270 |
Breathing rate (m³/h) | 0.3±0.2 | 0.3± 0.2 | 1.3±0.85 | 1.3±0.85 | 2.5±1.75 |
Two critical parameters in the Wells-Riley equation are quanta generation rate (q) and breathing rate(p). The quantum generation rate depends on disease type, infector activity, etc., and varies significantly [18]. In this study, the quantum generation rate is adapted from the studies of Shen et al. [19], Millet et al. [20], and Hartmann et al. [21]. Breathing rates are assigned up to the activity levels. In each scenario, only one infectious pathogen emitter exists. It is also assumed that the infectious aerosols become evenly distributed throughout the space promptly. Quantum generation and breathing rates are assumed to follow the normal distribution. Variations of these inputs are applied by using the stochastic Monte Carlo approach on the calculations. In every setup, 50,000 trials are simulated.
Minimum outdoor ventilation rates are calculated in accordance with Ashrae Standard 62.1 [22]. In these calculations space area and occupant number are taken into account as seen in the following form:
| (6) |
where Rp is the outdoor airflow rate required per person (L/s), Pz is the occupant number, Ra is the outdoor airflow rate required per unit area (L/s), and Az is the net floor area (m²). Required airflow rates are determined by the minimum ventilation rates presented in Ashrae Standard 62.1 [22].
For the base cases mixing ventilation (εHVAC = 1) is applied. The fraction of outdoor ventilation on the air supply rate of the HVAC system is specified as 25% [23]. The filtration efficiency of the filters (ηfilter) in recirculation is considered as 70% [22]. Natural inactivation is assumed to have a uniform distribution between 0 and 1 h−1.
For the base cases mixing ventilation (εHVAC = 1) is applied. The fraction of outdoor ventilation on the air supply rate of the HVAC system is specified as 25% [23]. The filtration efficiency of the filters (ηfilter) in recirculation is considered as 70% [22]. Natural inactivation is assumed to have a uniform distribution between 0 and 1 h−1.
At first, infection probability is calculated for the base cases. Then, six different mitigation strategy is applied, and the effect of these strategies is evaluated individually. Proposed strategies are as follows:
· Increased outdoor ventilation rate is analysed by employing 100% outdoor air.
· Air distribution patterns affect the ventilation factor (εHVAC) considerably. Displacement ventilation has the potential to reduce the exposure in the breathing region so it is considered with a factor of 1.2 to 2 [24].
· Installing partition is considered by a factor of 1.1 – 3 [24].
· Portable air cleaners are becoming popular recently. The use of such air cleaners is assumed to supply clean air with a rate of 12 m³/h per square meter, which is suitable with the current EPA guide [25].
· Proper use of an upper room UVGI system is assumed to provide an air change rate of 2 to 6 h−1[26].
· N95 masks can filter the droplets significantly. Filtration efficiency for both susceptible and infected persons is assumed as between 70% to 95% [27,28].
The calculated infection rates for the base cases are shown in Table 2. The infection probabilities over 10% are considered as high risky spaces and these values are bolded. As it is observed, infection rates indicate a large variation in considered cases. The least risky space is found as the waiting area at the doctor’s office. As a result of the excessive quanta generation rate the music class configuration shows the highest infection risk potential (40%) among evaluated scenarios. As a result, it can be said that without any mitigation strategy all the cases apart from the waiting area show a considerable risk in terms of infection probability.
Table 2. Infection probabilities for base cases.
Space | Infection probability (%) | |
Mean | SD | |
Elderly nursing home | 14 | 11 |
Waiting area at doctor’s office | 3.4 | 2.8 |
Music lesson in a classroom | 40 | 23 |
Corridor in a school | 32 | 22.6 |
Gym in a school | 24 | 18.4 |
Infection risk probabilities under different mitigation measures for the nursing home, waiting area, classroom, corridor, and gym are depicted in Figure 1, Figure 2, Figure 3, Figure 4, and Figure 5 respectively. Mean value of the situational reproduction number (RS = P·S) [28] in each case is also given in these figures. RS points out the infection spreading in community. If RS > 1 it is considered that an epidemic occurred.
In general, it is seen that all the measures help to decrease the infection probability to some extent. For the nursing home shown in Figure 1, the average infection probability decreases about 17% when the supply air is 100% outdoor originated. Nevertheless, in this case, the average infection risk is still higher than the threshold level with an 11.6% infection probability. All the other measures help to reduce the infection risk between 30% to 98%. In all these cases average infection risk is reduced to below 10% and the limit is met. Also, since the RS > 1 in all cases the spread of the disease is unlikely for the nursing home.
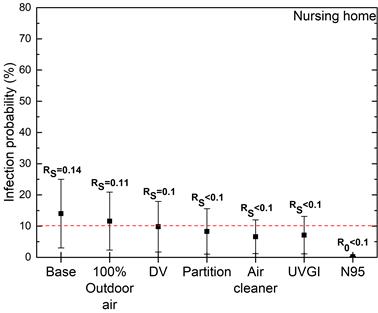
Figure 1. Infection risk predictions for the nursing home.
As seen in Figure 2, in the case of the waiting area considered measures alleviated the infection probability in the range of 23-99%. In this case, the lowest risk reduction is obtained with the use of 100% outdoor air, and the highest reduction is with the N95 face masking as expected. Both the values of infection probability and RS point out that the lowest risk is obtained for the waiting area at doctor’s office.
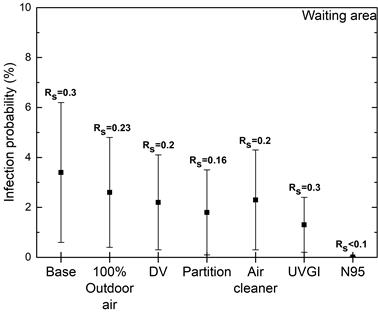
Figure 2. Infection risk predictions for the waiting area.
Infection risk predictions for the classroom, corridor and the gym are given in Figure 3, Figure 4 and Figure 5 respectively. It is deduced from the findings that the evaluated measures are not adequate in terms of attaining the threshold limit mostly. In all three cases high reproduction number (RS > 1) points a risk of serious outbreak. In every evaluated configuration, the use of N95 masks meets the threshold value and stands as the only solution for the lowest infection probability. Still, it should be noted that it might not be a feasible solution in a music class. Also, for a deeper analysis of the mask efficiency leakage during inhalation and exhalation can be considered in terms of personal protection related factor [28]. For an efficient reduction of the infection risk, the combined effect of the multiple measures can also be evaluated with including feasibility and cost considerations.
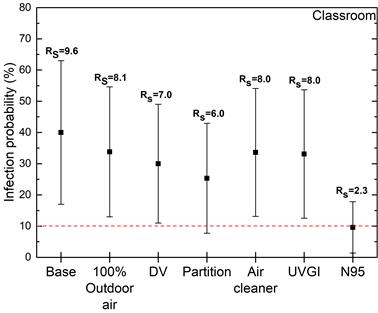
Figure 3. Infection risk predictions for the classroom.
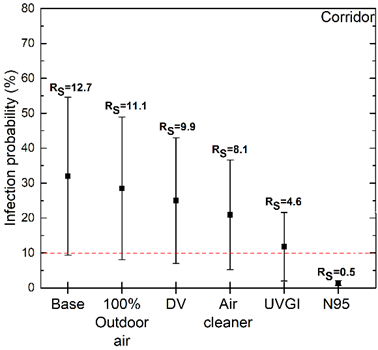
Figure 4. Infection risk predictions for the corridor.
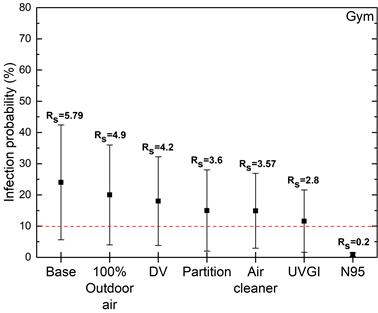
Figure 5. Infection risk predictions for the gym.
In the present paper, possible infection preventive measures were analysed for five different settings by employing the well-known Wells-Riley model. Increased outdoor ventilation rate, displacement ventilation, installing partition, portable air cleaners, UVGI systems, and N95 face masks were evaluated. Related model parameters were determined based on the literature and practices. The stochastic Monte Carlo approach was used in calculations in order to include the variations of the input parameters. Future studies can evaluate the combined effect of different risk-mitigating factors from a feasibility and cost standpoint.
Important outcomes are summarized below:
· Predicted infection risk values show a deviating figure depending on the boundary conditions of the cases.
· Based on the evaluated measures risk reduction is possible between 15.5 to 99%.
· Infection risk-mitigating measures lower the probability although this may not be sufficient to achieve the predetermined limit for some cases.
· The use of N95 masks may reduce the infection risk remarkably. This potential can be considered as an easy option for complicated cases at first instance.
This study is supported by The Federal Institute for Research on Building, Urban Affairs and Spatial Development with funding code of SWD-10.08.18.7-20.02.
[1] WHO. WHO Coronavirus (COVID-19) Dashboard https://covid19.who.int/.
[2] REHVA. COVID-19 Guidance Document v4.1. Brussels: 2021.
[3] ASHRAE. Core Recommendations for Reducing Airborne Infectious Aerosol Exposure 2021. https://www.ashrae.org/file library/technical resources/covid-19/core-recommendations-for-reducing-airborne-infectious-aerosol-exposure.pdf.
[4] RKI. Alle Daten und Empfehlungen des RKI www.rki.de/covid-19.
[5] Bu Y, Ooka R, Kikumoto H, Oh W. Recent research on expiratory particles in respiratory viral infection and control strategies: A review. Sustain Cities Soc 2021;73:103106.
[6] Agarwal N, Meena CS, Raj BP, Saini L, Kumar A, Gopalakrishnan N, et al. Indoor air quality improvement in COVID-19 pandemic: Review. Sustain Cities Soc 2021;70:102942.
[7] Zivelonghi A, Lai M. Mitigating aerosol infection risk in school buildings: the role of natural ventilation, volume, occupancy and CO2 monitoring. Build Environ 2021;204:108139.
[8] Riley EC, Murphy G, Riley RL. Airborne spread of measles in a suburban elementary school. Am J Epidemiol 1978;107:421–32.
[9] Wells WF. Airborne Contagion and Air Hygiene. Cambridge MA: Cambridge University Press; 1955.
[10] Sze To GN, Chao CYH. Review and comparison between the Wells-Riley and dose-response approaches to risk assessment of infectious respiratory diseases. Indoor Air 2010;20:2–16.
[11] Zhang S, Lin Z. Dilution-based evaluation of airborne infection risk - Thorough expansion of Wells-Riley model. Build Environ 2021;194:107674.
[12] Escombe AR, Oeser CC, Gilman RH, Navincopa M, Ticona E, Pan W, et al. Natural ventilation for the prevention of airborne contagion. PLoS Med 2007;4:0309–17.
[13] Kriegel M, Buchholz U, Gastmeier P, Bischoff P, Abdelgawad I, Hartmann A. Predicted infection risk for aerosol transmission of sars-COV-2. MedRxiv 2020:2020.10.08.20209106. https://doi.org/10.1101/2020.10.08.20209106.
[14] Sun C, Zhai Z. The efficacy of social distance and ventilation effectiveness in preventing COVID-19 transmission. Sustain Cities Soc 2020;62:102390.
[15] Srivastava S, Zhao X, Manay A, Chen Q. Effective ventilation and air disinfection system for reducing coronavirus disease 2019 (COVID-19) infection risk in office buildings. Sustain Cities Soc 2021;75:103408.
[16] Foster A, Kinzel M. Estimating COVID-19 exposure in a classroom setting: A comparison between mathematical and numerical models. Phys Fluids 2021;33.
[17] Khankari K. Analysis of spread of airborne contaminants and risk of infection. ASHRAE J 2021;63:14–20.
[18] Buonanno G, Stabile L, Morawska L. Estimation of airborne viral emission: Quanta emission rate of SARS-CoV-2 for infection risk assessment. Environ Int 2020;141:105794.
[19] Shen J, Kong M, Dong B, Birnkrant MJ, Zhang J. A systematic approach to estimating the effectiveness of multi-scale IAQ strategies for reducing the risk of airborne infection of SARS-CoV-2. Build Environ 2021;200:107926.
[20] Miller SL, Nazaroff WW, Jimenez JL, Boerstra A, Buonanno G, Dancer SJ, et al. Transmission of SARS-CoV-2 by inhalation of respiratory aerosol in the Skagit Valley Chorale superspreading event. Indoor Air 2021;31:314–23.
[21] Hartmann A, Lange J, Rotheudt H, Kriegel M. Emission rate and particle size of bioaerosols during breathing, speaking and coughing. Preprint 2020:1–5.
[22] ASHRAE. ASHRAE Standard 62.1-2019 Ventilation for Acceptable Indoor Air Quality 2019.
[23] Persily A, Gorfain J. Analysis of Ventilation Data from the U.S. Environmental Protection Agency Building Assessment Survey and Evaluation (BASE) Study. 2004.
[24] Zhang J. Integrating IAQ control strategies to reduce the risk of asymptomatic SARS CoV-2 infections in classrooms and open plan offices. Sci Technol Built Environ 2020;26:1013–8.
[25] U.S. EPA. Guide to Air Cleaners in the Home. 2018.
[26] ASHRAE. ASHRAE Handbook - HVAC Applications. 2019.
[27] Dugdale CM, Walensky RP. Filtration Efficiency, Effectiveness, and Availability of N95 Face Masks for COVID-19 Prevention. JAMA Intern Med 2020;180:1612.
[28] Kriegel M, Hartmann A, Buchholz U, Seifried J, Baumgarte S, Gastmeier P. SARS-CoV-2 Aerosol Transmission Indoors: A Closer Look at Viral Load, Infectivity, the Effectiveness of Preventive Measures and a Simple Approach for Practical Recommendations. Int J Environ Res Public Health 2021;19:220.
Full article: https://proceedings.open.tudelft.nl/clima2022/article/view/299
Follow us on social media accounts to stay up to date with REHVA actualities
0