
Stay Informed
Follow us on social media accounts to stay up to date with REHVA actualities
|
Maaike Marie-Louise Leichsenring |
Delft University of Technology, mleichsenring@hotmail.com |
Two-phase behaviour of fluids is not yet fully understood by science, resulting in overor under- estimating by several published heat transfer and pressure drop correlations for plate heat exchangers, which are limited by the range of conditions they cover [1]. Reference [2] concludes that better predictions of flow patterns in plate heat exchangers will improve the calculation of heat transfer and pressure drop. Flow patterns are determined visually by an experimental setup where the flow is observed through a transparent plate.
Flow patterns are defined by the geometric configurations of vapor and liquid and are classified into four main flow patterns: bubbly, slug, churn and film flow. It is expected that the various flow patterns relate to different forms of heat transfer inside condensers. A flow pattern map (FPM) helps distinguish the various regimes in a graphical way. Reference [2] created an FPM for two-phase vertical downward flow in plate heat exchangers including the fluid property modifying group Λ [-], see (1), that enables the inclusion of fluid properties into the FPM. The parameter is defined as a function of the liquid properties relative to those of water under the same conditions:
| (1) |
where the fluid properties µ, ρ and σ represent the dynamic viscosity, density and viscosity. The subscript L represents the liquid of the fluid and w represents water at the same operational conditions. The axes of the FPM make use of dimensionless groups: the liquid Reynolds number ReL [-] and the two-phase Froude number FrTP [-]. The liquid Reynolds number represents the ratio of inertia forces over viscous forces and is defined by (2):
| (2) |
Where G [kgm-²s-¹] is the total mass flux, x [-] the vapor quality and dh [m] the hydraulic diameter. The two-phase Froude number represents the ratio of inertia to gravity and is expected to play a role in vertical plate heat exchangers and is defined by (3):
| (3) |
Where g [kgs-²] represents the gravitational constant. Flow visualization of pure ammonia condensing flow inside a corrugated vertical plate heat exchanger has not been investigated previously. This study compares the results of pure ammonia flow visualization in a vertical downward PHE to the FPM constructed by [2]. This article explains the experimental setup and the performed research to enable the construction of a durable transparent test plate. The test procedure, experimental results and discussions are presented.
In cooperation with the Delft University of Technology, Bluerise B.V. constructed a small-scale test plant to test the performance of a cycle for Ocean Thermal Energy Conversion (OTEC) purposes, which contains similar components to that of a refrigeration cycle. The 100 W OTEC-demo consists of an Organic Rankine cycle using pure ammonia as the working fluid. Figure 1 shows a schematic representation of the experimental setup. Pure ammonia is vaporized while flowing through the evaporator due to the counter current hot water flow. The two-phase ammonia is condensed in the Gasketed Plate Heat Exchanger (GPHE) by a cold-water stream from the cold-water tank.
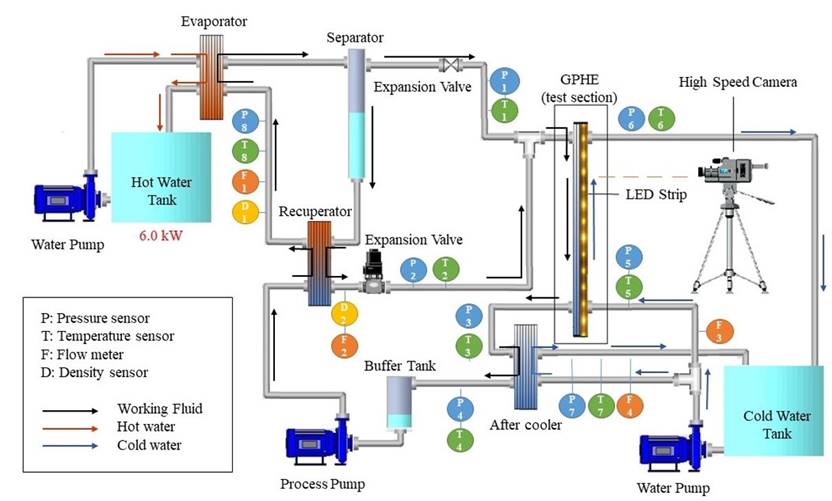
Figure 1. Experimental setup diagram of OTEC demo cycle.
The test section is a GPHE, containing a cold-water channel and a working fluid channel. The PHE includes a 95 cm × 12.5 cm transparent corrugated polymer plate that enables visualization of the condensing ammonia on the working fluid side. The visualization plate is a hybrid plate where the top layer consists of Polystyrene to act as a chemical barrier between the ammonia and the thick plexiglass plate. The plate is illuminated by a 500 cm LED strip including 300 LED’s that encircles the plate from its sides twice. A 3000 fps high speed camera is placed in front of the visualization plate to capture the flow patterns under varying operating conditions. Figure 2 shows the visualization section including pressure plate and illumination and the placement of the camera.
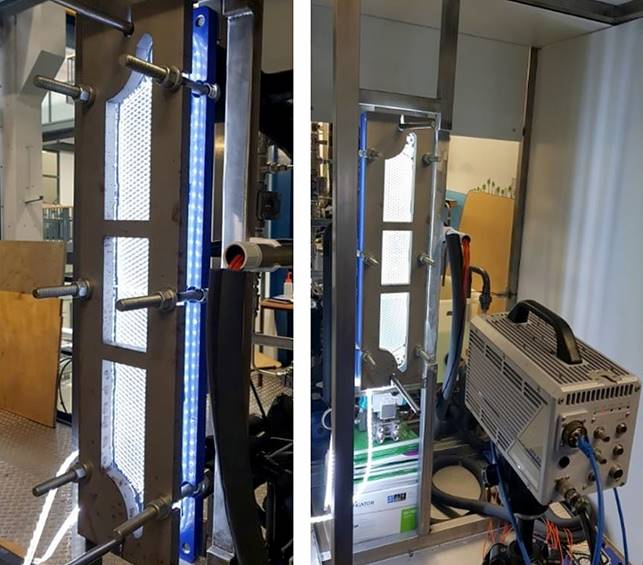
Figure 2. Left: Visualization section. Right: Visualization section and position high speed camera.
The ammonia mass flux Ga [kgm-²s] is determined by (4). The ammonia mass flow ṁa [kgs-¹] is measured by flow meter F1, see Fig. 1. The flow passage area Af [m²] is calculated by multiplying the effective heat transfer width Lw [m] with the channel gap dg [m].
| (4) |
The single-phase condition at the outlet of the after cooler is used to determine the enthalpy of the liquid ammonia. The average vapor quality x̅ [-] inside the GPHE is determined by (5), where xin [-] and xout [-] represent the vapor qualities at the in- and outlet of the condenser. An energy balance is used to determine the two-phase enthalpy at the inlet of the after cooler, which is assumed to be the same as the enthalpy at the outlet of the GPHE. A second energy balance determines the enthalpy of the ammonia at the inlet of the GPHE hin [kgkJ-¹] which is determined by (6). hL,sat [kgkJ-¹] and hV,sat [kgkJ-¹] represent the saturated liquid and vapour phase enthalpy of the ammonia at the inlet conditions of the condenser.
| (5) |
| (6) |
Experiments are performed where the mass flux Ga is kept constant and the vapor quality xin is increased. Both the influence of the mass flux and inlet quality on the flow configurations are recorded for the top, middle and bottom windows.
For all recorded conditions, a framerate of 3000 fps with a resolution of 1024 × 1024 pixels is used. The transparent plate remained intact for 7 days, but on the 8th day of performing experiments degradation in the material was visible in the form of small cracks in the PS surface and crystal shaped spots between the PS and PMMA layer that grew in size over time. It is concluded that PS has a limited durability when in contact with pure ammonia.
For all performed experiments, no bubbles, slugs or churns were detected, and only film flow and partial film flow are observed. The path of the flow remained similar under the various circumstances. Due to the shapes of the distribution zone at the inlet, the liquid flow is pushed to the left which causes most of the liquid flow to disperse over the left upper diagonal of the window. It is expected that in that zone also vapor is present, but less than in the lower diagonal. The area of the upper diagonal covered by mainly a rough liquid film decreases for smaller mass fluxes. This area is indicated by the zones that reflect light in various directions. Most of the vapor flows at the lower diagonal of the top window, indicated by a still image. In the middle window the corrugation direction switches and this sudden change in flow direction causes the liquid to evenly distribute over the corrugations in the lower part of the middle window. Less vapor is detected. The bottom window is mostly covered in a smooth liquid film.
A distinction can be made between film flow and partial film flow. Film flow includes a liquid layer on both plates while partial film flow leaves dry zones when the amount of liquid film is limited and unable to cover the entire plate. If partial film flow occurs in the GPHE and dry zones are present on the transparent plate, an opaque surface will be visible. The dry zones are indicated by a black circumference, see Figure 3 and Figure 4. Only the top window is represented in the figure since this window shows the varying configurations most clearly.
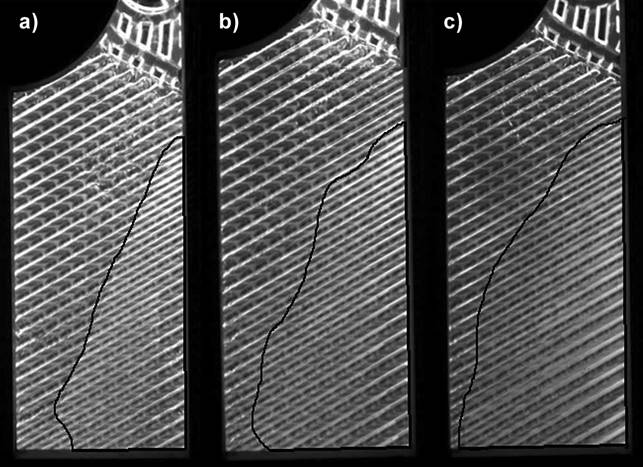
Figure 3. x̅ = 0.31 [-]. a) G = 43 [kgm-²s-¹]. b) G = 64 [kgm-²s-¹]. c) G = 81 [kgm-²s-¹].
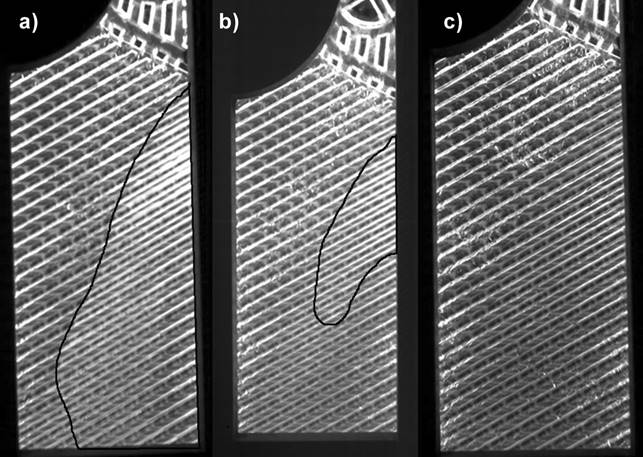
Figure 4. G = 43 [kgm-²s-¹]. a) x̅ = 0.22 [-]. b) x̅ = 0.48 [-]. c) x̅= 0.62 [-].
Figure 3 shows that for a constant vapor quality but increasing mass flux the dry zone decreases. Figure 3 a, b indicate partial film flow by the occurrence of the dry zone. Figure 3 c shows that for an increased mass flux of 81 kgm-²s-¹, the dry zone disappears, i.e. indicating film flow. This indicates that the mass flux G has a strong influence on the flow pattern transition from partial film flow to film flow. A low mass flux shows smooth liquid film characteristics, indicated in the upper left diagonal of Figure 3 a by a clear image. For increasing mass flux, the film transitions to rough film characteristics, see Figure 3 c, indicated by the strong light reflectance of the left upper diagonal. Figure 4 shows that for a constant mass flux and an increasing vapor quality the area of the dry zone increases. This only occurs for lower mass fluxes and within partial film flow only.
The operating conditions of the experiments are represented in Figure 5. It shows an FPM generated by [2] for plate heat exchangers that makes use of the dimensionless quantities ReL and FrTP which account for gravity, viscous forces and inertia. This construction is based on results from previous visualization experiments for two-phase vertical downward flow of mainly air-water mixtures in plate heat exchangers. The dimensionless fluid property modifying parameter Λ is included on the Y-axis to correct for fluid property deviations of other fluids such as refrigerants. This parameter is included to widen the applicability of the map from air-water to multiple fluids, such as refrigerants. For the experimental conditions of the flow visualization experiments in this research, the map predicts churn flow. The results of the flow visualization experiments show film and partial film flow, which indicates that this map is not yet applicable for ammonia flow pattern prediction.
An FPM for the downward condensing ammonia in the GPHE is constructed based on the parameters proposed by [2]. Figure 6 presents the proposed FPM for downward condensing ammonia inside a GPHE with a corrugation angle of β = 60°C. This map can be used to predict the occurring flow pattern of downward condensing ammonia in a PHE for operational conditions within the indicated limits. The dashed line describes the transition from partial film flow to film flow. An indication for rough film flow and smooth film flow is included that describe the transition from a smooth liquid film to a rough liquid film. More visualization studies with a wider range of experimental conditions on condensing flow of pure ammonia in vertical PHE’s are required to accurately describe the flow pattern behaviour of pure ammonia in this type of heat exchangers and to extend the applicability of FPMs for different fluids.
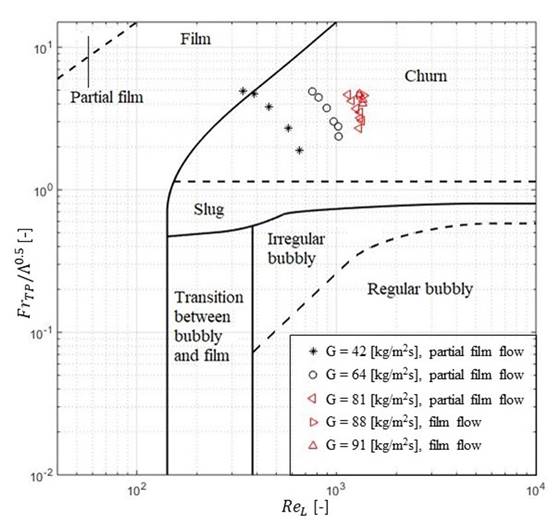
Figure 5. Experimental operating conditions shown in simplified flow pattern map of two-phase flow in PHEs by [2].
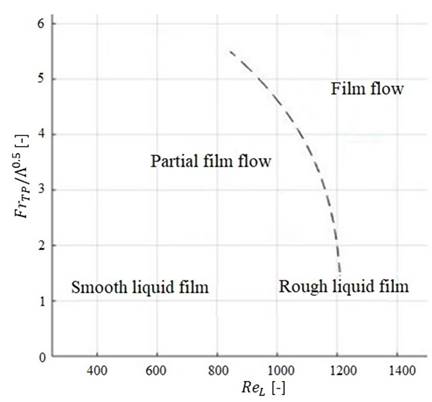
Figure 6. The proposed flow pattern map as a function of FrTP, Λ, and ReL for condensing ammonia inside a corrugated GPHE describing the transition from partial film flow to film flow.
Flow patterns are defined visually, therefore flow pattern classification remains subjective to this day. The approach of performing the experiments and the experimental conditions influence the judgement of the observer on how flow patterns are related to transition lines in the FPM. This note should be taken into account when forming PFMs or making assumptions on the flow pattern behaviour based on FPMs constructed from a limited number of experiments.
The flow morphology of pure ammonia in a vertical downward GPHE has been captured. A corrugated visualization plate is produced from transparent PS by a CNC-machine and has proven to be chemically compatible for seven days. For all conditions introduced, film flow and partial film flow are observed. An increased vapor quality increases the area of the indicated dry-zone (partial film flow) on the visualization plate. The mass flux determines the transition from partial film flow to film flow. Increasing the mass flux enhances the rough film flow, creating more liquid entrainment in the lower diagonal resulting in film flow. The operating conditions during the performed ammonia condensation experiments (liquid Reynolds number and two-phase Froude number) have been indicated in the FPM constructed by [2]. The results indicate that the FPM, which is mainly based on air-water experiments, is not applicable for condensing ammonia. For this reason, an FPM is proposed for condensing ammonia inside a corrugated GPHE describing the transition from partial film flow to film flow. The results of this study can be used to improve performance calculations of condensing ammonia in plate heat exchangers. More extensive visualization studies are required to:
· Extend the applicability of the FPM for different condensing fluids inside GPHE’s
· Improve two-phase correlations for ammonia on a large scale and therefore optimize heat exchanger designs used in HVAC/R systems.
I would like to acknowledge the financial support from the China Scholarship Council and Koudegroep Delft-Wageningen.
[2] X. Tao, M. Nuijten & C. Infante Ferreira, “Two-phase vertical downward flow in plate heat exchangers: Flow patterns and condensation mechanisms,” International Journal of Refrigeration, vol 85, pp. 489-510, 2018.
[1] Sponsored by EUROVENT, on May 27th 2021, in collaboration with ISHRAE, the HVAC World Student Competition 2020 took place online. The competition was held between the competitors representing ASHRAE (United States), ISHRAE (India), CCHVAC (China), SAREK (South Korea), and REHVA (Europe). The jury team members, Manuel Gameiro da Silva (REHVA), Jun Choi (SAREK), Joe Firrantello (ASHRAE), Narayanan Srikantan Chandrasekar (ISHRAE), and Angui Li (CCHVAC) were assigned to judge the performance and quality of the work of the competitors.
Follow us on social media accounts to stay up to date with REHVA actualities
0