


Stay Informed
Follow us on social media accounts to stay up to date with REHVA actualities

|
|
|
Janneke Ghijsels | Klaas De Jonge | Jelle Laverge |
Ghent University | Ghent University & FWO, Flanders Research Foundation (1SA7619N) | Ghent University |
In the recent decades there has been an increasing awareness that the energy demand for buildings must be greatly reduced. Today, our buildings are better insulated and high-temperature heating is replaced by low-temperature surface-heating. The stricter insulation standards ensure an energy reduction and a better thermal comfort. The disadvantage is that, if we only focus on the thermal comfort, an adverse effect will be induced on the indoor air quality (IAQ) of our homes. In old houses there is natural ventilation through cracks and crevices [1] but in more modern houses, that are build more airtight, the pollutants will accumulate in the indoor air. This creates a greater risk of concentration problems, fatigue and other serious health effects. Therefore, there is a need for a designed ventilation system that brings fresh air in and evacuates polluted air out of the home, preferably in a comfortable way.
A continuous, constant, airflow ventilation system will guarantee a good IAQ but will also provide more cold airflow that needs to be heated then strictly necessary to ensure comfort. This results in an increase of the energy use. The two main methods used in western-European residential ventilation systems to tackle this increase in energy use are the use of an air-to-air heat exchanger (heat recovery) and the use of pollution sensors to measure the indoor air quality and lower the ventilation flowrate when and where it is possible without comprising the indoor air quality: demand-controlled ventilation systems (DCV). A DCV system can reduce the heating energy related to ventilation and electricity use of the ventilation system by 20 to 50% [2].
Nowadays, the assessment of a DCV system only considers the perceived IAQ in terms of comfort criteria (such as CO₂, humidity and odour) [3]. However, the big disadvantage of a DCV system is the accumulation of indoor pollutants in times of low occupancy. When the airflow rates are reduced, the VOC emissions of building materials and furniture will accumulate in the indoor air, resulting in harmful VOC concentrations and a poor IAQ. Therefore, the assessment of a DCV system must be extended from only comfort criteria to both comfort and health criteria.
The simulation model is made in Dymola, an integrated environment for developing models in the Modelica language. This allows to simulate the combined effect of heat, moisture, airflow and indoor concentrations. In this study, the IDEAS library [4] is used in combination with proprietary models for modelling the airflows and pollutant sources. Figure 1 shows the floor plan of the modelled three-bedroom apartment. This typical Belgian apartment has already been used several times and has been described in Heijmans, Van Den Bossche, Janssens (2007); Laverge, Janssens (2013) and De Jonge, Janssens, Laverge (2018). During modelling, a lot of attention is paid to the multi-zone representation of the apartment, the building envelope, the elements of the various ventilation systems, the occupant schedules, the ventilation controls, the emissions from the occupant activities and the emissions from the building materials and furniture.
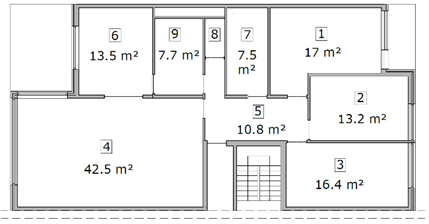
Figure 1. Floor plan of the reference apartment. Zone 1-4 are the dry spaces, zone 5-9 are the wet spaces.
The performance of two demand controlled mechanical extraction ventilation systems (DCV) are being compared to the performance of a continuous mechanical extraction ventilation system (MEV). The two DCV systems follow the same principles: fresh air is naturally brought into the dry spaces through trickle vents and will be mechanically extracted in the wet spaces. The first DCV system (DCV1) is a theoretical control system based on controls that can currently be found on the Belgian market. The ventilation flow rates (Q) are adapted on the one hand by a local detection and a local control in the wet areas. The bathroom is controlled on humidity, the kitchen on CO₂ and the toilet on VOC. Additionally, there are also extra CO₂-sensors in the dry spaces that will increase the extraction flow rate in the wet spaces if the CO₂-concentration in the dry spaces becomes too high. For the increase of the extraction flow rate only the dry space with the maximum CO₂-concentration will be considered. The increase of extraction creates negative pressure in the building which force more fresh air through the trickle vents resulting in a larger supply of fresh air in the dry spaces.
The second DCV system (DCV2) is also a theoretical control system based on controls that can currently be found on the Belgian market. The ventilation flow rates (Q) are, just like DCV1, adapted by a local detection and local control in the wet spaces. Supplementary to these extraction in the wet spaces, there is an additional extraction in the dry spaces based on local CO₂-sensors. Due to the direct extraction in the dry spaces, the amount of supply through the trickle vents can be guaranteed. In addition, the extraction works in two zones, namely the bedrooms and the living space. The zone with the highest CO₂-concentration will be controlled based on this concentration and the flow rate of the other zone is lowered to the minimal flow rate. In that way, the zone with the highest occupation, receives the highest ventilation flow rate.
The working principles of both DCV systems is graphical represented in Figure 2. The nominal ventilation flow rates according to the NBN-D50-001 are represented for each zone in Table 1. Qnom are the nominal flow rates for both systems and Qnom_addition are the nominal flow rates for the additional extraction in the dry spaces for DCV2. The zones are numbered like the floor plan in Figure 1. Lastly, the different sensors and their controls on the ventilation flow rates are represented in Table 2. The first four controls are for both DCV systems. The fifth and sixth control are respectively for DCV1 and DCV2.
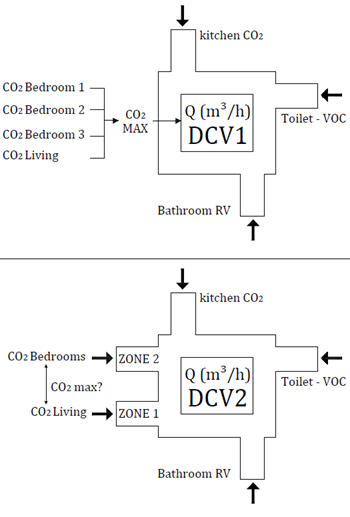
Figure 2. Graphical representation of the working principle of DCV1 and DCV.2.
Table 1. Ventilation flow rates.
Zone | Qnom | Qnom_addition, |
1: Bedroom | 43.92 | 25 |
2: Bedroom | 35.26 | 25 |
3: Bedroom | 38.88 | 25 |
4: Living room | 108.32 | 60 |
5: Hall | 16 | - |
6: Kitchen | 60 | - |
7: Bathroom | 60 | - |
8: Toilet | 30 | - |
9: service room | 60 | - |
Table 2. Controls.
Sensor | Control | Q (m³/h) | |
1. RV – Bathroom and service room | RV < 30% 30% < RV < 65% 65% < RV < 95% RV > 95% | 10 % 30 % 60% 100% | |
2. RV – Bathroom | ΔRV > 2% in 5min | 100% | |
3. CO₂ (ppm) Kitchen | CO₂ > 850 850 < CO₂ < 950 CO₂ > 950 | 10% Linear 100% | |
4. VOC – Toilet | No presence Presence | 10% 100% | |
5. CO₂ (ppm) DCV1 Max. of dry spaces | CO₂ < 1,000 1000 < CO₂ < 1,200 CO₂ > 1,200 | 10% Linear 100% | |
6. CO₂ (ppm)
DCV2 | Zone 1: zone with maximum CO₂-concentration. | CO₂ > 850 850 < CO₂ < 950 CO₂ > 950 | 10% Linear 100% |
| Zone 2: zone with smaller CO₂-concentration | - | 10% |
More than 100 indoor pollutants are currently identified as (potentially) hazardous to our health. To obtain a priority list of target pollutants, 7 large studies are reviewed, each a conclusion of many other studies. The most important study is the AIVC-CR17 [5] study where, for Belgium, the concentrations of harmful pollutants were measured in more than 400 homes. As a result, 6 indoor pollutants and 3 outdoor pollutants are prioritized for the Belgian residential application, namely benzene, formaldehyde, naphthalene, limonene, toluene and particulate matter (PM2.5) as indoor pollutants and (PM2.5), nitrogen dioxide (NO₂) and ozone (O₃) as outdoor pollutants. The concentration of the outdoor pollutants will be modelled as constants. In the future, this can be further investigated.
To allow a clear representation of which emissions are implemented for each pollutant, the emissions will be divided into three categories. namely emissions from building materials and furniture, emissions from occupants and emissions from occupant activities.
To determine the emissions of the building materials and furniture, it is assumed that the apartment is refurbished or newly built so that can be concluded that the floor and furniture are new. Therefore, all the emissions will be determined after a lifetime of 28 days. The furniture is calculated for an occupancy of two adults, two children and two babies. The furniture is considered wood, synthetic or gypsum. This means that only the pollutants benzene, formaldehyde, naphthalene and toluene are considered for these emissions. All the emissions of building materials and furniture are determined using the Pandora Database [6]. The summary of these emissions is given in Table 3. All these emissions are assumed to have a constant emission rate. One exception is made for the formaldehyde emission by the floor. The emission rate of the flooring is a dynamic source model based on the air temperature and relative humidity in the zone [7].
The impact of the occupant activities on the VOC concentrations is significant. To determine which activities must be implemented, the original occupant schedules, used in Belgian simulation studies for the determination of ventilation legislation [8], were reviewed. The original activities were cooking, showering and washing clothes and only the emission of moisture was recorded. Eventually, the activities were expanded with cleaning, washing dishes and using deodorant spray. The emissions of the activities, including the original activities, were expanded with limonene, naphthalene and particulate matter emissions. Existing research on emission values is very limited, which means that assumptions often must be made. When newer or more accurate research is published, the emission values can easily be adjusted in the model.
For cooking, PM2.5-emissions were added based on the relationship to the moisture emission in the study of Poirier et al (2021) [9]. Extensive cooking results in a greater moisture and PM2.5-production. Important is that the cooking emissions are considerably reduced by the implementation of a cooker hood with a flow rate of 200 m³/h and a capture efficiency of 0.7. This means that 70% of the emissions are captured by the cooker hood. For the activity of showering, the use of shampoo and shower gel was added, resulting in limonene [10] and naphthalene [11] emissions. For the activity of washing clothes, the use of washing liquid (wash pods of 27 gram) was added, resulting in limonene emissions [12]. For the use of deodorant, a PM2.5[13] and limonene [14] emission was added to the occupant itself. The occupant uses the deodorant 3 times a day (0.5 gram) and carries these emissions around the house. Also, the emissions for the activity cleaning, were added to the occupant itself. When the occupant is cleaning, moisture [15] and limonene [6] emissions are released into the air where the occupant is situated.
All these emissions are summarized in Table 4. The references are given in the text and in the table. For a more in-depth explanation on how the emissions are obtained, reference is made to “Health-based assessment method for residential DCV systems” by Janneke Ghijsels (2022).
Table 3. Summary of the emissions from building materials and furniture for each pollutant.
Emission [ug/h/m²] | formaldehyde | benzene | naphthalene | toluene |
Floor (wood) | 9.91 | negligible | negligible | negligible |
Furniture (wood) | 3.06 | 1.40 | 5.68 | - |
Door (wood) | 4.50 | - | - | - |
Other furniture (synthetic) | 3.00 | 2.00 | - | 11.00 |
Carpet | 4.27 | 0.21 | 0.47 | 0.20 |
Walls (gypsum) | negligible | negligible | negligible | 0.50 |
Table 4. Summary of the emissions from building materials and furniture for each pollutant.
Emission [ug/h/m²] | moisture | limonene | naphthalene | PM2.5 |
Cleaning (3) | 5.00 g/m²(floor) [15] | 1912 ug/h/m²(floor) [6] | - | - |
Cooking | 0.60 L/s * 1.00 L/s * 1.50 L/s * | -
| - | 1260 ug/min [9] 1910 ug/min 2550 ug/min |
Washing dishes | 4.20 e-04 L/s | 24.8 ug/h | - | - |
Showering | 0.50 L/s * | 1200 ug/h [10] | 3.76 ug/h [11] | - |
Deodorant use | - | 1438 ug/use [14] | - | 12 ug/use [13] |
Washing clothes | 6.50 x e-2 L/s * | 7833 ug/h [12] | - | - |
* CEN 14788: Ventilation of buildings - Design and dimensioning of residential ventilation systems
Occupants produce both CO₂, H₂O and human odour. The CO₂- and H₂O-emissions are shown in Table 5 for a metabolism (the degree of activity) equal to 1.6 met (very active). In the simulation these productions are scaled according to the metabolism of each occupant at each timestep.
Table 5. Emissions by occupants themselves.
Production | 1.6 met (light activity) |
CO₂-production - Adult - Child - Baby |
19.0 l/h * 12.6 l/h [16] 6.7 l/h * |
H₂O-production - Adult - Child - Baby |
55.0 g/h * 41.3 g/h [17] 18.3 g/h * |
* Norm CEN 14788 | |
To make a complete analysis of the impact of a DCV system on IAQ, the assessment method will be divided into two stages. The first stage is a health performance checklist that will rule out the possibility that the exposure concentrations cause harmful health effects for the occupants. If this criterion is not met, the controls can be adapted (e.g. increasing the nominal flow rates, increasing the minimal flow rates or adjusting the boundaries.)
When the quality of the indoor air is sufficient for the health of the occupants, the DCV system can be analysed by the second stage of this assessment method, namely the overall performance rating in terms of health and energy. A comparison will be made with the performance of the MEV reference system. In this way, a pareto optimum can be explored for each DCV system in which both the energy and health performance are better than the performance of the MEV reference system.
For the assessment of the health performance, a checklist will be followed in which first the exposure concentrations of each pollutant will be compared with the limit concentrations of the chosen exposure metrics. Both acute and chronic exposure concentrations will be checked to exclude both acute and chronic health effects.
The peak concentrations will be checked by the 10-minute AEGL-1 value (obtained by U.S. EPA) [18] and the average exposure concentrations over a time interval of 1 hour and 8 hours will be checked by the acute REL values (obtained by OEHHA) [19]. The chronic exposure concentrations will be checked by the chronic REL value. The summary of these limit concentrations is given in Table 6.
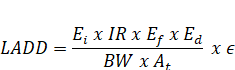
After the control of the exposure concentrations, the lifetime average daily dose (LADD) is calculated for each pollutant [20]. The formula of the LADD is given in equation (1). Because the LADD considers both body weight and inhalation rate it is possible to obtain an estimation of the health effects for sensitive occupants, for example babies.
Table 6. Emissions by occupants themselves.
Reference Cexposure (ug/m³) | 10 min AEGL-1 | Acute REL-1h | Acute REL-8h | Chronic REL |
Benzene | 415,000 | 27 | 3 | 3 |
Formaldehyde | 1105 | 55 | 9 | 9 |
Naphthalene | - | - | 9 | 9 |
Limonene | - | - | - | 9000 |
Toluene | 252,000 | - | 800 | 400 |
PM2.5 | - | - | 25 (24h) * | 10* |
* WHO guidelines: air quality guidelines for particulate matter, ozone, nitrogen dioxide and sulphur dioxide: summary of risk assessment | ||||
Babies will have a higher lifetime average daily dose than an adult, even though the exposure concentrations of the pollutants are the same.
| (1) |
Where Ei is the timeweighted exposure (ug/m³), IR is the inhalation rate (m³/day) [21], Ef is the exposure frequency (day/year), Ed is the exposure duration (day), BW is the bodyweight (kg) where in this study 70 kg is used for adults, 23 kg for children and 11 kg for babies. At is the simulation time, in this study 365 days and ϵ is the absorption factor of each pollutant (for example 0.9 for formaldehyde).
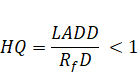
The use of LADD makes it possible to exclude non-carcinogenic health effects by calculating the hazard quotient (HQ), given in equation (2). The LADD is compared by the reference doses (RfD) (obtained by U.S. EPA) [22]. When HQ is less than 1, the risk of non-carcinogenic health effects is considered negligible.
| Health effects are negligible | (2) |
If the DCV system passes the health performance checklist, it is evaluated by the second part of this assessment method. In this assessment method, the DALY-index (Disabled Adjusted Life Years) is used as health indicator. It quantifies the total years lost due to death or disability due to poor IAQ. It scales the harmfulness of the different VOC and PM2.5-concentrations to allow a general health rating. The total DALYs are calculated based on the study of Logue et al. (2012) [23]. The DALYs of the outdoor pollutants (i.e PM2.5,NO₂ and O₃) are calculated using the IND-method. The DALYs of the indoor pollutants (i.e. benzene, formaldehyde, naphthalene, limonene and toluene) are calculated using the ID-method where the study of Huijbrechts et al. (2005) [24]provides the information on the (∂D/∂I)-factors.
When the total DALYs are calculated for each DCV system, this health indicator can be compared with the energy use of each DCV system. In that way it is possible to rate the overall performance of the DCV system. The performance of a DCV system is considered sufficient when there is a pareto optimum compared to the continuous MEV reference system. This means that both the energy use and the health impact of the DCV system must be lower than those of the reference system.
Each DCV system and their controls are modelled in the Modelica model together with the different emissions and the activity schedules of the occupants. For each ventilation system 10 different families are simulated. The results are average exposure concentration of these 10 scenarios.
In this paper, the focus will be on one constant emission source (i.e. formaldehyde) and on one emission source that depends on the activities of the occupants (i.e. PM2.5), because these two pollutants show to have the highest impact on our health. In Figure 2 the exposure concentration of formaldehyde is compared for the two DCV systems and the MEV reference system. The acute concentration limit of 55 ug/m³ is not exceeded by any system. The chronic concentration limit of 9 ug/m³ is exceeded by the two DCV systems. DCV1 has a chronic exposure concentration of 11 ug/m³, while DCV2 has a much larger chronic exposure concentration of 18.8 ug/m³.
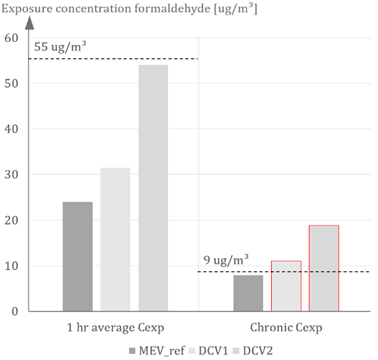
Figure 2. Comparison of the exposure concentration of formaldehyde between DCV1, DCV2 and MEV_ref.
Figure 3 shows the exposure concentration of PM2.5 for the three systems. The acute exposure concentration is compared with the 24 hours limit concentration of the WHO and is only exceeded by DCV2. The chronic exposure concentration is exceeded by all the ventilation systems. This is a result of a constant outside PM2.5-concentration of 14 ug/m³ (according to MIRA 2019) [26]. In the future, it can be important to change the approach of the outside pollutants to more variable concentrations according to the environment (e.g. temperature) and the location (e.g. nearby industry, heavy traffic).
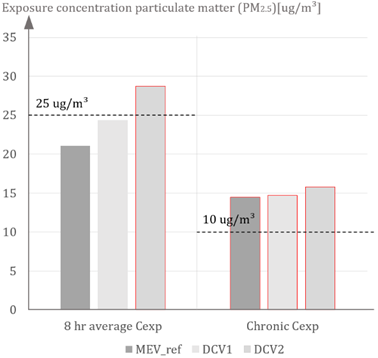
Figure 3. Comparison of the exposure concentration of PM2.5 between DCV1, DCV2 and MEV_ref.
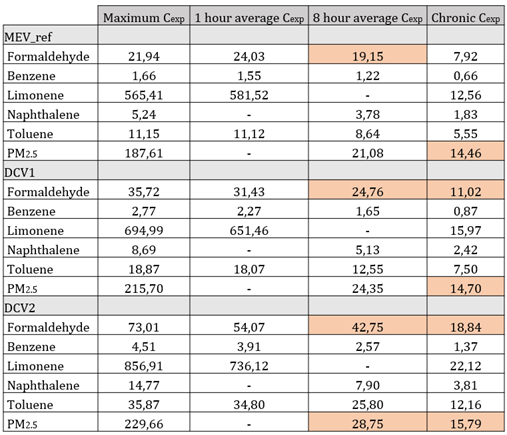
In Table 7 all the concentrations of the pollutants of concern are summarized. DCV2 scores too high for formaldehyde and PM2.5. DCV2 has also higher exposure concentrations for all the other pollutants than DCV1.
Table 7. Summary of all the acute and chronic exposure concentrations of the pollutants of concern for DCV1, DCV2 and MEV_ref.
To ensure that the IAQ, caused by system DCV2 does not cause any health effects on the sensitive occupants, the LADD is calculated. Subsequently the HQ of each pollutant is calculated by comparing the LADD to the reference dose (obtained by U.S. EPA). An example is worked out for benzene. In Table 8 the average LADD of benzene of the 10 scenarios simulations is calculated for each occupant in the simulation. For DCV2, the LADD of benzene is higher than the reference dose (8.57 × 10⁻³ mg/ kg/day) for both the smaller children. Therefore, DCV2 will not ensure a good IAQ for the sensitive occupants.
Table 8. Summary of all LADD of benzene for each occupant in the simulation for MEV_ref and the two DCV systems.
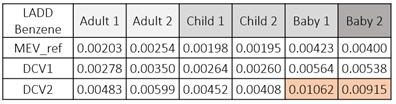
It is necessary to adjust DCV2 to meet the minimum requirements of the health performance checklist. A new simulation is carried out where the minimum flow rates are increased from 10% to 30% of the nominal flow rates. This adaptation changes the LADD of benzene for occupant 5 (Baby 1) from 0.01062 to 0.00784 mg/ kg/day and for occupant 6 (Baby 2) from 0.00915 to 0.00676 mg/ kg/day. All the average daily doses are now below the reference doses. Hence, it can be said that no important negative health effects will occur due to a poor IAQ. In the next paragraph, it is examined whether there is a pareto optimum between the two DCV systems, incl. the new DCV2 system and the MEV-reference system. The overall performance of the DCV systems, both in terms of energy and health, should perform better than the overall performance of the MEV reference system.
The total DALYs per 100,000 persons per year are calculated for each pollutant using the IND and ID method. The results are given in Figure 4. It becomes clear that the total DALYs are for more than 80% caused by PM2.5. The second major pollutant is formaldehyde. All the other VOCs seem to have a very small impact and are therefore less harmful for our health. DCV1 has the smallest total number of DALYs. Even smaller than the reference system. This is caused by the smaller influence of the outdoor pollutants in periods of less ventilation. DCV2 has the largest total number of DALYs. This is caused by the higher formaldehyde concentrations and the higher PM2.5-concentration in the kitchen during cooking periods.
The new DCV2 system, where the minimum flow are adapted to 30% of the nominal flow rates (instead of 10%) reduces the total number of DALYs from 41.1 to 32.8 DALYs per 100,000 persons per year. This is a reduction of more than 20% (8.3 DALY).
Now that the total DALYs are known, it is possible to generate an overall performance rating of the DCV systems. In Figure 5 the total number of DALYs are compared with the energy use (electricity use of the fans and ventilation heat losses) of the ventilation system. To create a pareto optimum it is necessary that the DCV systems perform better in terms of health and energy. This means that the DCV systems must be located in the green frame shown in Figure 5. The system that is situated on the bottom, left, is the system that generate the best pareto optimum. At first, system DCV2 had a very low energy use. After the adaptation, the IAQ is improved with 20% (8.3 DALY) and the energy use increased with 35% (1,040 kWh/year).This increase in energy use seems very high, but the total energy use is still 40% (1,845kWh/year) lower than the energy use of the reference system with continuous flow rates. The overall performance of the new DCV2 is even better than the overall performance of DCV1. It is stated that with correct adaptions, it is possible to find a pareto optimum for each DCV system.
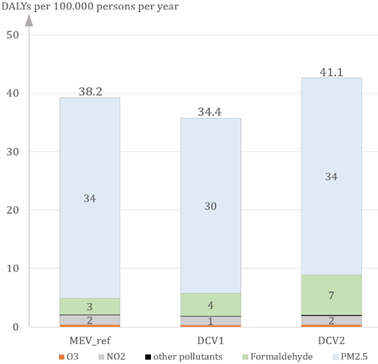
Figure 4. The share of each pollutant in the total number of DALYs (the health indicator in this research) per 100,000 persons per year compared for the two original DCV systems and the MEV reference system.
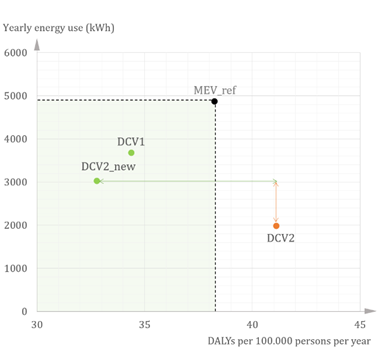
Figure 5. The overall performance of a DCV system in terms of energy and health compared to the MEV reference system. The overall performance of a DCV system is sufficient if there is a pareto optimum compared to the MEV reference system. DCV2_new scores best on the overall performance.
In this research, a very extensive emission model was combined with a dynamic temperature and occupancy model in the Dymola software. This allows an assessment of IAQ at every timestep for the different occupants with different ages, habits and metabolisms. Based on the determination of the exposure concentration at each time step and for each occupant, both the average daily dose (LADD) and the intake can be calculated. These two parameters are both very important in the assessment method that was developed to determine whether a system ensures a good indoor air quality. The necessity for such an assessment method is high since the DCV systems are nowadays only assessed on comfort criteria such as CO₂, humidity and odour. Because the danger lies in the increased VOC concentrations in times of less ventilation, it is necessary that a DCV system, designed to ensure an energy saving, also ensures a sufficiently IAQ in terms of health.
The health and energy assessment method was designed as a two-stage assessment method in which first the exposure concentrations are checked on health risks for the occupants. The peak concentrations, acute concentrations and chronic concentrations are compared with the corresponding limit concentration from relevant exposure metrics. In this paper, the limit concentrations of the reference exposure levels [19] were used. It is possible to use other limit concentrations of exposure metrics that are for example drawn up in function of a legislation in the country where the research is being conducted.
The second stage of the assessment method is an overall performance rating where one health indicator, the total DALYs, is used as general health indicator of the system. The total DALYs scales the harmfulness of exposure to the different pollutants. In that way, the health performance of a system that ventilates more in the kitchen and induces lower PM2.5-concentrations, can be compared to the health performance of a system that ventilates more in the living rooms and induces lower formaldehyde concentrations. The total DALYs for each system are compared with the energy use of each system, resulting in an overall performance of the DCV system in comparison to the MEV reference system.
The conclusion of the two DCV systems is that, if there is minimum air flow rate of 10%, DCV1 ensures a better indoor air quality. This means that increasing the extraction flow rate by using CO₂-sensors in the dry spaces, works sufficient. The disadvantage is that DCV1 only ensures an energy reduction of around 25% (1,200 kWh/year) in comparison to the continuous MEV system, which is rather low. When the minimal flow rates of DCV2 are increased to 30%, it guarantees a better IAQ and a higher energy reduction then DCV1. That’s why the adaption of a DCV system that initially guarantees a high energy reduction but a low IAQ, ensures mostly an improvement to the health/energy contradiction. In comparison to the continuous MEV system, the energy reduction of DCV2_new is around 40% (1,845 kWh/year) and the improvement of IAQ is around 15% (5.5 DALY).
The investigated cases show that DCV systems can be an effective measure to save energy and provide a healthier indoor air. Both systems, DCV1 and DCV2_new, guarantee a pareto optimum in comparison to the continuous reference system. It is stated that for every DCV system, an optimalisation can be found where the health/energy contradiction disappears.
[1] Fazli T., Stephens B. “Development of a nationally representative set of combined building energy and indoor air quality models for U.S. residences”. Building and Environment. 2018;136, table 5.
[2] Savin J., Berthin S. and Jardinier M. “Demand Controlled ventilation: 20 years of in-situ modelling in the residential field”. 32ste AIVC and 1ste TIGHTVENT conference. 2011.
[3] Hänninen O. e.a. “Hallvent Project : Reducing burden of disease from residential indoor air exposures in Europe”. The 11th International Conference on Urban Health. 2014.
[4] Jorissen F. e.a. (2018). “Implementation and Verification of the IDEAS Building Energy Simulation Library”. Journal of Building Performance Simulation. 2018. 11(6), p. 669–688.
[5] Abadie M.O. e.a. “Indoor Air Quality Design and Control in Low-energy Residential Buildings” Annex 68 | Subtask 1: Defining the metrics. AIVC-CR17. 2017.
[6] Abadie M.O. and Blondeau P. “Pandora database: A compilation of indoor air pollutant emissions”. HVAC & R Research. 2011. 17(4), p. 602–613 (database url: https://db- pandora. univ- lr.fr ).
[7] De Jonge K. “The impact of demand-controlled ventilation on indoor VOC exposure in Belgian dwellings”. 2017.
[8] Heijmans N., Van Den Bossche N and Janssens A. “Berekeningsmethode gelijkwaardigheid voor innovatieve ventilatiesystemen in het kader van de EPB-regelgeving”. 2007.
[9] Poirier B. e.a. “Pollutants emission scenarios for residential ventilation performance assessment: A review”. Journal of Building Engineering. 2021.42.
[10] Yeoman A. M. e.a. (2020). “Simplified speciation and atmospheric volatile organic compound emission rates from non-aerosol personal care products”. Indoor Air. 2020.30(3), p. 459–472.
[11] Kang D.H. e.a. “Household materials as emission sources of naphthalene in Canadian homes and their contribution to indoor air”. Atmospheric Environment. 2012. 50, p. 79–87.
[12] NICNAS. “Priority Existing Chemical : Assessment Report : Limonene”. 22, p. 18–25.
[13] Schiavon M. e.a. (2015). “Domestic activities and pm generation: a contribution to the understanding of indoor sources of air pollution”. International Journal of Sustainable Development and Planning Vol 10.No. 3, p. 347–360.
[14] Rastogi S.C., Jensen G.H. and Johansen J.D. “Survey and risk assessment of chemical substances in deodorants”. Survey of Chemical Substances in Consumer Products No. 86. 2007.
[15] TenWolde A. and Pilon C. L. “The Effect of Indoor Humidity on Water Vapor Release in Homes”. 2007.
[16] Persily A. and de Jonge L. (2017). “Carbon dioxide generation rates for building occupants”. Indoor Air. 2017. 27(5), p. 868–879.
[17] Johansson P., Pallin S. and Shahriari M. “Risk Assessment Model Applied on Building Physics: Statistical Data Acquisition and Stochastic Modeling of Indoor Moisture Supply in Swedish Multi-family Dwellings”. IEA/ECBCS Annex 55 meeting. 2010.
[18] U.S.EPA. “Chemical Priority Lists for Acute Exposure Guideline Levels (AEGLs)”. 2014.
[19] OEHHA. “Acute, 8-hour and Chronic Reference Exposure Level (REL) Summary”. 2019.
[20] ATSDR. “Public Health Assessment Guidance Manual. Appendix G: Calculating Exposure Doses”. 2005.
[21] Moya J., Phillips L. and Schuda L. (2011). “Inhalation rates”. Exposure Factors Handbook. Cap.6, p. 348–443.
[22] U.S.EPA. “A review of the reference dose and reference concentration processes”. 2002
[23] Logue J.M. e.a. (2012). “A Method to Estimate the Chronic Health Impact of Air Pollutants in U.S. Residences”. Environmental Health Perspectives. 2012. 120(2), p. 216–222.
[24] Huijbregts M.A.J. e.a. (2005). “Human-toxicological effect and damage factors of carcinogenic and noncarcinogenic chemicals for life cycle impact assessment”. Integrated Environmental Assessment and Management. 2005. 1(3), p. 181–244.
[25] U.S.EPA. “Guidelines for Carcinogen Risk Assessment”. 2005.
[26] Milieurapport Vlaanderen (MIRA) : Luchtkwaliteit : Jaar-gemiddelde concentraties van buitenstoffen. 2019.
Full article: https://proceedings.open.tudelft.nl/clima2022/article/view/155
Follow us on social media accounts to stay up to date with REHVA actualities
0