


Stay Informed
Follow us on social media accounts to stay up to date with REHVA actualities

|
|
|
|
|
Abantika Sengupta | Pieter Proot | Tom Trioen | Hilde Breesch | Marijke Steeman |
PhD student, Faculty of Engineering Technology, KU Leuven, Belgium | Master Thesis student, Faculty of Engineering Technology, KU Leuven, Belgium | Master Thesis student, Faculty of Engineering Technology, KU Leuven, Belgium | Associate Professor, Faculty of Engineering Technology, KU Leuven, Belgium | Associate Professor, Department of Architecture and Urban Planning, Ghent University, Belgium |
IPCC’s Special Report on Global Warming of 1.5°C concludes there is a growing risk of overheating in buildings and an increase in severity and frequency of heatwaves in future climate scenarios [1]. As seen in Figure 1, if the current trend of global greenhouse gas emissions continues, that is Business as Usual (BAU), RCP8.5, by 2100 an increase of the outdoor temperature of approximately 5°C in Belgium is expected [2]. An increase of the outdoor temperature will have an enormous impact on the environment, soil and indoor climate. Given the uncertainty in future climate, mitigating the adverse effects of climate change is a high priority for the EU. To reduce the sensitivity of highly insulated dwellings to overheating, cooling systems (active or passive) are needed and will have an important role in the future [3].
In recent years, policies in Europe and worldwide focused on the energy efficiency of both new and renovated buildings. To avoid excessive increase of energy use for cooling, there is a need to examine alternative cooling concepts and passive cooling strategies in order to achieve the goals of the EU’s Climate Change mitigation policies [4]. In new dwellings in Flanders, built between 2006 and 2018 [5], between 15-20% of new dwellings are equipped with a heat pump, out of which 30% are ground-water heat pump. Even though currently they are mainly used for heating, these numbers suggest a high potential for ground-source cooling. Ground-source cooling systems are gaining significant market share amongst low energy cooling technologies [6] [7].
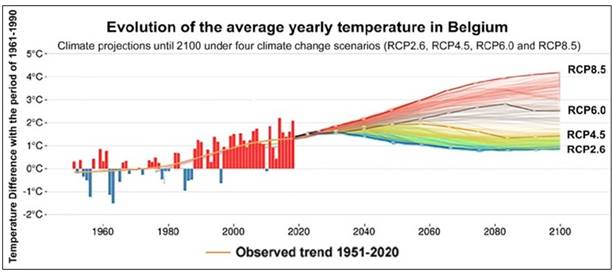
Figure 1. Evolution of the average annual temperature in Belgium. [2]
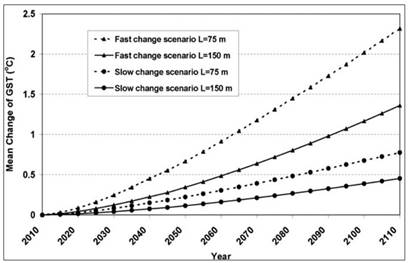
Figure 2. Evolution of ground temperature in future climate scenario. [8]
The working principle of ground-source cooling is based on the fact that the ground temperature below approximately 10 m remains fairly constant all year round at about mean annual ambient air temperature [9]. It rejects heat to the ground by circulating a working fluid through ground heat exchangers. Ground-source cooling can be classified as direct ground cooling (passive) or ground source heat pump (active). As seen in Figure 1 and Figure 2, in future climate scenarios, the outside air temperature and ground temperature will be higher, this will affect the cooling capacity of ground-source cooling [8]. Rising ground temperatures lead to the decrease in performance of a ground-water heat pump, as shown by a decrease in COP value during the summer. In the winter the COP will increase [10,11].
The objective of this study is to assess the performance of radiant floor cooling in future climate scenarios. This study aims to evaluate the increase in cooling energy need in future climate scenario, even in moderate climates. The effect of climate change (increase in outdoor air temperature, solar radiation and ground temperature) is assessed to evaluate the performance of the floor cooling to ensure robust thermal summer comfort in a dwelling in Flanders (Belgium). In the following section, the case study building, model validation and methodology are described in detail, followed by a discussion of the main results and conclusions.
The case study building examined is a terraced dwelling, located in Geel, Belgium and constructed in 2014. This building is also a part of the SCOOLS-project (2018-2021) which aims to evaluate the performance of low-energy cooling systems [12]. The building is South-West oriented and designed for a family consisting of 4 people. Figure 3 shows the (southwest) facade of the building.
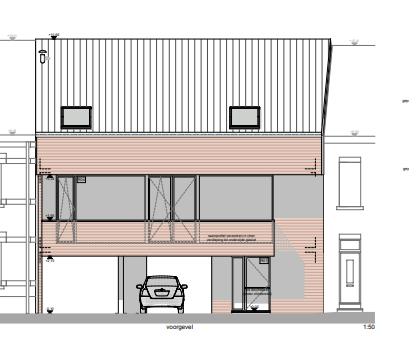
Figure 3. South-West facade of the case study building.
The building, apart from the parking in the ground floor, consists of two floors (3 m high each), with a total volume of 825 m³, an external surface of 440 m² and a compactness ratio (Surface area/gross heated volume) of 0.53. The dwelling is well-insulated and has a heavy thermal mass (calculated based on NBN EN ISO 52016-1) [13]. The average U-value of the construction is 0.42 W/m²K. The U-values of the construction elements are given in Table 1. The windows and the doors have a g-value of 0.55. The U-value of the fixed window and the skylights are 1.11 W/m²K and 1 W/m²K respectively. The glazing to floor ratio is 14%.
Table 1. U-values of construction elements.
Construction | U-value (W/m²K) |
Ground Floor slab | 0.21 |
External Wall | 0.19 |
Common Wall | 0.31 |
Internal Wall | 2.39 |
Pitched Roof | 0.13 |
Flat Roof | 0.15 |
As seen in Figure 4, the case building is equipped with a geothermal heat pump of 8kW capacity coupled with a heat exchanger to provide floor heating in winter and during summer period, passive floor cooling from two vertical boreholes with a depth of 100 meters. One drilling of 100 m provides a cooling capacity of 2.5 kW and a heating capacity of 5 kW. Furthermore, a balanced mechanical ventilation system with total Airflow of 275 m³/h, with heat recovery is installed, which allows free cooling during the night.
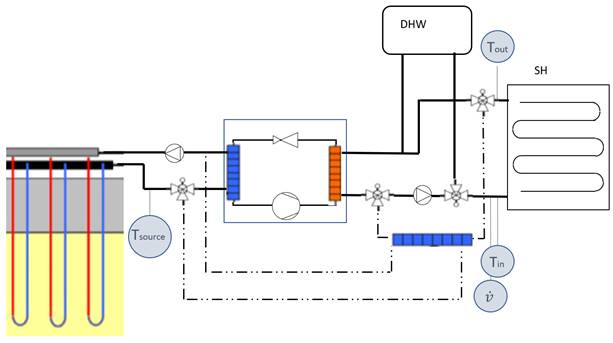
Figure 4. The scheme of the geothermal heat pump and the measurement locations.
OpenStudio and EnergyPlus was used to perform the dynamic simulations [14] [15]. First, the building envelope is drawn in SketchUp using the OpenStudio SketchUp Plugin [16]. Then loads, schedules, HVAC-systems etc. are modelled in accordance with the real building, to set up a detailed simulation model.
The building was divided into 3 main floors, where: (a) ground floor was for entrance and storage, (b) first floor (day use)-living room, kitchen and (c) second floor (night use)- 3 bedrooms, bathroom, attic. However, for the simulation, the building has been divided into 13 thermal zones (see Figure 4 and Table 2).
Table 2. Thermal Zones and Ventilation flow rates.
Thermal Zone | Ventilation Flow rates (m³/h) |
Zone 1 (Entrance hall) | - |
Zone 2 (Kitchen + dining) + Zone 3 (Living Room) | 112.1 |
Zone 4 (Home Office/ Desk) | 39.1 |
Zone 5 (Toilet-WC) | 39.1 |
Zone 6 (Bedroom 1&2+ Dressing) | 75 |
Zone 7 (Bedroom 3) | 32.8 |
Zone 8 (Bathroom) | 75 |
Zone 9 (Laundry) | 62.6 |
The internal loads are assigned for each zone and correspond to the heat gains due to occupancy, lighting and equipment (see Table 3). The occupancy is scheduled separately for weekday, weekend and summer vacations (See Figure 6 for a typical weekday Schedule). Four people are assumed to be at work/school from 9h to 17h from Monday to Friday except Wednesday afternoon from 13 h. Hours of occupancy are 132 h/week. The 'radiant fraction' is set to 0.5 for the persons, electrical equipment and lighting. This value is recommended by EN ISO 52016-1when performing simulations [17].
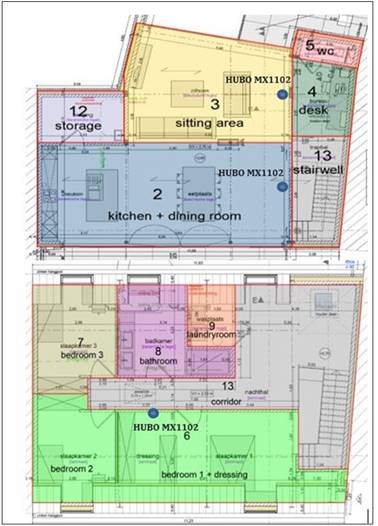
Figure 5. Thermal Zones.
Hours of occupancy in a space is a crucial factor impacting thermal comfort. In zone 2 and 3 (living room), it is assumed that the spaces are occupied during the daytime. Concerning zone 6 (bedrooms), two different scenarios are created for simulation. In the first scenario, the bedrooms are only occupied during the night (11 p.m. – 7 a.m.). For the second scenario, an occupancy from 4 p.m. till 7 a.m. is assumed. Since the case study building was not equipped with solar shading, a simulation scenario to evaluate the impact of solar shading on thermal comfort was implemented. An automatic solar shading with g-value of 0.55 has been implemented in the simulation model. The solar shading is only applied to the windows located on the south-west side of the building, both for the bedrooms (thermal zone 6) and the living space (thermal zone 2 and 3). The solar shading is modelled to be ON, when the global solar radiation on the window reaches exceeds a value of 250 W/m². It remains ON for 15 min, after which the control checks the radiation on the window. If the solar radiation on the window exceeds 250 W/m², the shading remains ON and if the value is lower than the threshold value of 250W/m², the shading is turned OFF.
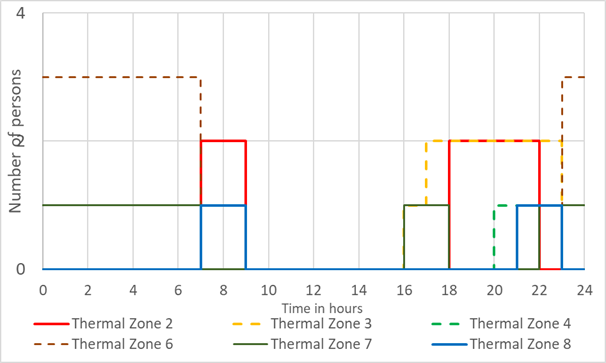
Figure 6. Weekday occupancy schedule.
Table 3. Internal loads for each space for heat gains. [17]
Persons (number) | Lighting (W/m²) | Equipment (W) | ||
level 1 | Desk (Zone 4) | 1 | 2 | 250 |
Living area (Zone 3) | 2 | 2 | 330 | |
Dining + kitchen (Zone 2) | 2 | 1.7 | 108 | |
level 2 | Bedroom 1 + dressing (Zone 6) | 2 | 2 | 0 |
Bedroom 2 (Zone 6) | 1 | 2 | 30 | |
Bedroom 3 | 1 | 2 | 30 | |
Bathroom | 1 | 4.6 | 0 | |
Laundry room | 0 | 0 | 3 200 | |
Before evaluating the impact of future climate scenarios on the performance of the floor cooling system, the simulation model must be validated. To do this, the indoor temperatures obtained from the model are compared with the indoor temperatures measured by sensors on site. For this reason, the operative indoor zone temperatures (from the model) are compared with the data from measuring devices placed on-site. A weather station TMK was placed with 2 minutes time step for monitoring the outdoor dry bulb temperature, relative humidity and solar radiation. Sensor HUBO MX1102 with time step 10 minutes was placed in the bedroom (See Figure 5 for the position of the sensor in the bedroom) to monitor the temperature, relative humidity, CO₂ and dew point temperature. This sensor has a range between 0°C to 50°C with an accuracy of ±0.21°C in the given range. The comparison is performed for two periods of 10 days in July (6.07-16.07) and August (17.08-27.08-post heat wave period) of the year 2020 (see the weather data from July and August 2020 in Figure 7).
![]()
![]()
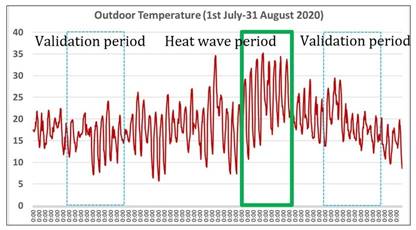
Figure 7. Weather data from 1st July to 31st August 2020 indicating the heat wave period in the beginning of August.
Table 4. Adaptations in the simulation model for model validation.
Adaptation | Description | |
1 | Floor Cooling | Setpoint cooling: 23°C ±1°C Supply temperature: 18°C Measure operative temperatures Max Flow rate cooling: 1200l/h Check parameters of circulation pump and heat exchangers |
2 | Air Flow | Measure: Add zone mixing Object Adjustments in the air flows between zones |
3 | Infiltration | N50 = 2 h−1 |
4 | Ground Heat Exchanger | Ground Thermal conductivity: 2.1 W/Mk Ground thermal heat capacity: 3400000 PA:K Ground Temperature: 13°C Pipe thermal conductivity: 0.42 W/mK U_tube distance: 0.06 m Pipe Thickness: 0.003 m Flow rate loop: 0.00032 m³/s |
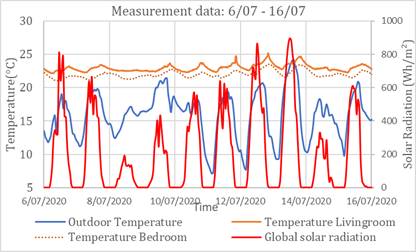
Figure 8. Measured outdoor and indoor temperature between 6th to 16th July 2020.
Figure 8 shows the measured data between 6th to 16th July 2020. The outdoor temperature reaches a maximum of 24.1°C on 13/07/2020 at 2 pm. The maximum indoor temperature for bedroom (23.5°C) and living room (25.2°C) was observed on 12/07/2020 at 8.11 pm.
Improvements on the simulation model were made on parameters of the floor cooling system, airflows, infiltration rates and ground heat exchanger to obtain the best result (see Table 4). The entire summer period of measured temperatures and simulated temperatures is compared (1st July – 14th September 2020). There are two conditions that the results of the simulation model must meet to be considered that the indoor temperatures as validated- (a) The MAE (Mean absolute value of error) should be less than 1°C and (b)RMSE (Root mean squared error) should be less than 1.5°C [18].
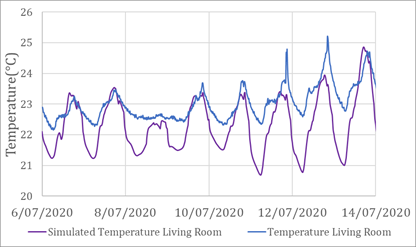
Figure 9. Comparison of the measured and Simulated temperature of the living room.
Table 5. Model validation (Summer period: 1st July-14th September 2020).
Difference between simulated and measured temperature | Validation condition | Status | ||
MAE | living room | 0.80°C | <1°C | Validated |
bedroom | 0.83°C | <1°C | ||
RMSE | living room | 1.03°C | <1.5°C | Validated |
bedroom | 1.03°C | <1.5°C | ||
The impact on the performances of a floor cooling system is assessed for four possible climate scenarios, representing historical, extreme weather data (heatwave period) and future weather data (midterm-2050s and longterm-2100s). The historical weather data of 2010 represent a moderate climate and are used as the reference scenario. The rising ground temperature is also taken into consideration for the dynamic-simulations. The weather data of Melle, for Scenario 1, 3 and 4 are based on RCP8.5 and developed adopting the methodology IEA EBC Annex 80-Resilient Cooling of Buildings [19]. Weather data of Melle for scenario 2 is based on the observations by RMI for year 2020 [20].
Table 6. Climate scenarios used for performance assessment.
Scenarios | Description |
1 | Historical weather data 2010s (2000-2020) |
2 | Weather data -Melle 2020 (heatwave) |
3 | Future mid-term 2050s (2040-2060) |
4 | Future long-term 2090s (2080-2100) |
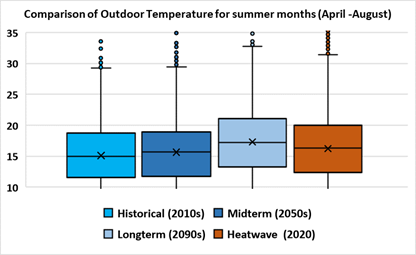
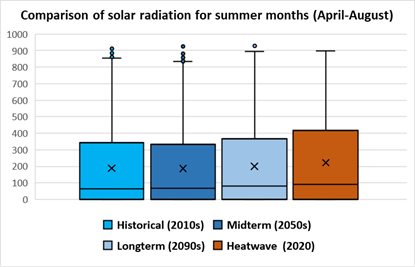
Figure 10. Temperature and solar radiation trends for the summer months for all 4 climate scenarios.
In Figure 10, we can observe, the maximum temperatures recorded in the summer months (April-August), shows rising temperature trend from the historical to the future long -term scenario. However, 2020, was an exceptionally warm year with heat waves in July and August and the observed weather data of 2020 had higher maximum temperature for the summer months than mid-term climate scenario. However, for radiation, the variation between the 2 scenarios (historical and midterm) in summer months are not significant. But for 2020, heat wave scenario, the solar radiation is significantly higher compared to the long-term scenario.
The OpenStudio/EnergyPlus manual shows that weather data (excluding specific ground temperatures) only has an impact on the ground temperature at the surface (up to 0.5 m). The ground heat exchanger is placed to a depth of 100 meters. It is therefore crucial that the ground temperature for the ground heat exchanger is manually adjusted for the future climate scenarios. For climate scenario 1 and 2, the ground temperature 13°C, 13.7°C for scenario 3 and 14.7°C for scenario 4 has been implemented. With boreholes up to 100 m deep, the choice was made to follow the fastest increasing scenario at a depth of 75 m [8].
Method A as described in Annex F of the EN 15251 (15) is selected for the evaluation of summer comfort. For this study, the percentage of occupied hours when the operative indoor temperature is above 25°C, 26°C and 28°C is evaluated for a period from the 1st of April until 31st October. The temperature thresholds also verify with the heat stress impact on human body, studied by [21]. The analysed period is an extension of the meteorological summer because, assuming future climate scenarios, summers can be longer. If the percentage above 25°C is lower than 5%, the thermal comfort is considered acceptable while lower than 3% is considered good.
The cooling capacity is calculated using the energy equation (1). The cooling capacity of the floor cooling system is increases/decreases depending on the inlet and outlet temperature of the ground heat exchanger (∆T).
| (1) |
For the calculations on the supply side of the heat exchanger, the following parameters have been extracted from the simulation model (per time step of 1 hour):
· heat exchanger: inlet temperature (°C)
· heat exchanger: Outlet temperature (°C)
· Flow rate flowing through the heat exchanger (kg/s)
To evaluate the thermal comfort, only the most critical zones (living space (2&3) and bedrooms [6]) are considered. To improve the thermal comfort, the impact of solar shading is also investigated for all the zones.
Zone 6 (Bedroom) is only occupied during the night. Two types of occupancy profile (11pm to 7 am) and (4 pm to 7 am) has been simulated. Both the occupancy scenarios are simulated with and without solar shading interventions.
As seen in Figure 11, a good thermal comfort can be guaranteed in all 4 climate scenarios with a maximum of 1.4% of occupied hours above 25°C in the long-term scenario. Occupancy profile 1 (11 pm to 7 am) do not have any occupied hours above 26°C and 28°C threshold with or without shading. However, when the bedrooms are occupied for a longer period (4 am to 7 am), the percentage of occupied hours above 25°C in long-term scenario increases to 7.1% (see Figure 12). With higher occupancy, the percentage of exceeding hours in Future long-term scenario can be decreased from 7.1% to 3.5% with the intervention of solar shading (see Figure 12). For the climate scenarios-2020, historical and also midterm, solar shading decreases the exceeding hour percentage by 50%. There are no exceeding hours above 28°C with solar shading. However, without solar shading, there are 3.1% occupied hours exceeding 26°C, and 1.8% occupied hours exceeding 28°C.
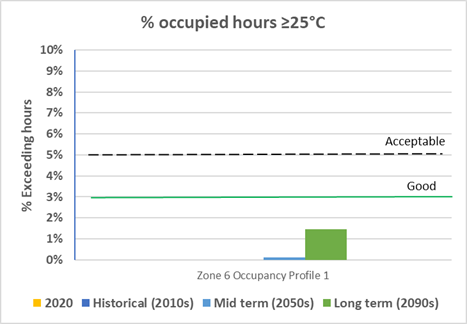
Figure 11. % occupied hours >25°C occupancy between 11 pm to 7 am, with and without shading
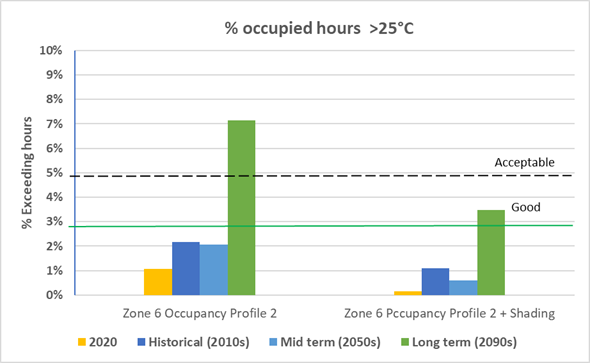
Figure 12. % occupied hours >25°C (Zone 6- Bedroom with Occupancy between 4 pm to 7 am, with and without shading).
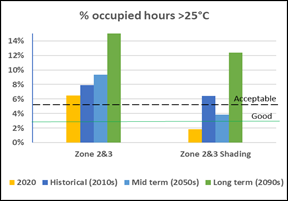
Figure 13. % occupied hours >25°C (zone 2&3) without and with shading.
Zone 2&3 (Kitchen+ dining and Living room) is occupied during the day. Zone 2 &3 is simulated with and without solar shading interventions. As seen in Figure 13, without solar shading, the percentage of occupied hours above 25°C is higher than the acceptable limit in all 4 climate scenarios. The percentage of occupied hours above 25°C threshold reaches up to 14.5 % in the long-term scenario.
With the intervention of solar shading, the percentage of occupied hours in historical and mid-term scenario can be improved and brought back below the acceptable 5% limit. However, even with solar shading, percentage of occupied hours above 25°C is above the acceptable level for the year 2020 (heat wave period) and for long-term climate scenarios (see Figure 13).
Figure 14 illustrates the percentage of occupied hours above 26°C threshold in Zone 2 &3, without and with shading. Without shading, only in long-term scenario, the percentage of occupied hours are above acceptable limit (9.8%). Historical and mid-term scenario are in good limits (below 3%), whereas year 2020 is 3.5%.
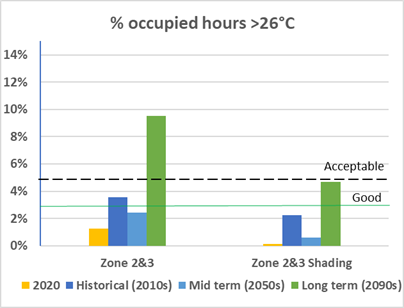
Figure 14. % of occupied hours in Zone 2 & 3 above 26 without and with solar shading.
However, with the intervention of shading, all 4 scenarios are within the acceptable limit. Thus, Solar shading will reduce 50% of occupied hours above 26°C% for the long-term scenario and will guarantee a good thermal comfort in the other scenarios. In the long-term, the indoor temperature will rise above 28°C (0.5%) without solar shading. With shading, no indoor temperatures above 28°C are measured.
The impact of future climate scenarios on the cooling capacity is illustrated in Figure 15. The results from the simulation confirm, climate change will have a negative impact on the cooling capacity, even for cooling devices used in this case study.
However, the technical data sheet of the system shows a peak cooling capacity of 5Kw. This value was never exceeded during all 4 climate scenarios, proving the current system should be able to deliver the peak cooling capacity in future climate scenarios. However, peak cooling power decreases 1 kW over 80 years. This is due to the rising ground temperature as a result of global warming. Figure 16 illustrates the inlet and outlet temperatures on the supply side of floor cooling. The supply temperature of the floor cooling system was set at 18°C to avoid condensation and this setpoint was used in the actual system on site as well. For climate scenarios 2, 3 and 4, this supply temperature cannot longer be guaranteed. There is a rise in the inlet temperature (0.15°C) for 2020, 0.16°C during mid-term and almost by 1°C for the long-term scenario.
Analysis of the cooling capacity shows that the maximum power output will decrease in the future climate scenarios. For example, the maximum power output will decrease by approximately 17% by 2050 and 22.5% by 2090. The average cooling capacity will remain approximately the same. The decrease in maximum cooling capacity is due to the faster increase of the outlet temperature compared to the inlet temperature of the heat exchanger. For example, in climate scenario 4 (2090) the supply temperature of 18 degrees cannot be guaranteed over the entire period. On average, the supply temperature rises to almost 19°C, which is the result of a rising source temperature in the boreholes.
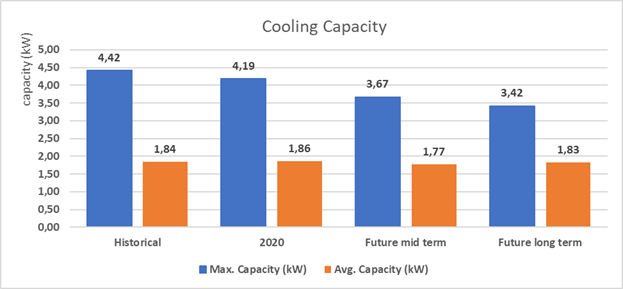
Figure 15. Cooling Capacity heat exchanger.
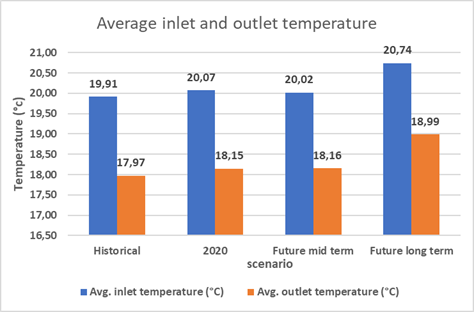
Figure 16. Average inlet and outlet temperature (Floor cooling).
The results of the thermal comfort show that occupancy has a major impact on whether or not the predetermined upper limits are exceeded. If the analysis is performed for the living space with an upper limit of 25°C, good thermal comfort cannot be guaranteed for any climate scenario. If the upper limit is raised to 26°C, the floor cooling system will only fail in 2090 and in rest 3 climate scenarios, it can guarantee acceptable hours of thermal comfort. In the long-term, only 0.5% of occupied hours was measured, with the indoor temperature exceeding the upper limit of 28°C. For the bedroom, assuming occupancy only at night in the bedrooms, good thermal comfort is achieved for all climate scenarios. With the occupancy profile from 4 pm to 7 am, good thermal comfort cannot be guaranteed 7.1% occupied hours above 25°C in 2090. In the bedroom, assuming an upper limit of 25°C for both occupancy patterns, good thermal comfort can still be guaranteed. However, implementation of solar shading shows much improvement in the thermal comfort in the bedroom and especially in the living-dining room (Zone 2 &3). In the living space, good thermal comfort is only obtained if the comfort temperature limit is raised to 26°C, even in historical climate scenario. However, with intervention of solar shading this can be improved for the 4 climate scenarios. This verifies the necessity of solar shading especially in highly glazed and south or west facing zones in the buildings.
The decrease in cooling capacity of the floor cooling in mid-term climate scenario is 17%. In the long-term, the impact of climate change is greater. Even assuming an upper limit of 26°C, good thermal comfort is not obtained. With regard to the cooling capacity of the floor cooling, the decrease is also greater-22.5% compared to the existing condition. In the future, the system will therefore have to be dimensioned differently, for example by increasing the flow rates or additional (active or passive) cooling systems will have to be implemented. In the long-term, the current design of this dwelling including the floor cooling system will not be able to reduce the temperature below 26°C in each thermal zone. The inlet temperature of 18°C can’t be guaranteed in future climate scenarios, which results in a lower maximum cooling capacity.
Thus, it can be concluded that in future climate scenarios, shading is indispensable. Also, the cooling systems needs to be dimensioned keeping in mind the rise in air and ground temperature to guarantee good thermal comfort to the users.
This study was conducted as part of the curriculum for Master thesis of students Pieter Proot and Tom Trioen under the supervision of Prof. Hilde Breesch and PhD student Abantika Sengupta. The data of the case study building and the monitoring data was provided by Thomas More University of Applied Sciences as a part of their sCOOLS project.
[1] IEA/EBC. Ventilative Cooling (State-of-the-art review) Annex 62. IEA - EBC Program [Internet]. 2015.
[2] KMI. Klimaatrapport 2020 - van klimaatinformatie tot klimaatdiensten. 2020;92.
[3] Pradyumna A, Guinto R. Climate change and health. Lancet. 2016;387 (10017):430–1.
[4] Hatamipour MS, Abedi A. Passive cooling systems in buildings: Some useful experiences from ancient architecture for natural cooling in a hot and humid region. Energy Convers Manag. 2008 Aug 1;49 (8):2317–23.
[5] VEA. EPB-CIJFERRAPPORT Procedures , resultaten en energetische karakteristieken van het Vlaamse gebouwbestand - periode 2006 - 2018. (in Dutch). 2019;
[6] Oxizidis S, Papadopoulos AM. Performance of radiant cooling surfaces with respect to energy consumption and thermal comfort. Energy Build [Internet]. 2013;57:199–209.
[7] Jeong CH, Yeo MS, Kim KW. Feasibility of a Radiant Floor Cooling System for Residential Buildings with Massive Concrete Slab in a Hot and Humid Climate. Int J Concr Struct Mater [Internet]. 2018;12 (1).
[8] Kharseh M, Altorkmany L, Nordell B. Global warming’s impact on the performance of GSHP. Renew Energy [Internet]. 2011;36 (5):1485–91.
[9] Popiel CO, Wojtkowiak J, Biernacka B. Measurements of temperature distribution in ground. Exp Therm Fluid Sci. 2001 Nov 1;25 (5):301–9.
[10] Jungqvist G, Oni SK, Teutschbein C, Futter MN. Effect of climate change on soil temperature in Swedish boreal forests. PLoS One. 2014;9 (4):1–12.
[11] Zhang Y, Chen W, Smith SL, Riseborough DW, Cihlar J. Soil temperature in Canada during the twentieth century: Complex responses to atmospheric climate change. J Geophys Res D Atmos. 2005;110 (3):1–15.
[12] SCoolS - Home [Internet]. [cited 2020 Feb 28]. Available from: http://www.cornet-scools.com/.
[13] MyNBN - Ro PdfMeta [Internet]. [cited 2021 Jan 25].
[14] OpenStudio | OpenStudio https://www.openstudio.net/.
[15] Olesen BW. Revision of EN 15251: Indoor Environmental Criteria: REHVA [Internet]. Vol. 49, The REHVA European HVAC Journal. 2012. 6–14 p.
[16] 3D Design Software | 3D Modeling on the Web | SketchUp
[17] ISO - ISO 52016-1:2017 - Energy performance of buildings — Energy needs for heating and cooling, internal temperatures and sensible and latent heat loads — Part 1: Calculation procedures
[18] Jain N, Burman E, Stamp S, Mumovic D, Davies M. Cross-sectoral assessment of the performance gap using calibrated building energy performance simulation. Energy Build2020;
[19] IEA EBC || Annex 80 || Resilient Cooling Available from: http://annex80.iea-ebc.org/.
[20] Weather Belgium - RMI Available from: https://www.meteo.be/en/belgium.
[21] Buildings CR. Climate Resilience Buildings: Guideline for management of overheating risk in residential buildings. 2021.
Full article: https://proceedings.open.tudelft.nl/clima2022/article/view/326
Follow us on social media accounts to stay up to date with REHVA actualities
0