

Stay Informed
Follow us on social media accounts to stay up to date with REHVA actualities
|
|
|
Karel Kabele | Zuzana Veverková | Pavla Dvořáková |
Czech Technical University in Prague, Faculty of Civil Engineering, Department of Indoor Environmental and Building Services Engineeringkabele@fsv.cvut.cz | Czech Technical University in Prague, Faculty of Civil Engineering, Department of Indoor Environmental and Building Services Engineering | Czech Technical University in Prague, Faculty of Civil Engineering, Department of Indoor Environmental and Building Services Engineering |
In 2020, the Scoolpt art studio came up with an idea to create a residential sculpture, realised by 3D printing from a concrete mix. The authors, Michal Trpák, Ladislava Trpák, Jiří Vele and Kateřina Nováková, managed to find sponsorship support for this idea and thus the first Czech 3D printed house called PRVOK (=Protozoa) was created (Figure 1). After the installation of all technical equipment together with an intelligent control system, the object was put into operation in summer 2020 [1]. Since spring 2021 it has been used for short-term accommodation for (up to) 2 persons in a holiday resort on the shore of a South Bohemian pond.
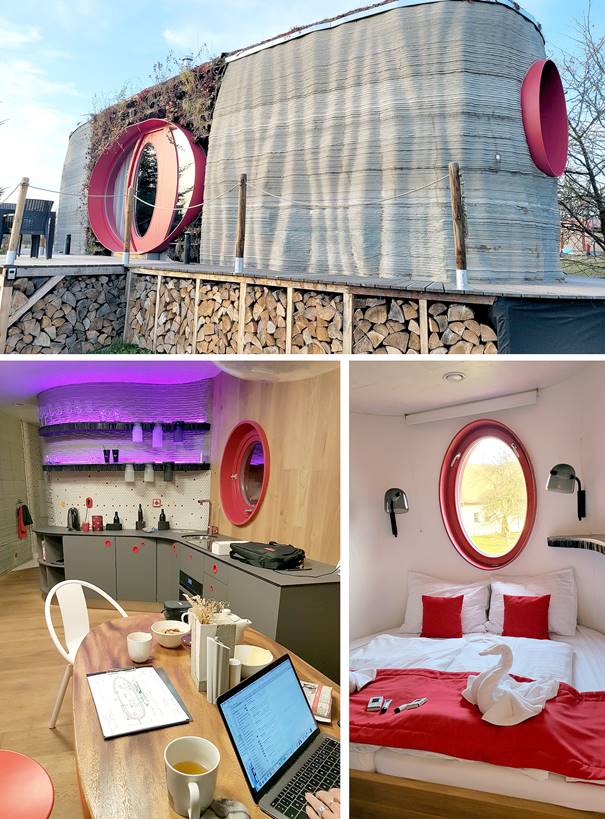
Figure 1. Residential sculpture PRVOK.
The use of 3D printing technology for the printing of the whole house is a major challenge and innovation in the building process. It brings new issues not only in the field of actual production, the static and the thermal properties of building structures, energy consumption in operation and production, durability and environmental impact, but also in the quality of the indoor environment. Thanks to the authors’ helpfulness, the building besides acting as an interesting functional art object, awarded in many competitions, is working also as a living laboratory for testing and research. Therefore in 2021, a comprehensive assessment of the quality of the indoor environment was carried out in PRVOK using the HAIEQ (Holistic Assessment of Indoor Environmental Quality) certified methodology developed by the team of the Department of Indoor Environmental and Building Services Engineering at Faculty of Civil Engineering of CTU in Prague [2][5]. The HAIEQ assessment helps to identify the problem areas in terms of IEQ (Indoor Environmental Quality) and to propose measures. In this case it also works as a metric to find the gaps and express the benefits of the implementation of new intelligent management services in the field of indoor environmental quality management and building management in general within the TRIO research project, focused on identification and development of new services for intelligent buildings [3].
The indoor environment of buildings consists of a set of physical, chemical, and social reactions between users and the building, which includes phenomena affecting the technical, natural, and medical sciences [4]. To describe and quantify the parameters of the indoor environment of buildings, we commonly use a simplified model, describing and evaluating the individual components of the environment separately – thermal comfort, air quality, acoustics, lighting, electromagnetic and other fields that co-create the final state of the environment.
The aim of this methodology is to create a complex holistic view of the assessed object in terms of all factors of the indoor environment. The HAIEQ methodology is based on a holistic approach to the integration of information about the building-technical design and interior, heating, cooling, ventilation, lighting, acoustics and electromagnetic, -ionic, -static fields and ionizing radiation, information about the real operation of the assessed building, based on data from measurements, mathematical model, and questionnaire survey. The output is a set of information expressing whether the object under assessment, in terms of each criterion, is solved at the level of the current state of knowledge or has the potential to improve the quality of the indoor environment, or whether there are significant deficiencies in terms of the quality of the indoor environment. The advantage of the methodology is the assessed method, which is not only intended to classify IEQ in buildings but primarily to indicate bottlenecks. In addition, a holistic approach helps to identify the causes of the problems and to better find ways to possible remedies.The information obtained can also be used to evaluate SRI (Smart Readiness Indicator [6]).
The methodology contains four basic parts (Figure 2). The first part summarizes the basic data about the assessed object and the assessor and the scope of the assessed parts of the object is defined, including materials for assessment (project documentation, local investigation, measurement and regulation records, own measurements, questionnaire survey). Data about the assessed zone with a focus on building technical solutions and interior, heating, cooling, ventilation, lighting, acoustics and electro-magnetic, -ionic, -static fields and ionizing radiation are processed in the second part. Information about the real operation of the assessed object, based on data from measurements, mathematical model, and questionnaire survey is processed in the third part. The fourth final part contains an assessment of the above-described state of the building solution in terms of the eight criteria.
Each of the eight criteria contains 3-10 sub-criteria, where each is scored with grade 0 to 3. Grades are awarded based on the subjective assessment of the assessor, who has information about the object, measured data and, if possible, the result of a questionnaire survey. The evaluation is intended to express the state of the assessed criterion. If there is not enough data for the assessment of the given criterion or its assessment is not relevant for the given object, this is evaluated as “0”. If there is sufficient data to assess the criterion and the analysis of the criterion, considering user’s feedback, does not provide any recommendations for improving the current situation, this is evaluated as “1”. If the assessor suggests a measure leading to the improvement of the indoor environment, he evaluates criterion “2” or “3”. A rating of “3” indicates a serious problem in a given criterion that must be addressed immediately (e.g. violation of binding regulations, emergency state, malfunction or malfunctioning equipment). A rating of “2” indicates a condition that is acceptable but can be improved and it is desirable to do it. The proposed measure must be feasible for the given object and substantiated by justification (e.g. technical-economic analysis, expression of the benefit of the given measure, etc.). This assessment can to some extent, especially when deciding between 1 and 2, be influenced by both the knowledge and experience of the assessor and the feedback from the users. Thus, for these criteria, the evaluation of some objects may be satisfactory (i.e. rating “1”, without comment), while for other similar ones objects these criteria are commented and measures leading to an increase in the quality of the indoor environment are proposed (a rating “2”). The result of the questionnaire survey will play a role in this decision, which will express, for example, the user’s satisfaction with the current situation, even if it does not correspond to the current best state of knowledge (best practice).
The output of the methodology is a set of information expressing whether the assessed object is solved in terms of individual criteria at the level of the current state of knowledge or has the potential to improve or there are serious shortcomings in terms of indoor environmental quality.
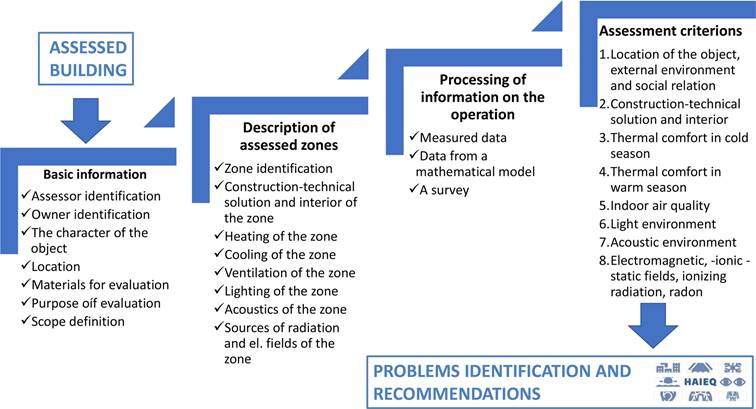
Figure 2. HAIEQ assessment methodology.
The assessment of IEQ using the HAIEQ methodology is based on the assessment of data describing the architectural and construction design, the design of technical systems and the operation.
PRVOK is a ground floor building, where on the floor plan of 43 m² of open space there is a bedroom, a toilet with a bathroom and a living area with kitchenette (Figure 3).
The building is without foundations, respectively the supporting bottom frame is metal, the perimeter structures (walls) are made of 3D printed concrete (bedroom and bathroom) in combination with a wooden structure (living area). The windows of the building are wooden frames with double glazing, the roof is flat green and in the central part of the building vertical green walls are implemented in the exterior. The interior surfaces are made of 3D printed concrete, ceramic mosaic tiles, plaster, and wooden cladding.
The building has electric underfloor heating, ceiling split air conditioning cassette unit with heating output 3.2 kW and cooling output 2.5 kW and ventilation unit 150 m³/h (up to 500 m³/h) with heat recovery exchanger providing equal pressure ventilation with air supply to the bedroom, living area and shower and with air exhaust from the bedroom, kitchen area and toilet.
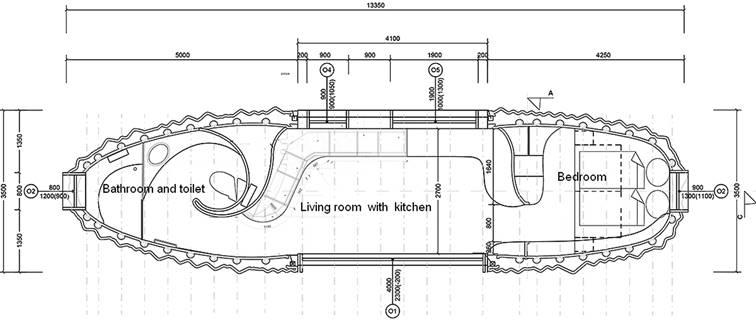
Figure 3. Floor plan of PRVOK.
The bathroom is equipped with a unique recirculation shower unit, smart toilet with automatic operation and an electric storage water heater is installed for hot water generation. The building is connected to a grey water tank, with water recovery for toilet flushing, and a black water tank with the possibility of pumping and removal of sewage. Rainwater is used for automatic irrigation of the green roof and facades. The object is connected to a mains water supply.
As part of the research project [3], in cooperation with industrial partner a master control system was installed in the building, which allows to integrate all control functions of the building operation, monitor individual parameters, automate control and, thanks to remote access, perform service interventions. At the same time, the user has information about the current thermal comfort (air temperature and relative humidity) and the history of air temperatures in the bathroom, living area and bedroom. Information about the operating mode of the air conditioning and air handling unit (% of power), information about the use of lighting (in the living area including the intensity of lighting and colour) and information about the current and total electricity consumption for a certain season is available. The user is also able to change the desired temperature in the interior of the bathroom, bedroom and living area, the setting of the power of the airhandling unit and the air conditioning unit and the desired temperature of the air supplied by the air conditioning unit. There is the possibility to switch the lighting on/off, and in the living area to change the intensity and colour of the light.
For the PRVOK building, we had the design documentation, supplemented, and verified by the actual condition during a detailed survey of the building (Figure 4) and data from the installed intelligent control system. As it has been found in previous surveys, the data from the building control system needs to be validated – the industrial sensors used to control different technical systems are not always calibrated with each other and so the data on the same quantity from different sensors varies within the tolerance of the sensor accuracy and the location of the sensor also has an influence. Therefore, the data from the control system were supplemented with several measurements of selected indoor environmental parameters.
The monitoring process started with one-off indicative measurements of selected parameters (VOC, CO₂, Formaldehyde, negative ions) to get an overall picture of the state of the environment. Hand-held instruments were used for this purpose. At the same time, measurements of illuminance and analysis of the light spectrum of the artificial lighting system were carried out. These measurements were complemented by thermographic images of the envelope and floor heating to identify areas with thermal bridges. Then additional medium-term (approx. 1 week) measurements of flow velocity, the resultant and the air temperature, relative humidity and CO₂ concentration were carried out with a datalogger measurement set under different operating modes of the air handling equipment and with different occupancy. Installation of long-term online monitoring of air temperature and relative humidity, CO₂ concentration, sound and barometric pressure levels followed. The results from the monitoring were processed and evaluated in the VISIEQ graphical output (Figure 5). All the data obtained formed a picture of the object, which was assessed and evaluated in the next step.
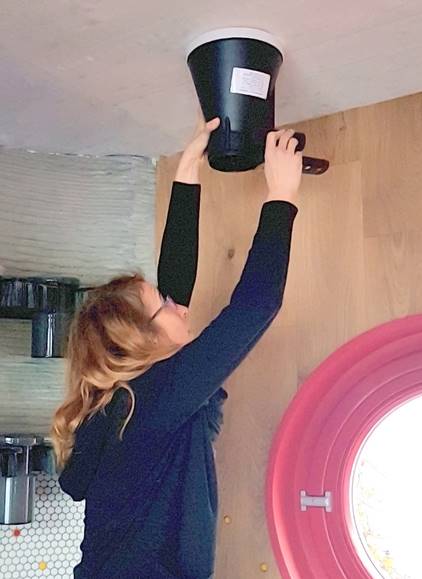
Figure 4. Verification of air flow at the exhaust of ventilation system.
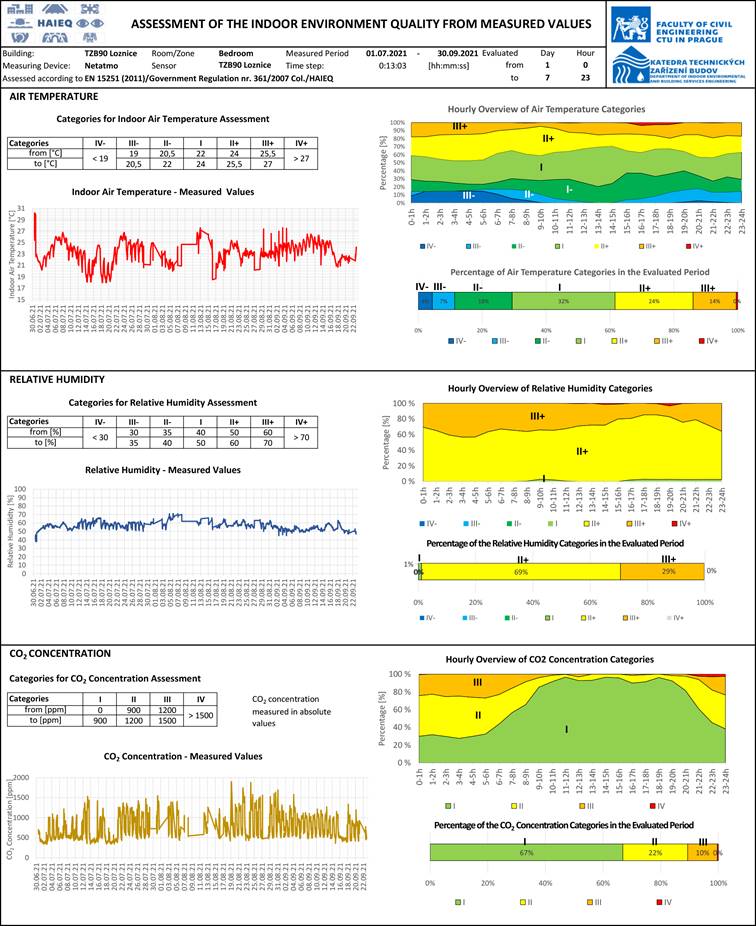
Figure 5. Evaluation of measured values in VISIEQ format.
The principle of the HAIEQ methodology, based on a 0/1/2/3 rating of a total of 48 sub-criteria grouped into 8 areas, provides a holistic view of the indoor environmental quality. The following tables summarise the results of the evaluation of each criterion and comment on the criteria rated 2 or 3.
Table 1. LS Evaluation of the locality and the location of an object in terms of the external environment and social relations.
Criterion | Grade | |
LS1 | Air quality (pollution) | 1 |
LS2 | Wind region | 1 |
LS3 | Noise from the surroundings | 1 |
LS4 | Orientation to cardinal points | 1 |
LS5 | Influence of heat island | 1 |
LS6 | Psychic perception of surroundings, interpersonal relationships | 1 |
LS7 | Risk of energy poverty | 0 |
LS | Average of non-zero values LS1 to LS7 | 1 |
No comments | ||
Table 2. STI Evaluation of building -construction and technical solution and interior.
Criterion | Grade | |
STI1 | Use of hazardous materials in building structures (asbestos, etc.) | 2 |
Risk of water vapor condensation on structures (thermal bridges) | 2 | |
STI3 | Use of hazardous materials for equipment (formaldehyde etc.) | 2 |
STI4 | Use of daylight | 1 |
STI5 | Active shielding and its control | 2 |
STI6 | Greenery in the interior | 1 |
STI7 | Visible defects and disorders (mold, leakage, cracks, poor surfaces, etc.) | 2 |
STI8 | Color space solution | 2 |
STI9 | Layout solution, occupancy of the zone | 2 |
STI10 | Maintenance | 2 |
STI | Average of non-zero values STI1 to STI10 | 1.8 |
Comments ST1: 3D printing from concrete is a new technology, and given the composition of the concrete mix, we recommend to monitor the indoor air quality. ST2: The details at the floor-wall interface show anomalies in terms of temperature field distribution and are potential areas of condensation. ST3: The use of non-traditional materials (table made from subfossil oak 6000 years old, mined in Ostrava + resin, in the kitchen there are on the shelves 220000 strips of veneer). ST5: External shading is not installed; internal shading is in the form of a roller shutter on the eastern window in the bedroom. ST7: Cracks in the structure caused by the transport of the building. The rough surface of the 3D printed wall with no surface treatment can increase the risk of dust deposition and mechanical cleaning systems should be used to clean it. ST8: The colour scheme of the space is avant-garde, matching the character of the building. It may have a psychological impact on more conservative individuals. ST9: The layout of the social facilities without door does not provide privacy. ST10: The technical design of building services systems (recirculating shower, ventilation unit with heat recovery, air conditioning, rainwater irrigation, intelligent control system programming) requires qualified operators. | ||
Table 3. TCW Evaluation of thermal comfort in the cold season.
Criterion | Grade | |
TCW1 | Choice of the heating system | 1 |
TCW2 | The ability of the heating system to adapt its operating mode in response to the users’ needs with due regard to user-friendliness, maintaining a healthy indoor environment – e.g. individual temperature control, user feedback – subjective environmental quality assessment | 1 |
TCW3 | The ability of the heating system to report energy usage to the user | 2 |
TCW4 | The ability of the heating system to report the quality of the indoor environment in terms of thermal comfort in cold to the user | 2 |
TCW5 | Summary of thermal comfort assessment results for the cold season from the measurement/simulation (e.g. risk of overheating of the zone in cold due to heat gains, under-heating, etc.) | 3 |
TCW6 | Summary of thermal comfort assessment results for the cold season from the questionnaire survey (if performed) | 0 |
TCW | Average of non-zero values TCW1 to TCW6 | 1,8 |
Comments TCW3: The control system of the building is providing the total energy use for all the systems, there is not any separate information about the energy use of the heating system. TCW4: There is only the air temperature reported, not the resulting temperature, which is insufficient in the case of radiant heating systems. TCW5: There were large temperature fluctuations during the measurements, probably caused by the ON/OFF control of the electric underfloor heating located and the storage layer of the floor. As a result, higher floor surface temperatures were also experienced. | ||
Table 4. TCS Evaluation of thermal comfort in the warm season.
Criterion | Grade | |
TCS1 | Choice of the cooling system | 2 |
TCS2 | The ability of the cooling system to adapt its operating mode in response to the users’ needs with due regard to user-friendliness, maintaining a healthy indoor environment – e.g. individual temperature control, user feedback – subjective environmental quality assessment | 1 |
TCS3 | The ability of the cooling system to report energy usage to the user | 2 |
TCS4 | The ability of the cooling system to report the quality of the indoor environment in terms of thermal comfort in cold season to the user | 1 |
TCS5 | Summary of thermal comfort assessment results for the warm season from measurement/simulation (e.g. risk of overheating of the zone in cold due to heat gains, under-heating, etc.) (if performed) | 1 |
TCS6 | Summary of thermal comfort assessment results for the warm season from the questionnaire survey (if performed) | 0 |
TCS | Average of non-zero values TCS1 to TCS6 | 1,4 |
Comments TCS1: Regarding the object design, the whole object is cooled in case of cooling requirement, it cannot be “zoned”, the object behaves as 1 zone (including the bathroom). TCS3: The control system of the building is providing the total energy use for all the systems, there isn’t any separate information about the energy consumption of the cooling system. | ||
Table 5. IAQ Evaluation of indoor air quality.
Criterion | Grade | |
IAQ1 | Choice of the ventilation system | 1 |
IAQ2 | The ability of the ventilation system to adapt its operating mode in response to the users’ needs with due regard to user-friendliness, maintaining a healthy indoor environment – e.g. user feedback – subjective environmental quality assessment | 3 |
IAQ3 | The ability of the ventilation system to report energy use to the user | 2 |
IAQ4 | The ability of the ventilation system to report the quality of the indoor environment in terms of indoor air quality | 3 |
IAQ5 | Summary of indoor air quality assessment results from measurement/simulation (if performed) | 3 |
IAQ6 | Summary of indoor air quality assessment results from the questionnaire survey (if performed) | 0 |
IAQ | Average of non-zero values IAQ1 to IAQ6 | 2,4 |
Comments IAQ2: Ventilation system is working in four modes with different air change rates depending on the chosen operation situation (0 %,30 %,60%, 100% of the total output of the AHU) without any monitoring of IAQ parameters. No automatic control of the ventilation system output. IAQ3: There is available just the information about the total energy use of the whole building not only for the ventilation system itself. IAQ4: No measurements of IAQ parameters are taken, so they aren’t available to the users. IAQ5: Based on the seven days measurement of CO₂ concentration it can be stated that 80% -90% of the time the IAQ is in category II (according to EN 16798-1). There were several rare episodes when the CO₂ concentration reached values above 1500 ppm and even above 4000 ppm. But it can be due to more people present in the building then it is designed to. An orientation measurement of formaldehyde performed within one hour detected its concentration. Averaged measured concentration was 0.2 ppm and this concentration is four times bigger than the limit concentration for residence rooms coming from the Czech standard (Decree No. 6/2003 Coll.). This situation can be due to the new and unconventional equipment of the building and it is supposed to decrease in time. Nevertheless, increased air change rate may help. | ||
Table 6. LC Evaluation of light comfort.
Criterion | Grade | |
LC1 | Choice of the lighting system | 1 |
LC2 | The ability of the lighting system to adapt its operating mode in response to the users’ needs with due regard to user-friendliness, maintaining a healthy indoor environment – e.g. regulation of intensity and spectrum of light sources in the workplace, user feedback – subjective environmental quality assessment | 2 |
LC3 | The ability of the lighting system to report energy usage to the user | 2 |
LC4 | The ability of the lighting system to report the quality of the indoor environment in terms of light comfort | 2 |
LC5 | Summary of light comfort assessment results from measurement/simulation (if performed) | 1 |
LC6 | Summary of light comfort assessment results from the questionnaire survey (if performed) | 0 |
LC | Average of non-zero values LC1 to LC6 | 1.6 |
Comments LC2: Although the system of LED luminaires and strips offers and allows great variability in colour and intensity, the creation of lighting scenes and their control requires user effort and is not intuitive. LC3: The control system of the building is providing the total energy use for all the systems, there isn’t any separate information about the energy consumption of the lighting system. LC4: There is no information about the quality of the light environment in the building provided to the user. | ||
Table 7. AC – Evaluation of acoustic comfort.
Criterion | Grade | |
AC1 | Sources of noise and measures to eliminate them | 2 |
The ability of the system to report the quality of the indoor environment in terms of acoustic comfort | 2 | |
AC3 | Summary of acoustic comfort assessment results from measurement/simulation (if performed) | 1 |
AC4 | Summary of acoustic comfort assessment results from the questionnaire survey (if performed) | 0 |
AC | Average of non-zero values AC1 to AC4 | 1,67 |
Comments AC1: Due to the open space, sounds spread throughout the space (e.g. sounds from the toilet and kitchen area). Door between living room and bathroom may help to solve this problem. AC2: There is no information about the quality of the acoustic environment in the building provided to the user. | ||
Table 8. EC Evaluation of electro-magnetic, -ionic,- static fields, ionizing radiation.
Criterion | Grade | |
|
| |
EC1 | Sources of Electro-magnetic, -ionic,- static fields, ionizing radiation and measures to eliminate their negative effects | 0 |
EC2 | Summary of assessment results from measurement/simulation (if performed) | 0 |
EC3 | Summary of assessment results from the questionnaire survey (if performed) | 0 |
EC | Average of non-zero values EC1 to EC3 | 0 |
Comments Not enough information for assessment. Despite the fact that electric devices installed in the building individually meet the limits for electromagnetic fields (kitchen appliances, hot water tank, air conditioning unit, LED light stripes, electric underfloor heating, smart toilet, shower, intelligent control with wireless data transmission), it is recommended to provide measurement and analysis of the electromagnetic fields and determine whether there is an increase in their intensity above the permissible limits. | ||
Table 9. Summary evaluation and potential for improvement.
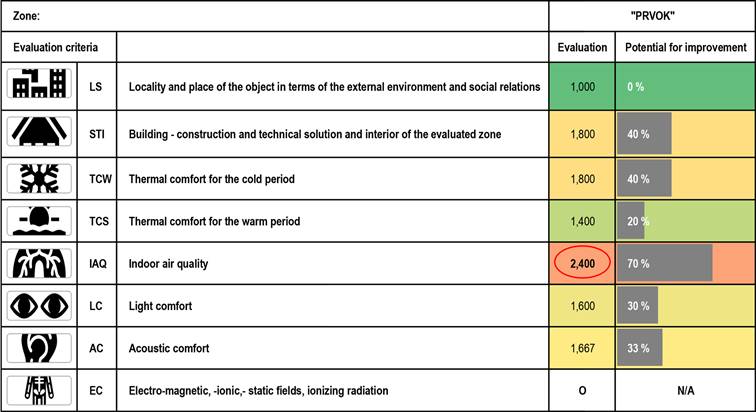
The HAIEQ assessment methodology allows a comprehensive holistic view of the assessed building in terms of the individual factors of the indoor environmental quality and its assessment. The method helped to identify the problems and showed potential areas for improvement.
Summarizing the findings obtained from the analysis of the investigated object, we can say that 3D printing technology brings new opportunities, especially in the freedom of the building shape and enables the realization of buildings with a distinctive architectural expression. The only problem area related to the structure was revealed by the thermal imaging camera, which identified potential condensation points in the detail at the floor-wall interface.
In terms of the quality of the indoor environment, the greatest potential for improvement was in the area of air quality. Due to the small volume of the building and the specific layout, taking into account measured values, it became clear that it would be advisable to control the HVAC according to CO₂concentration, humidity and to consider control according to VOC. In addition, repeated measurements of formaldehyde, which may be produced by the new equipment and can be expected to decrease in concentration during operation, should be made. The rough internal surface of the 3D printed structure requires more intensive maintenance and if neglected, increased airborne dust concentrations can be expected. The specific layout also causes acoustic problems between the different functional areas - bedroom, living area and sanitary facilities.
Our main objective was to test and evaluate a master control system that, in its basic configuration, enables the required functions and provides most of the necessary information. The subject of our further research and development is now the creation and testing of an advanced user interface that allows the user to modify the environment in a user-friendly way to a comfortable form, while getting feedback on its actual quality and energy performance.
The IEQ rating of this 3D object is not different from that of a conventionally constructed building. Most of the critical areas are not directly related to the 3D printing technology, but rather to the architectural design and operational management of the building.
This project was implemented with financial support from the state budget of the Czech Republic through the Ministry of Industry and Trade in the TRIO-FV40183 programme in cooperation with Brandtech company.
[1] https://www.scoolpt.com/pribeh-prvoka/
[2] KABELE, K., Z. VEVERKOVÁ, and M. URBAN. Metodika hodnocení kvality vnitřního prostředí v budovách s téměř nulovou spotřebou energie. [Applied Certified Methodology] 2019.
[3] KABELE, K., et al. Výroční zpráva projektu TRIO – FV40183 Rozšíření systému řízení produktu inteligentní dům. [Annual Report] Brand-Tech, 2019. Report no.1BLUYSSEN, P., M., 2009. The Indoor Environment Handbook How to Make Buildings Healthy and Comfortable United Kingdom: Earthscan ltd, ISBN: 13: 9781844077878.
[4] KABELE, K., Z. VEVERKOVÁ, and M. URBAN. Methodology of IEQ assessment in energy efficient buildings. In: Windsor 2020 Resilient Comfort. Windsor, 2020-04-16/2020-04-19. Witney: Ecohouse Initiative Ltd., 2020. p. 861-876. ISBN 978-1-9161876-3-4. Available from: https://windsorconference.com/proceedings/.
[5] VERBEKE S., WAIDE P., BETTGENHÄUSER K., USLAR M.; BOGAERT S. Et al., 2018. Support for setting up a Smart Readiness Indicator for buildings and related impact assessment - final report; August 2018; Brussels.
Follow us on social media accounts to stay up to date with REHVA actualities
0