


Stay Informed
Follow us on social media accounts to stay up to date with REHVA actualities
|
|
|
|
Theofanis Psomas | Despoina Teli | Sarka Langer | Pawel Wargocki |
Department of Architecture and Civil Engineering, Chalmers University of Technology, Gothenburg, Swedenth.psomas@gmail.com | Department of Architecture and Civil Engineering, Chalmers University of Technology, Gothenburg, Sweden | IVL Swedish Environmental Research Institute, Gothenburg, Sweden | Department of Civil Engineering, Technical University of Denmark, Denmark |
Dry air in buildings is prevalent in the Scandinavian countries, including Sweden, throughout the winter (heating season). In contrast to other types of buildings such as museums, residential buildings do not require indoor humidity assessment and control [1]. Nonetheless, relative humidity analysis is performed in northern climates primarily aiming at preventing moisture damage (e.g., in the crawl spaces and attics). Moisture damage is the primary source of building structural deterioration, but also cause “poor” indoor environmental quality, such as perception of “dampness”, especially in high-occupancy spaces [2]. The level of humidity inside a dwelling can be consequently considered as a critical quality component that affects satisfaction, health, stress level, learning and sleep quality [3].
In general, there is no commonly acknowledged limit for a low relative humidity value in conjunction with a tolerable exposure time [3-4]. Guidelines recommend a minimum relative humidity of about 30-40% as a comfort-related limit value (mainly for the thermal environment), whereas other research recommends a minimum relative humidity of about 20-30%, if health is taken into account [1-3]. Several respiratory problems, including asthma and allergies, dryness of the airways, dry hands and eye irritations have been linked to a low relative humidity level [3, 5].
Present paper describes the study aiming to: a) correlate relative humidity levels with the characteristics of residential buildings and occupancy; and b) associate low relative humidity levels with health symptoms and complaints. Both aims are achieved by analyzing a comprehensive and broad dataset from a national survey performed in Sweden.
Present analyses are based on the results obtained during BETSI project. This project was commissioned in 2006 by the Swedish National Board of Housing, Building, and Planning. The project's objective was to collect data on the indoor environmental conditions, energy use, and technical quality of the Swedish residential building stock, as well as on the users' comfort, satisfaction and health status. References [4, 6, 7] provide more information about the survey and the properties of the buildings and systems.
Between October 2007 and April 2008 (heating season), 678 residential buildings, 520 single-family dwellings, and 158 multi-family buildings were monitored for this study (measurements in living rooms). For the investigated dwellings, a list of 22 parameters, 13 categorical and 9 numerical, have been used to investigate possible correlations and associations with different relative humidity levels.
The dwellings were classified according to type of housing (detached single-family houses or apartments in multi-family houses), year of construction (<1960, 1961-1975, 1976-1985, 1986-1995, and 1996-2005), location (city center, suburb, residential neighborhood, and sparsely populated area), climate zone, ventilation system (return only, supply and return, supply and return with heat recovery, exhaust air heat pump, and natural ventilation), and heating system (wood stove, directly produced electricity, own combustion boiler, electric boiler, electric resistances, electric radiator, district heating, stove, local produced district heating, fireplace, pellet stove, heat pump, and other systems).
Indoor air temperature, ventilation air change rate, volume of the dwelling, indoor moisture supply, total U-value, number of occupants, and other numerical parameters were included (Figure 1-3). A list of 20 symptoms and complaints were listed as health-related criteria (Table 1; [4]).
Table 1. Examined 6health symptoms and complaints (last 3 months) and frequency of yes-responses for the “best” and “worst” assessment categories of relative humidity.
a/a | Symptoms | Cat. I-II (yes %) | Cat. III-IV (yes %) |
1 | Asthma+ | 9.0 | 9.6 |
2 | Cough | 33.9 | 27.8 |
3 | Difficulty to concentrate | 22.6 | 20.3 |
4 | Dry air | 23.1 | 24.0 |
5 | Dry or flushed facial skin | 18.4 | 13.1 |
6 | Dry, itching, red skin on hands | 19.5* | 13.5 |
7 | Dust and dirt | 34.8 | 33.1 |
8 | Eye sensitivity++ | 25.8 | 24.7 |
9 | Headache | 51.2 | 46.9 |
10 | Heavy head | 46.4 | 41.6 |
11 | Hoarse, dry throat | 25.6 | 23.8 |
12 | Irritated, stuffy or runny nose | 41.9 | 37.4 |
13 | Itching, burning, irritation of the eyes | 23.1 | 28.1 |
14 | Scaling, itching scalp or ears | 19.8* | 13.2 |
15 | Nausea, dizziness | 16.3 | 16.1 |
16 | Respiratory infection | 51.9* | 44.0 |
17 | Static electricity | 4.9 | 9.1* |
18 | Stuffy air | 25.6* | 16.4 |
19 | Stuffy smell++ | 24.3* | 12.8 |
20 | Fatigue | 71.1 | 70.6 |
+12 months, ++ In general, * Statistically significant | |||
To classify dwellings according to their monitored relative humidity levels, the research team used a classification system based on suggestions in the European Standard EN 16798:2019 [1, 8], which been adapted to fit the study's focus on low relative humidity levels (Table 2). The categories' lower limits are based on EN 16798:2019. This upper value is normal for indoor relative humidity (heating season), for these climatic conditions (no issues to human health or the construction elements [1]). The deviation percentage is set at 3% for each group [1]. Category IV is the lowest relative humidity category (followed by Cat. III), with the majority of monitored occurrences appearing at a relative humidity of less than 20% (Table 2).
Table 2. Relative humidity category boundaries (%).
Category | Lower and upper levels of relative humidity (%) |
I | 30-60 |
II | 25-60 |
III | 20-60 |
IV | <60 |
Our analyses show that about 37% of dwellings fall into Categories III and IV. For apartments, the biggest proportion belongs to Category III (36%), whereas for single-family houses, the highest proportion belongs to Category I (38%). Indoor low relative humidity appears to be more prevalent in dwellings with a higher temperature, a smaller volume, a higher ventilation rate and frequent airing practices, a lower inhabitant and pet count, and were primarily developed after 1985 in city suburbs and the northern part of the country (Figures 1-3). In Swedish buildings, ventilation without energy recovery appears to be a crucial role in controlling and optimizing indoor humidity levels. Over 70% of investigated cases had an average ventilation air change rate of less than 0.5 h-1 during the examined period. Reduced ventilation rates maintain acceptable relative humidity levels throughout the heating season but may create unsanitary and polluting conditions.
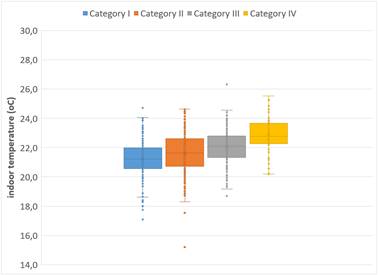
Figure 1. Boxplot of average indoor air temperature (°C) for the four relative humidity assessment categories.
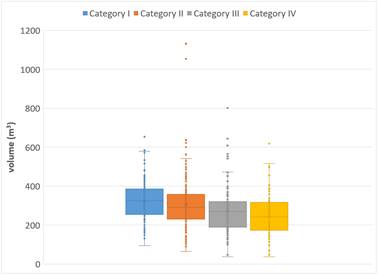
Figure 2. Boxplot of total heated building volume (m³) for the four relative humidity assessment categories.
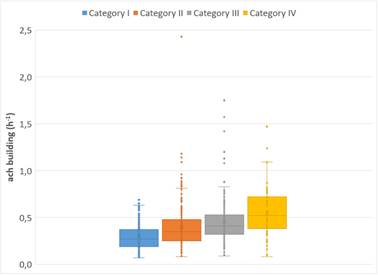
Figure 3. Boxplot of building level ventilation air change rate (h-1) for the four relative humidity assessment categories.
District heating is the primary method of heating apartments in Sweden. In terms of relative humidity, analyses show that district heating systems perform better in single-family houses than in apartments. Heat pumps, district heating, and directly produced electricity are the systems with the highest percentages in single-family homes. In terms of relative humidity levels, heat pumps appear to be a reliable solution in houses. Additionally, directly generated electricity systems provide a sustainable and very effective method of controlling relative humidity levels. The systems with the least optimal performance are those that utilize simply return air. According to the data, installing automated fans in bathrooms enhances the likelihood of the dwelling having an adequate moisture level. Indoor activities such as cooking and drying clothing significantly improve the indoor environment's relative humidity. Furthermore, for various residential building types, moisture supply values are suggested for optimum levels to minimize dry air [4].
Research team also analyzed the low relative humidity in connection with the prevalence of health symptoms and complaints including asthma, dry air sensation, itching-burning-irritation of the eyes and static electricity. Health problems such as fatigue, respiratory infections, and headaches had the highest ratio of yes-responses (Table 1).
Low indoor relative humidity has been shown to be an issue in Swedish dwellings and mostly apartments, during the heating season. Present analysis adds to the scientific literature by demonstrating a possible association between low relative humidity and particular health symptoms and complaints.
The research was developed within the framework of the project “I-CUB: Indoor Climate-Users-Buildings - interrelationships affecting residential thermal comfort and building related health symptoms”, which was financed by the Swedish Research Council FORMAS (project Nr 2018-00698).
1) ÖNORM EN 16798-1, Energy Performance of Buildings. Ventilation for Buildings. Indoor Environmental Input Parameters for Design and Assessment of Energy Performance of Buildings Addressing Indoor Air Quality, Thermal Environment, Lighting and Acoustics. Module M1-6, Austrian Standards, International Standardization and Innovation, Wien, 2019.
2) T. Alsmo, C. Alsmo, Ventilation and relative humidity in Swedish buildings, Environ. Protect. 5 (2014) 1022-1036.
3) M.M. Derby, M. Hamehkasi, S. Eckels, G.M. Hwang, B. Jones, R. Maghirang, D. Shulan, Update of the scientific evidence for specifying lower limit relative humidity levels for comfort, health, and indoor environmental quality in occupied spaces, Science and Technology for the Built Environment 23 (1) (2017) 30-45.
4) T. Psomas, D. Teli, S. Langer, P. Wahlgren, P. Wargocki, Indoor humidity of dwellings and association with building characteristics, behaviors and health in a northern climate, Build. Environ. 198 (2021) 107885.
5) A.V. Arundel, E.M. Sterling, J.H. Biggin, T.D. Sterling, Indirect health effects of relative humidity in indoor environments, Environ. Health Perspect. 65 (1986) 351-356.
6) S. Langer, T. Psomas, D. Teli, "I-CUB: ‘Indoor Climate-Users-Buildings’: Relationship between measured and perceived indoor air quality in dwellings." 8 International Building Physics conference (proceedings), Copenhagen, Denmark, 2021.
7) D. Teli, T. Psomas, S. Langer, A. Trüschel J.O. Dalenbäck, "Drivers of winter indoor temperatures in Swedish dwellings: Investigating the tails of the distribution." Building and Environment 202 (2021) 108018.
8) P. Wargocki, W. Wei, J. Bendžalová, C. Espigares-Correa, C. Gerard, O. Greslou, M. Rivallain, M.M. Sesana, B. Olesen, J. Zirngibl, C. Mandin, TAIL, a new scheme for rating indoor environmental quality in offices and hotels undergoing deep energy renovation (EU ALDREN project), Energy and Buildings 244 (2021) 111029.
Follow us on social media accounts to stay up to date with REHVA actualities
0