

Stay Informed
Follow us on social media accounts to stay up to date with REHVA actualities
|
|
Rob van Holsteijn | William Li |
MSc., Partner in VHKProject leader MONICAIRResearch Design and EngineeringVHKDelft, Netherlandsr.van.holsteijn@vhk.nl | MSc., Sr. Research EngineerResearch Design and EngineeringVHKDelft, Netherlandsw.li@vhk.nl |
The existing Ecodesign regulation (EU 1253/2014) and Energy Labelling regulation (EU 1254/2014) for ventilation units were published in 2014 and are applicable since 2016. The Ecodesign regulation sets minimum requirements that ventilation units need to comply with before being allowed on the EU-market. The Energy Labelling Regulation enforces the identification and communication of the energy performance of ventilation units. Both regulations are based on strictly defined assessment methods, described in the regulation text and related annexes.
In February 2019, the European Commission started a review study that was concluded in September 2020 (see https://www.ecoventilation-review.eu). In the final Report [1] the review study advocates that for the residential sector, greater emphasis on ventilation performance is needed. With the scheduled renovation wave (increasing insulation and airtightness levels of the building stock) and with the ongoing Covid-19 pandemic showing higher contamination rates in poorly ventilated spaces, the review study urges to include ventilation performance as a crucial parameter in the revised future regulations.
The preparatory study and impact assessment study that was performed for the 2014 regulations already attempted to include ventilation performance into the assessment methods. Because a methodology and commonly accepted performance denominators were lacking at the time, only a cautious approach could be used by linking the so-called CTRL-factors to the energy performance of the ventilation units (see associated regulation text). The review study however indicates that a more prominent role for ventilation performance would be imperative for any revised regulation.
Several long-term monitoring studies in various EU member states performed over the last six to seven years demonstrate, that building code compliant ventilation systems do not always bring the required ventilation performance. Moreover, the ventilation system that is most commonly applied throughout the EU (a central mechanical extract ventilation (MEV) unit that extracts air from extract spaces (ES) only and is controlled by a mechanical switch in kitchen or bathroom) does not bring the required air exchanges to the occupied rooms during many days of the heating season. Some examples are in Figures 1 and 2.
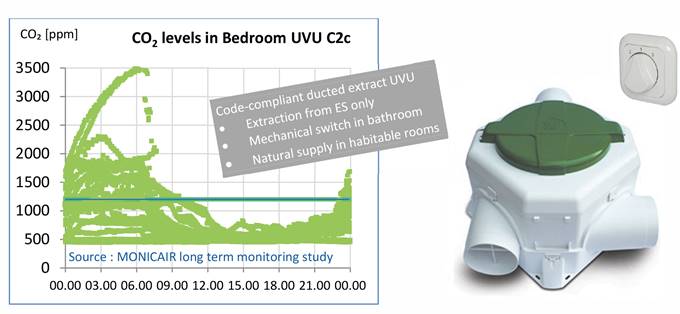
 Figure 1. Long-term monitoring results ducted extract UVU C2c.
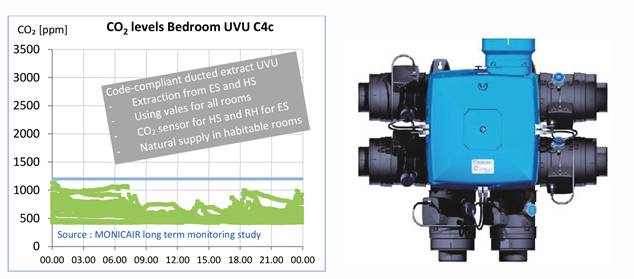
Figure 2. Long-term monitoring results ducted extract UVU C4c.
Figure 1 illustrates that in a bedroom occupied by two persons, such a code-compliant central extract UVU with a mechanical switch (extracting air from wet spaces only) does not achieve the required ventilation airflows during a larger part of the heating season. As a consequence, CO₂ concentrations may rise to values above 3500 ppm. Figure 2 on the other hand shows that another code-compliant extract UVU (a unit extracting air from all wet spaces and habitable spaces that uses valves for all rooms and is controlled by either a RH-sensor for ES or a CO₂-sensor for HS), performs considerably better. Throughout the heating season the CO₂ concentrations remain below the pre-set threshold of 1200 ppm CO₂. In the Task 2 report on ‘Markets’ the review study estimates that the largest share by far (around 70% of all ventilation units sold) consists of these ducted UVUs with a mechanical switch extracting air from ES only.
The monitoring data not only show that there are large differences in ventilation performance between the various types of ventilation units/systems, they also demonstrate that the existing building codes do not suffice to ensure adequate ventilation performance. In general, building codes prescribe the ventilation capacity that needs to be installed in each room (either naturally or mechanically driven) but whether these capacities are actually achieved when needed is no topic and remains unaddressed in building legislation. The report on ‘Use-phase Impacts’ gives information on the impact poor ventilation has on human health and productivity, and shows that poor indoor air quality plays a crucial role in the annual 500 000 premature deaths and over two million disability adjusted life years (DALYs) attributed to air pollution. It also negatively affects cognitive functions and productivity of office workers. Clearly, these impacts come with huge economic costs.
Till today, these differences in ventilation performance are not addressed and communicated with the market. In general, it is implicitly assumed that complying with buildings codes results in an adequate ventilation performance. The Task 4 report on technologies, indicates that manufacturers over the last five to six years have diligently been working on further improving the ventilation systems and related controls and are aware of the situation outlined above. Several manufacturers have even adjusted their market approach. From a company that produces and delivers a system component to a wholesaler, some are moving towards a company that supplies all crucial ventilation system components and facilitates the installation and final commissioning of the ventilation system. All with the aim of ensuring a good working ventilation system. Unfortunately, manufacturers encounter difficulties when selling these systems with improved ventilation performance. Project developers in charge of renovation and new building projects often opt for cheaper and simpler code-compliant systems. Legally this suffices, and the fact that their ventilation performance is poor is often not known and even considered a topic for the future inhabitants. Without legislative guidance, these purchase patterns will persist and the problem of poor ventilation remains unaddressed.
Since 2014 progress has been made on the topic of ventilation performance due to several scientific research projects. Performance-based approaches that have been proposed, are primarily consider metrics relating to the exposure to indoor generated pollutant concentration levels (usually CO₂) and condensation risk [2]. They prescribe ventilation strategies requiring the following constraints:
· Default airflows based on the size of the dwelling, number and type of occupants or combinations thereof;
· Minimum airflows during unoccupied periods;
· Short-term forced airflows to dilute and remove source pollutants generated by activities such as cooking, showering, cleaning, etc.
Several countries already prepare for using performance-based approaches in their national regulations. Generally, this ventilation performance is to be demonstrated by simulations using either MATHIS, CONTAM or COMIS multizone modelling software. However, the exposure thresholds (IAQ-indicators) that are proposed show large differences between countries. E.g. France uses a threshold limit of 2000 ppm CO₂ and allows a cumulative CO₂ exposure limit of 400 kppmh above 2000 ppm per room during the heating season. According to the latest EPB standard EN16798-1:2019 this threshold value of 2000 ppm CO₂ corresponds to the lowest performance category IV. The cumulative exposure limit value of 400 kppmh implies for instance that, with an average exceeding of 200 ppm over 2000, the concentration levels may exceed the 2000 ppm threshold for 2000 hours (almost half of the heating season!) in each room. Spain uses a threshold value of 1600 ppm CO₂ (corresponding to Category III performance according to a EN16798-1) and applies a cumulative exposure limit value of 500 kppmh above 1600 ppm per room over the whole year, indicating that Spain also allows long periods of exposure to values above 1600 ppm CO₂. The Netherlands uses a threshold value of 1200 ppm CO₂ (corresponding to Category II performance according to a EN16798-1) and proposes a cumulative exposure limit value of 30 kppmh above 1200 ppm per person during the heating season. With an average of e.g. 200 ppm exceeding 1200 ppm, the concentration levels may exceed this 1200 ppm threshold during 150 hours.
The differences in CO₂ exposure metrics between countries are strikingly high and cannot be explained by differences in dwellings, building materials or inhabitants. The question arises as to why countries use different and also relatively high threshold values that correspond to low ventilation performance levels and why countries would allow inhabitants to be exposed to even higher concentrations for such long periods? Allowing low performance levels for ventilation of course does imply that the minimum requirements as regards the energy performance of dwellings (following the EPBD-calculations) are easier to achieve. In that sense low performance metrics for ventilation can be seen as an effective administrative step towards achieving the EPBD goals for an energy neutral building stock in 2050. But this is not the way forward.
Another topic that requires attention in this context is the fact that the proposed performance-based approaches are all built on simulations. But simulations do not necessarily represent the real world. The ventilation unit showed in Figure 1 for instance may comply with the French and Spanish performance metrics (as will probably any other ventilation unit), but not with the Dutch performance metrics. For years, this particular unit was qualified as a well-performing unit in the Netherlands. The qualification was based on simulations with multizone modelling software. Input for these simulations were exemplary behaving inhabitants that always open the ventilation grids in the rooms they occupy and close them again when leaving; they also go to the bathroom to switch the ventilation to high when someone is present in the dwelling. Monitoring data demonstrate that this does not reflect the average behaviour of inhabitants. In real life ventilation grids often remain open or closed and the ventilation is only switched higher during showering and cooking. This example merely shows that if simulations are to be used to demonstrate compliance with performance metrics, it is crucial that the input parameters are a valid representation of the real world.
In June 2020 the new IEA-EBC Annex 86 on “Energy Efficient Smart IAQ Management for residential buildings” was approved. The goal of this Annex is to propose an integrated rating method for the performance assessment and optimisation of energy efficient strategies of managing the indoor air quality (IAQ) in new and existing residential buildings. The annex is currently in its 1-year preparation phase and will start its 3-year operation phase in June 2021. Experts from different fields including mechanical engineering, buildings science, chemistry, data science and environmental health will work together with other stakeholders towards consensus on the basic assumptions on which a performance assessment method, and related guidelines and tools will be built [3]. The final reports are expected in 2024.
In summary, one can conclude that performance-based approaches are indeed under investigation and under development, but not yet in the required status for a practical application in the revised ventilation unit regulation.
In anticipation of these developments, the review study proposes a practical method to include ventilation performance in the revised regulation for residential ventilation units by adjusting the method for determining the CTRL-factor that is to be used when calculating the energy performance of the ventilation unit. The practicality of the method is essential here, because market surveillance authorities need to be able to easily check the claims made by the manufacturer.
In the existing regulations this CTRL-factor is determined on the basis of the type of controls that are co-supplied with the ventilation unit (see Table 1).
Table 1. Control factor of existing regulations.
Type of control | CRTL-factor |
Manual | 1.00 |
Clock | 0.95 |
Central VDC | 0.85 |
Local VDC | 0.65 |
The new proposal uses a more sophisticated approach to draw up a new table where the CTRL-factor of a ventilation units relates to the average airflow rate this specific unit needs to achieve reference ventilation performance. By doing so, the energy performance calculations all relate to a specific reference ventilation performance which allows for a valid comparison of the energy performance between systems. For this approach the following principles were formulated:
1. Ventilation performance is defined as ‘the ability of a ventilation unit (and any co-supplied valves and/or controls) to induce the right air-exchanges in the right place at the right time’.
2. Reference ventilation airflows are taken from EN16798-1 [4] and relate to the Category II performance level for extract spaces (ES) and for habitable spaces (HS); for habitable spaces Category II performance relates to 800 ppm CO₂ above outdoor concentration during presence and to the values for basic ventilation rates during absence.
3. The ventilation units including attached system components, comply with applicable national building codes and ventilation regulations, and are installed following the manufacturers’ instructions.
4. The average EU-dwelling was defined as having a heated surface area of 92 m², 3 extract spaces (open kitchen, bathroom, toilet) and 3 habitable spaces with an overall airtightness of n50 = 2.
5. The average EU-occupancy schedule was defined indicating that during 63% of the day one or more of the inhabitants are in one or more of the habitable spaces of the dwelling of which 14% one or more of the extract spaces are also occupied; on average 50% of the habitable space is occupied and during occupation 75% of the inhabitants are on average present.
6. The distinctive technical characteristics of a ventilation system that largely determine the ventilation performance were defined. Not only the type of ventilation unit (with its internal leakages and flow-balance control features) and the related additional system components needed to build a building code compliant ventilation system are important here, but also the level at which valves are applied (central, zonal or local), the type and level of controls that are applied and their suitability for the room type they are used for.
Together with the IAQ taskforce of EVIA (European Ventilation Industry Association), the University of Ghent and VHK a Ventilation Performance Assessment Tool (VPAT) was developed, that enables the assessment of ‘the ability of a ventilation unit (and any co-supplied valves and/or controls) to induce the right air-exchanges in the right place at the right time’, based on the technical characteristics of the ventilation unit and its co-supplied valves and controls for a default average EU setting. In Figure 3, the technical input parameters are listed as well as the output parameters. The VPA-Tool is fully described in a reference document [5].
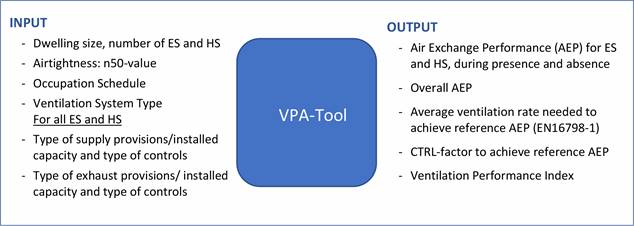
Figure 3. Schematic view of the Ventilation Performance Assessment Tool.
A preliminary and partial representation of the newly proposed CTRL-factors based on this VPA-Tool is given in Table 2 below for ducted UVUs and BVUs without flow-balance control and internal leakages above 3%, and in Table 3 for ducted BVUs with flow balance control and internal leakages of 3 % or below.
Table 2. Proposed control factors for the revised regulation for ducted UVUs and BVUs without flow balance control and internal leakages higher than 3%.
Type of VU | Type of controls | ||||||||
no control | manual | clock | central VDC-ES | central VDC-HS | zonal VDC-ES | zonal VDC-HS | local VDC-ES | local VDC-HS | |
UVU - no valves | 1.00 | 1.00 | 0.95 | 0.95 | 0.90 | 0.90 | 0.85 | 0.85 | 0.80 |
UVU + zonal valves | 1.00 | 0.95 | 0.90 | 0.95 | 0.90 | 0.80 | 0.75 | 0.75 | 0.65 |
UVU + valves for all rooms | 0.95 | 0.95 | 0.85 | 0.95 | 0.90 | 0.80 | 0.75 | 0.70 | 0.45 |
BVU1 - no valves | 0.95 | 0.95 | 0.90 | 0.90 | 0.85 | 0.85 | 0.80 | 0.80 | 0.65 |
BVU1 + zonal valves | 0.95 | 0.90 | 0.85 | 0.90 | 0.85 | 0.75 | 0.70 | 0.70 | 0.60 |
BVU1 + valves for all rooms | 0.95 | 0.80 | 0.75 | 0.90 | 0.85 | 0.75 | 0.70 | 0.70 | 0.50 |
BVU2 - no valves | 1.20 | 1.20 | 1.10 | 1.10 | 1.00 | 1.00 | 0.95 | 0.95 | 0.80 |
BVU2 + zonal valves | 1.20 | 1.05 | 1.00 | 1.10 | 1.00 | 0.95 | 0.90 | 0.90 | 0.75 |
BVU2 + valves for all rooms | 1.20 | 0.95 | 0.90 | 1.10 | 1.00 | 0.95 | 0.90 | 0.80 | 0.70 |
Table 3. Proposed control factors for the revised regulation for ducted BVUs with flow balance control and internal leakages ≤3%.
Type of VU | Type of controls | |||||||||
no control | manual | clock | central VDC-ES | central VDC-HS | zonal VDC-ES | zonal VDC-HS | local VDC-ES | local VDC-HS |
| |
BVU1 - no valves | 0.80 | 0.75 | 0.70 | 0.70 | 0.65 | 0.65 | 0.60 | 0.60 | 0.50 |
|
BVU1 + zonal valves | 0.80 | 0.75 | 0.65 | 0.70 | 0.65 | 0.60 | 0.55 | 0.55 | 0.45 |
|
BVU1 + valves for all rooms | 0.80 | 0.65 | 0.60 | 0.70 | 0.65 | 0.60 | 0.55 | 0.55 | 0.35 |
|
BVU2 - no valves | 1.00 | 1.00 | 0.90 | 0.90 | 0.85 | 0.85 | 0.80 | 0.80 | 0.65 |
|
BVU2 + zonal valves | 1.00 | 0.95 | 0.85 | 0.90 | 0.85 | 0.80 | 0.75 | 0.75 | 0.60 |
|
BVU2 + valves for all rooms | 1.00 | 0.90 | 0.80 | 0.90 | 0.85 | 0.80 | 0.75 | 0.65 | 0.50 |
|
Legend/explanation:
UVU = unidirectional ventilation unit (MEV-unit combined with natural supply grids in habitable spaces)
BVU1 = Bidirectional ventilation units, extracting air from wet spaces and supplying air in habitable spaces
BVU2 = Bidirectional ventilation units, extracting air from all ES and HS and supplying air in connecting spaces
Local = at the level of each individual room
Zonal = at the level of two and maximum three (combined) rooms
Central = at the level of the whole dwelling
VDC-HS = ventilation demand control device typically intended for habitable spaces (e.g. CO₂-sensor)
VDC-ES = ventilation demand control device typically intended for extract spaces (RH-sensor for bathroom/ kitchen, VOC for toilet/kitchen, PIR for toilet)
With this adjusted CTRL-factor, the energy performance calculations (SEC-values) all relate to a specific reference ventilation performance which allows for a valid comparison of the energy performance between systems. In addition to that, it is proposed to introduce the Ventilation Performance Index (VPI), which is the ratio of the average airflow the ventilation unit (and its co-supplied valves and controls) needs for achieving reference ventilation performance (Category II of EN16798-1) and the theoretical minimal airflow that is needed to achieve this. As such, the VPI-figure is an indicator for ‘the actual ability of a ventilation unit to induce the right air-exchanges in the right place at the right time’. It is proposed to display this VPI-figure on the energy label because it provides useful and very relevant information to consumers and other stakeholders. This can help guiding the market towards better performing ventilation systems and help changing the purchase habits.
The European Commission, based on the results of the review study, put forward a draft proposal on how to translate the recommendations into legal acts. Stakeholders were consulted in a consultation forum in March 2021 and the legal process will continue from there.
[1] Li, W., Elburg, M. van, Holsteijn, R.C.A. van, Wierda, L., Kemna, R., (2021) Documents prepared by the VHK-study team for the Review Study on Ecodesign and Energy Labelling Regulations for Ventilation Units, https://www.ecoventilation-review.eu.
[2] Guyot, G., Walker, I.S., Sherman, M.H., (2018), Performance based approaches in Standards and Regulations for smart ventilation in residential buildings: a summary review. International Journal of Ventilation, Volume 18, 2019, Issue 2.
[3] IEA-ECB Annex 86, Energy Efficient Smart IAQ Management for residential buildings, https://annex86.iea-ebc.org.
[4] EN16798-1:2019, Energy performance of buildings - Part 1: Indoor environmental input parameters for design and assessment of energy performance of buildings addressing indoor air quality, thermal environment, lighting and acoustics - Module M1-6, EUROPEAN COMMITTEE FOR STANDARDIZATION.
[5] Holsteijn, R.C.A. van, Li, W., Laverge, J., EVIA November 2020, VENTILATION PERFORMANCE ASSESSMENT TOOL, Calculation method for assessing the air exchange performance of residential mechanical ventilation units, Documentation related to the Excel Calculation Models.
Follow us on social media accounts to stay up to date with REHVA actualities
0