


Stay Informed
Follow us on social media accounts to stay up to date with REHVA actualities
|
|
|
|
Tomáš Fečer | Thea Solberg Hatten | Yang Bi | Guangyu Cao |
PhD studentInstitute of Computer Aided Engineering and Computer ScienceBrno University of Technology, Czech Republic | M.ScDepartment of Energy and Process EngineeringNorwegian University of Science and Technology | PhD studentDepartment of Energy and Process EngineeringNorwegian University of Science and Technology | Dr. (Sc.), ProfessorDepartment of Energy and Process EngineeringNorwegian University of Science and TechnologyKolbjørn Hejes vei 1b, 7491 Trondheim, Norwayguangyu.cao@ntnu.no |
Human beings spend approximately 90% of their time indoors [1]. Indoor air quality and thermal comfort are two important aspects that need to be taken into account when design the indoor environment. Indoor environments like healthcare facilities and hospitals, where the work performed could be potentially life-saving, it is especially important to ensure desired indoor environment quality. Bad indoor environment quality many increase the risk of life-threatening diseases and infections for the patient, such as Surgical Site Infection (SSI) [2]. The thermal comfort can be expressed as an indicator that shows how people may be satisfied with the thermal environment [3]. If thermal discomfort is experienced it can lead to less productive working conditions as the employees may be feeling too warm or too cold. An uncomfortable indoor environment may in turn cause health symptoms, like headaches, dizziness, concentration problems, apathy, and tiredness [4]. The work performed by the surgical staff is very important, and will potentially improve the life quality of people. Desired indoor environment should be achieved to ensure improved thermal comfort level for all the members of the surgical staff without compromising the patient thermal comfort.
In an ideal case, the indoor environment should satisfy all human beings that would feel thermally comfortable all the time, but according to Ole Fanger [5], that is not physically possible. This study will investigate, the thermal comfort level of surgical staff and patients under different relative humidity level in an OR at St. Olav’s hospital by using computational fluid dynamics simulation (CFD). CFD simulations are performed to analyze important thermal environmental factors such as air temperature, relative humidity, air velocity, heat distribution, and airflow patterns in an operating room.
CFD is an engineering tool derived from different disciplines of fluid mechanics and heat transfer [6]. Computational Fluid Dynamics (CFD) offers the same flexibility as the analytical methods and a lot of the detailed accuracy of the experimental methods [7]. Renormalized Group (RNG) k-ε model, which is used in this study, gives better predictions due to the lower amount of entrained air, compared to the standard model. The idea of the RNG k-ε is to filter out the smallest eddies [8].
The study is composed of three scenarios. Scenario 1 is also referred to as the base, whose values are validated by measurement. Scenarios 2 and 3 use different relative humidity levels. This is based on the fact that the operating room ventilation standards indicate that the relative humidity should range from 30 to 60%. However, the investigated operating room at St. Olavs has a low relative humidity of 20% within a period of the year. Supply air velocity, relative humidity, and supply air temperature are presented in Table 1.
Table 1. Simulation scenarios.
Case No. | Supply air temperature [°C] | Relative humidity [%] | Supply air velocity [m/s] |
Scenario 1 | 23 | 20 | 2.86 |
Scenario 2 | 23 | 40 | 2.86 |
Scenario 3 | 23 | 60 | 2.86 |
The geometrical model is made based on the real geometry of operating room 1 in the AHL department at St. Olavs Hospital with some simplification of medical equipment. The model is illustrated in Figure 1. The dimensions of the room are given in Table 2.
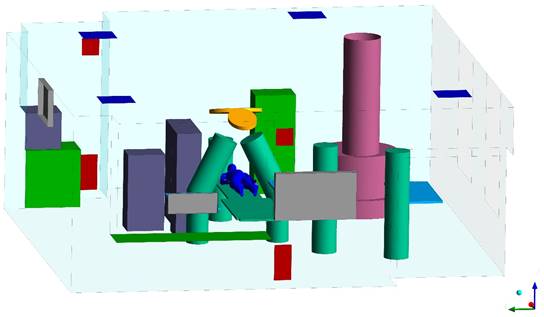
Figure 1. The geometry of the operating room at St. Olavs.
Table 2. Room dimensions of the simulation model.
Geometry | Value |
Room length | 7.9 m |
Room width | 7.2 m |
Room height | 2.9 m |
Area inlet | 0.6 m² |
Area lower outlet | 0.16 m² |
Area upper outlet | 0.078 m² |
One earlier study states that the acceptable measurements of air velocity in relation to thermal comfort should be down to below 0.1 m/s [9]. According to the operating room ventilation standards, VDI, a German standard, it requires that the air velocity in an operating room should be a minimum of 0.2 m/s. In this study, the simulated results show the air velocity is lower than 0.1 m/s in most of the room (see Figure 2). While at some specific locations, like close to the diffuser and above the surgical wound area, the air velocity is higher than 0.1 m/s. The average air velocity in all scenarios is approximately 0.09 m/s, which is within the thermal comfort guideline. None of the air velocity magnitudes are above 0.2 m/s, as required by VDI. The air velocities for each scenario are presented in Table 3.
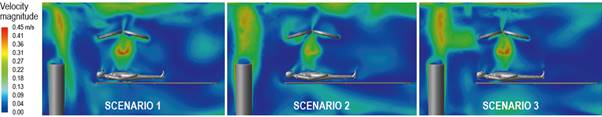
Figure 2. Air velocity of the cross-section plan of patient and anesthesia.
Table 3. Summary of the air velocities.
Role | Scenario 1 | Scenario 4 | Scenario 5 |
Surgeon | 10 m/s | 10 m/s | 0.10 m/s |
Assistant surgeon | 0.10 m/s | 0.10 m/s | 0.10 m/s |
Sterile nurse | 0.08 m/s | 0.08 m/s | 0.08 m/s |
Non-sterile nurse | 0.10 m/s | 0.11 m/s | 0.11 m/s |
Anesthesia | 0.09 m/s | 0.08 m/s | 0.08 m/s |
Patient | 0.09 m/s | 0.08 m/s | 0.07 m/s |
One study [10] states that the air temperature must never drop below 21°C for the patient. This is to prevent discomfort and health risks for the patient. Simulation results observed in table 4 it can be observed that the air temperature surrounding the patient is ranging between 22.7°C to 27.5°C. For each scenario, it can be observed that the surgeon and assistant surgeon are always experiencing the highest air temperature. This could be because they are located right below the surgical lamps and due to their high metabolic rate. The highest increase of temperature is for the anesthesia, where the air temperature increases by 0.5°C, from 24.4°C in Scenario 1 to 24.9°C in Scenario 3. Figure 3 shows that surgical lamps significantly heat of surgical site of patient for all three scenarios.
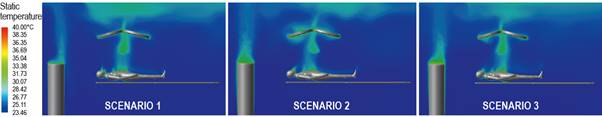
Figure 3. Air temperature of the cross-section plan of patient and anesthesia.
Table 4. Summary of the air temperatures close to patient and staff.
Role | Scenario 1 | Scenario 2 | Scenario 3 |
Surgeon | 25.6°C | 25.4°C | 25.6°C |
Assistant surgeon | 25.6°C | 25.4°C | 25.6°C |
Sterile nurse | 24.8°C | 25.1°C | 25.2°C |
Non-sterile nurse | 24.8°C | 25.0°C | 25.1°C |
Anesthesia | 24.4°C | 24.7°C | 24.9°C |
Patient | 25.0°C | 25.3°C | 25.2°C |
Table 5 show the simulated results of three scenarios of relative humidity. The variations in the relative humidity within each scenario are relatively small. The maximum difference between the highest and lowest value is found in Scenario 3. The surgeons have a surrounding relative humidity of 59.1% while the anesthesia has a surrounding relative humidity of 60.2%. For all cases except scenario 1, the surgeons, patient, and the anesthesia in scenarios 2 and 3, the surrounding relative humidity is lower than the supplied relative humidity. Figure 4 show the relative humidity distribution is to similar for all scenarios. The relative humidity is decreasing with increasing height which also occurs with temperature while the stratifies. This corresponds well with findings from a study conducted by Liu et al. [6]. In that study, it was found that for the surgical staff, the head experienced a relative humidity was lower while the rest of the body experienced a relative humidity was higher.
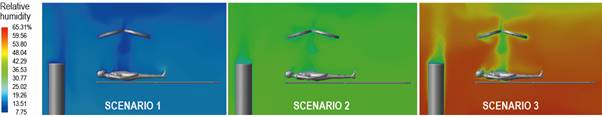
Figure 4. Relative humidity of the cross-section plan of patient and anesthesia.
Table 5. Summary of the relative humidity close to patient and staff.
Role | Scenario 1 | Scenario 2 | Scenario 3 |
Surgeon | 21.0% | 39.4% | 59.1% |
Assistant surgeon | 21.0% | 39.4% | 59.1% |
Sterile nurse | 20.8% | 39.3% | 59.8% |
Non-sterile nurse | 20.8% | 39.3% | 59.8% |
Anesthesia | 20.9% | 39.9% | 60.2% |
Patient | 20.2% | 39.4% | 59.5% |
The result observed in Table 6, none of the people present in the operating room experienced a PMV in the range 0.31-0.35, which Liu et al. found in their study,while the relative humidity was between 59-60% and the air temperature ranged from 24.5 to 27°C. Another study, conducted by Van Gaever et al. [11], found that the optimal value of PMV for the surgeon, assistant surgeon, nurses, and anesthesia in the operating room is 0.21, −0.30, −0.46, and −0.5, respectively. None of the members of the surgical staff in this study obtained a PMV close to the optimal value found by Van Gaever et al. According to ASHRAE, an acceptable thermal environment for general thermal comfort is achieved when the PMV lies within the range of −0.5 < PMV < +0.5 [1]. Based on this guideline, it is just the patient that has obtained general thermal comfort in scenarios 1, 2, and 3. All the members of the surgical staff have values of PMV that are outside the range given by ASHRAE.
Table 6. Calculated PMV and PPD based on simulated results.
| 1 | 2 | 3 | |
PMV [-] | Surgeon | 1.39 | 1.39 | 1.41 |
Assistant surgeon | 1.39 | 1.39 | 1.41 | |
Sterile nurse | 1.08 | 1.11 | 1.14 | |
Non-sterile nurse | 0.99 | 1.02 | 1.04 | |
Anesthesia | 0.91 | 0.95 | 0.99 | |
Patient | −0.43 | −0.33 | −0.27 | |
|
|
|
| |
| 1 | 2 | 3 | |
PPD [%] | Surgeon | 29.3 | 29.3 | 29.7 |
Assistant surgeon | 29.3 | 29.3 | 29.7 | |
Sterile nurse | 23.0 | 23.7 | 24.2 | |
Non-sterile nurse | 21.0 | 21.5 | 22.0 | |
Anesthesia | 18.8 | 19.9 | 20.6 | |
Patient | 8.7 | 7.1 | 6.5 | |
This study investigated the effect of relative humidity on thermal comfort by increasing the relative humidity to 40 and 60%. By comparing the results of the three scenarios, it was found that the thermal comfort level of the surgical staff is always between neutral and warm for all three scenarios. The surgeon and assistant surgeon have the same value for PMV in both Scenario 1 and Scenario 2. The difference between these two scenarios is that the relative humidity is changed from 20% in Scenario 1 to 40% in Scenario 2. For the rest of the surgical staff, the PMV is slightly increased from scenarios 1 to 3, while the patient experiences a better thermal comfort level when the relative humidity is increased. These results would indicate that it is possible to increase the relative humidity to 40% while the thermal comfort level stays warm for surgical staff. Relative humidity of 40% is also in compliance with what Oslo Universitetssykehus recommends for their operating rooms.
[1] Neil E. Kleieis, William C. Nelson, Wayne R. Ott, John P. Robinson, Andy M. Tsang, Paul Switzer, Joseph V. Behar, Stephen C. Hern, and William H. Engelmann. The national human activity pattern survey (nhaps). https://doi.org/10.1038/sj.jea.7500165, 2001.
[2] Zohaib Akhtar, Brian D Hesler, Alexa N Fiffick, Edward J Mascha, Daniel I Sessler, Andrea Kurz, Sabry Ayad, and Leif Saager. A randomized trial of prewarming on patient satisfaction and thermal comfort in outpatient surgery. Journal of Clinical Anesthesia, 33:376–385, 2016.
[3] Thermal environmental conditions for human occupancy. ANSI/ASHRAE standard, 55-2013, 2013.
[4] L. Lan, P. Wargocki, D. P. Wyon, and Z. Lian. Effects of thermal discomfort in an office on perceived air quality, sbs symptoms, physiological responses, and human performance. Indoor Air, 21(5):376–390, 2011.
[5] Povl Ole Fanger. Thermal comfort: Analysis and applications in environmental engineering. McGraw-Hill, New York.
[6] Jiyuan Tu, Guan Heng Yeoh, and Chaoqun Liu. Computational Fluid Dynamics - A practical approach. Butterworth-Heinemann, Burlington.
[7] Datawave Marine Solutions. What is cfd: Introduction to computational fluid dynamics. https://www.youtube.com/watch?v=jQHp49OyPn8, 2019.
[8] Tollef Hjermann. CFD simulation of active displacement ventilation. Master thesis. Norwegian University of Technology and Science (NTNU), 2017.
[9] Per Erik Nilsson. Achieving the desired indoor climate: Energy efficiency aspects of system design, 2003.
[10] J Khodakarami and N Nasrollahi. Thermal comfort in hospitals - a literature review. Renewable Sustainable Energy Reviews, 16(6):4071–4077, 2012.
[11] R Van Gaever, V.A Jacobs, M Diltoer, L Peeters, and S Vanlanduit. Thermal comfort of the surgical staff in the operating room. Building and Environment, 81:37–41, 2014.
Follow us on social media accounts to stay up to date with REHVA actualities
0