
Stay Informed
Follow us on social media accounts to stay up to date with REHVA actualities
|
Natasa Nord |
Norwegian University of Science and Technology, Department of Energy and Process Engineering, Trondheim, Norway, natasa.nord@ntnu.no |
The observed row house, shown in Figure 1, was built in 2013 according to the low-energy building requirements at that time. The house is located in Trondheim, Norway. Due to privacy protection, photos of the house are not shown. The usable area of the house is 115 m² according to the building documentation. The observed house is occupied by three family members, two adults and one kid. The house is private owned, while all the houses in the neighborhood are organized in a small fellowship.

Figure 1. Row low energy house in Trondheim, Norway.
The entire area of the row houses is connected to the district heating system. Since the entire area is the low energy building area, the area is separated with a heat exchanger and supplied with the lower supply temperature than the main district heating in Trondheim. Each flat has its own substation for the district heating with its own heat energy meter. The flat substation has two heat exchangers, one for the heating purpose and one for the domestic hot tap water. The heating system in the house consists of radiators in the rooms and floor heating in the bathrooms.
The house has its own ventilation system with a separate air handing unit. The air handing unit consists of the supply and exist fan, heat recovery wheel, an electric heater, and supply and exhaust filters. The air flow rate through the air handing unit should satisfied the requirements explained in Introduction section.
The installed air handing unit has neither monitoring of the indoor air temperature or CO₂ level for the control purpose. The fans are operating based on predefined settings. September 2016, the measurement of the indoor air temperature and CO₂ level in the above-mentioned rooms was performed. The results on the indoor air temperature and CO₂ level are shown in Figure 2 and Figure 3. Please note that some possible cause for change in the CO₂ level are noted in Figure 3.

Figure 2. Indoor air temperature in two observed rooms.
In Figure 2, it is evident that the indoor temperature was higher in the living room than in the bedroom. The reason for this was that intentionally the radiator was either on low or completely closed in the bedroom.
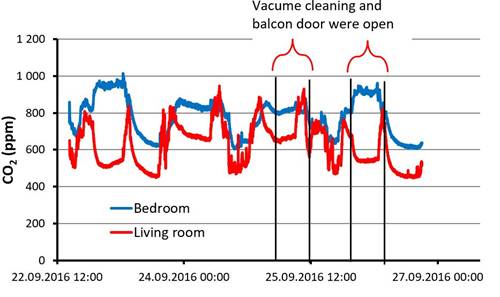
Figure 3. CO₂ level in two observed rooms.
In Figure 3, it may be noted that the CO₂ level was always higher in the bedroom on the ground floor. This happened due to issues in the air distribution and less air was delivered to the bedroom.
Before some key values on the energy and water use are given, it is important to note that the design outdoor temperature in Trondheim is -19°C. In this study heating, electricity, and water use were documented from 2014 to 2018. In that period, the winter 2014 was cold and the minimum monthly temperature was −4.1°C. Block plots for the monthly heat, electricity, and water use are given in Figure 4, Figure 5, and Figure 6, respectively.

Figure 4. Monthly heat use.

Figure 5. Monthly electricity use.

Figure 6. Monthly water use.
In Figure 4, it is possible to notice seasonality, higher heat uses during the colder months from October until April, and lower use during the warmer months from May until September. In the observed period, the average total annual heat use was 10 162 kWh and the specific annual heat use was 93.38 kWh/m². It is worth to note that for the observed house, a bigger variation in the heat use was noted in January, see Figure 4. The reason for this was that at the beginning of the house use, it was noted that the air from the ventilation was very cold. This happened because the supply outdoor air duct was fail connected and the cold air flown directly indoor without heat recovery. After the failure was corrected, the heating use in January decreased.
Finally, to identify factors influencing the heating use, the monthly heat use and the outdoor temperatures are compared as shown in Figure 7. The results in Figure 7 show a still good relationship between the outdoor temperature and the monthly heat use. This means that the heat use is still related to the outdoor temperature regardless of good insulation.

Figure 7. Monthly heat use vs. outdoor temperature.
Regarding the electricity and heat use, it was difficult to note any seasonality. A bigger variation in the water use in July was due to an extremely warm summer 2014, when much water was used for watering the grass. The total average annual electricity use was 3 609.6 kWh, while the total average annual water use was 109.58 m³. A significant decrease in the electricity use was achieved by changing the light to LED light.
Finally, the total specific energy use, a sum of the total specific heat and electricity use, in the observed house was 125.2 kWh/m². Compared to the Norwegian building code from 2010, the achieved results may be considered as suitable and satisfactory. In the observed house, the heat use share was about 70 % of the total energy use.
Finally, to evaluate economic benefits of the low energy house, cost data were analyzed. The economic indices in Table 1 were calculated based on the invoices in two years. In Norway, the electricity bill consists of two parts: electricity use and the electricity grid fee. The electricity grid fee is divided into two parts, energy part and the constant part. However, the constant part in the grid fee part is still constant for all the customers regardless of their use or the instantaneous power extraction. This means that for the households presented in this paper with low electricity use, the grid fee was consisting bigger part of the entire electricity bill. The district heating bill is consisting of only one, energy part. This means that the heat price per unit of heat is just multiplied with the monthly heat use. In addition to the energy bills, each household must pay different costs to the municipality. The municipality bill consists of different costs such as water use, water connections, wastewater, garbage, property tax, etc. Considering all these, all the costs are summarized in Table 1.
Table 1. Economic indices for the energy and water use.
| Heat | Electricity | Water | Municipality cost | Total |
Annual cost | EUR 935 | EUR 428 | EUR 149 | EUR 933 | EUR 2 445 |
Indices per unit of energy or water | 0.092 EUR/kWh | 0.17 EUR/kWh | 1.35 EUR/m³ | - | - |
Use and cost per m² | 93 kWh/m² | 43 kWh/m² | 14.87 m³/m² | 8.11 EUR/m² | 19.97 EUR/m² |
This paper presented the five years of experience living in the low energy house. In general, the achieved results and living in the house are good. All the installations are performing well, and the contractor was helping during the entire guaranty period. However, some lessons for further projects that may be learnt are related to the installation of ventilation system and energy pricing models. Regarding the ventilation system, the conclusion was that it should be installed by a high competent company and a proper balancing should be done after the installation. Regarding the electricity pricing model, the conclusion is that the model with the constant grid fee is not attractive for the users connected to the district heating. In nowadays, when the focus in energy sector is on decreasing peaks in electricity use, the houses and users able to decease their electricity load should be promoted.
Follow us on social media accounts to stay up to date with REHVA actualities
0